Machine Learning Contracts in London

Machine Learning (ML)
England > London

The table below provides summary statistics for contract job vacancies advertised in London requiring Machine Learning skills. It includes a benchmarking guide to the contractor rates offered in vacancies that cited Machine Learning over the 6 months leading up to 30 May 2025, comparing them to the same period in the previous two years.

6 months to
30 May 2025
Same period 2024 Same period 2023
Rank 86 90 182
Rank change year-on-year +4 +92 -27
Contract jobs citing Machine Learning 387 456 364
As % of all contract jobs advertised in London 3.18% 2.61% 1.43%
As % of the Processes & Methodologies category 3.45% 2.95% 1.57%
Number of daily rates quoted 251 368 261
10th Percentile £400 £427 £465
25th Percentile £463 £506 £525
Median daily rate (50th Percentile) £575 £600 £625
Median % change year-on-year -4.17% -4.00% +4.17%
75th Percentile £775 £750 £813
90th Percentile £881 £800 £950
England median daily rate £575 £588 £600
% change year-on-year -2.13% -2.08% -
Number of hourly rates quoted 2 6 5
10th Percentile £33.53 £41.25 -
25th Percentile £37.31 £41.56 £35.00
Median hourly rate £44.75 £46.25 £72.50
Median % change year-on-year -3.24% -36.21% +61.11%
75th Percentile £52.31 £49.88 £82.50
90th Percentile £56.18 £64.50 £87.00
England median hourly rate £77.50 £52.50 £37.75
% change year-on-year +47.62% +39.07% -16.11%

All Process and Methodology Skills
London

Machine Learning falls under the Processes and Methodologies category. For comparison with the information above, the following table provides summary statistics for all contract job vacancies requiring process or methodology skills in London.

Contract vacancies with a requirement for process or methodology skills 11,225 15,457 23,121
As % of all contract IT jobs advertised in London 92.24% 88.42% 90.86%
Number of daily rates quoted 7,536 11,093 16,726
10th Percentile £350 £340 £375
25th Percentile £431 £450 £475
Median daily rate (50th Percentile) £550 £550 £590
Median % change year-on-year - -6.78% +2.61%
75th Percentile £688 £675 £700
90th Percentile £800 £800 £800
England median daily rate £525 £525 £550
% change year-on-year - -4.55% +1.85%
Number of hourly rates quoted 189 316 265
10th Percentile £16.50 £15.50 £18.20
25th Percentile £23.80 £20.00 £22.50
Median hourly rate £31.35 £28.00 £39.42
Median % change year-on-year +11.95% -28.97% +12.39%
75th Percentile £49.75 £48.75 £64.50
90th Percentile £63.05 £66.88 £82.50
England median hourly rate £28.17 £37.50 £37.50
% change year-on-year -24.89% - +50.00%

Machine Learning
Job Vacancy Trend in London

Job postings citing Machine Learning as a proportion of all IT jobs advertised in London.
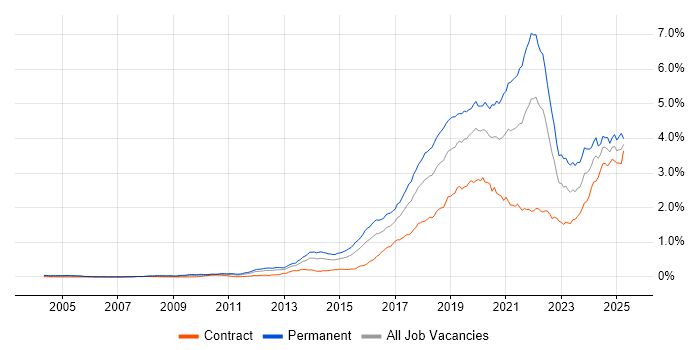
Job vacancy trend for Machine Learning in London

Machine Learning
Contractor Daily Rate Trend in London

3-month moving average daily rate quoted in jobs citing Machine Learning in London.

Daily rate trend for Machine Learning in London

Machine Learning
Daily Rate Histogram in London

Daily rate distribution for jobs citing Machine Learning in London over the 6 months to 30 May 2025.

Daily rate histogram for Machine Learning in London

Machine Learning
Contractor Hourly Rate Trend in London

3-month moving average hourly rates quoted in jobs citing Machine Learning in London.

Hourly rate trend for Machine Learning in London

Machine Learning
Hourly Rate Histogram in London

Hourly rate distribution of jobs citing Machine Learning in London over the 6 months to 30 May 2025.

Hourly rate histogram for Machine Learning in London

Machine Learning
Contract Job Locations in London

The table below looks at the demand and provides a guide to the median contractor rates quoted in IT jobs citing Machine Learning within the London region over the 6 months to 30 May 2025. The 'Rank Change' column provides an indication of the change in demand within each location based on the same 6 month period last year.

Location Rank Change
on Same Period
Last Year
Matching
Contract
IT Job Ads
Median
Daily Rate
Past 6 Months
Median Daily Rate
% Change
on Same Period
Last Year
Live
Jobs
Central London +25 53 £553 -13.50% 73
West London -5 3 £449 -22.00% 175
East London - 3 £585 - 11
South London - 1 £650 - 3
Machine Learning
England

Machine Learning
Co-occurring Skills and Capabilities in London by Category

The follow tables expand on the table above by listing co-occurrences grouped by category. The same employment type, locality and period is covered with up to 20 co-occurrences shown in each of the following categories:

Application Platforms
1 63 (16.28%) Apache Spark
2 10 (2.58%) Apache Airflow
2 10 (2.58%) Jupyter
3 8 (2.07%) Apache
4 2 (0.52%) Confluence
4 2 (0.52%) SAS
5 1 (0.26%) Apache Solr
5 1 (0.26%) ArcGIS
5 1 (0.26%) CMS
5 1 (0.26%) Luigi
5 1 (0.26%) Microsoft Exchange
Applications
1 12 (3.10%) Chatbot
2 3 (0.78%) Microsoft Excel
3 2 (0.52%) Adobe XD
3 2 (0.52%) Microsoft Office
3 2 (0.52%) Sketch
4 1 (0.26%) Siemens NX
4 1 (0.26%) SOLIDWORKS
Business Applications
1 1 (0.26%) Dynamics CRM
1 1 (0.26%) SAP QM
1 1 (0.26%) SAP S/4HANA
1 1 (0.26%) SAP SRM
1 1 (0.26%) Shopify
1 1 (0.26%) Sparx Enterprise Architect
1 1 (0.26%) Teamcenter
1 1 (0.26%) TrackWise
Cloud Services
1 140 (36.18%) Azure
2 133 (34.37%) AWS
3 62 (16.02%) GCP
4 45 (11.63%) Power Platform
5 34 (8.79%) Azure Data Factory
6 30 (7.75%) Azure Machine Learning
7 20 (5.17%) Amazon SageMaker
7 20 (5.17%) GitHub
7 20 (5.17%) Serverless
7 20 (5.17%) Snowflake
8 16 (4.13%) Azure DevOps
9 13 (3.36%) Amazon S3
9 13 (3.36%) AWS Lambda
9 13 (3.36%) GitHub Actions
10 12 (3.10%) dbt
11 10 (2.58%) Azure AI
12 8 (2.07%) Vertex AI
13 7 (1.81%) Azure Synapse Analytics
13 7 (1.81%) Figma
14 5 (1.29%) AWS Step Functions
Communications & Networking
1 7 (1.81%) Network Security
2 4 (1.03%) Firewall
3 3 (0.78%) Ethernet
3 3 (0.78%) Intrusion Detection
4 2 (0.52%) Internet
4 2 (0.52%) LAN
4 2 (0.52%) VPN
4 2 (0.52%) WAN
5 1 (0.26%) DHCP
5 1 (0.26%) DNS
5 1 (0.26%) Kerberos
5 1 (0.26%) Modbus
5 1 (0.26%) SMTP
Database & Business Intelligence
1 43 (11.11%) Power BI
2 40 (10.34%) Big Data
3 28 (7.24%) Tableau
4 27 (6.98%) Data Lake
5 19 (4.91%) Data Warehouse
6 18 (4.65%) Hadoop
7 17 (4.39%) PostgreSQL
8 13 (3.36%) NoSQL
9 11 (2.84%) BigQuery
9 11 (2.84%) Data Mining
10 10 (2.58%) Metadata
10 10 (2.58%) Neo4j
11 7 (1.81%) Delta Lake
11 7 (1.81%) SQL Server
12 6 (1.55%) Amazon Athena
12 6 (1.55%) Amazon Redshift
12 6 (1.55%) Apache Hive
12 6 (1.55%) Data Vault
13 5 (1.29%) DynamoDB
13 5 (1.29%) Geospatial Data
Development Applications
1 28 (7.24%) Jenkins
2 16 (4.13%) MLflow
3 14 (3.62%) Git
4 6 (1.55%) ERwin
4 6 (1.55%) JIRA
5 4 (1.03%) GitLab
6 2 (0.52%) Bitbucket
6 2 (0.52%) MagicDraw
7 1 (0.26%) Cypress.io
7 1 (0.26%) Qt Creator
7 1 (0.26%) Visual Studio
7 1 (0.26%) Visual Studio Code
General
1 93 (24.03%) Finance
2 89 (23.00%) Social Skills
3 72 (18.60%) Analytical Skills
4 53 (13.70%) Banking
5 39 (10.08%) Investment Banking
6 22 (5.68%) Public Sector
7 20 (5.17%) Organisational Skills
8 17 (4.39%) Retail
9 16 (4.13%) Front Office
9 16 (4.13%) Legal
10 15 (3.88%) Financial Institution
11 14 (3.62%) Marketing
12 13 (3.36%) Presentation Skills
13 10 (2.58%) Influencing Skills
14 7 (1.81%) Telecoms
15 5 (1.29%) Inclusion and Diversity
16 4 (1.03%) Police
16 4 (1.03%) Retail Banking
17 3 (0.78%) Corporate Banking
17 3 (0.78%) Publishing
Job Titles
1 59 (15.25%) Developer
2 54 (13.95%) Data Scientist
3 52 (13.44%) Architect
4 38 (9.82%) Senior
5 37 (9.56%) Lead
6 36 (9.30%) Data Engineer
7 34 (8.79%) Machine Learning Engineer
8 33 (8.53%) Python Developer
9 26 (6.72%) Analyst
10 21 (5.43%) Artificial Intelligence Developer
10 21 (5.43%) Artificial Intelligence Engineer
11 19 (4.91%) Gen AI Developer
12 17 (4.39%) Python Engineer
12 17 (4.39%) Senior Data Scientist
13 15 (3.88%) Data Architect
14 14 (3.62%) AWS Engineer
14 14 (3.62%) Azure Engineer
14 14 (3.62%) Data Analyst
14 14 (3.62%) Solutions Architect
15 11 (2.84%) Artificial Intelligence Architect
Libraries, Frameworks & Software Standards
1 44 (11.37%) TensorFlow
2 39 (10.08%) React
3 38 (9.82%) PyTorch
4 34 (8.79%) Pandas
5 29 (7.49%) FastAPI
6 28 (7.24%) scikit-learn
7 25 (6.46%) Django
8 19 (4.91%) .NET
8 19 (4.91%) PySpark
9 18 (4.65%) LangChain
10 16 (4.13%) NumPy
11 12 (3.10%) Kafka
11 12 (3.10%) REST
12 11 (2.84%) Plotly
13 10 (2.58%) Hugging Face
14 8 (2.07%) pydantic
14 8 (2.07%) RESTful
15 7 (1.81%) GraphQL
15 7 (1.81%) Play Framework
16 6 (1.55%) OpenTelemetry
Miscellaneous
1 54 (13.95%) Algorithms
2 21 (5.43%) Distributed Computing
3 14 (3.62%) Cloud Native
3 14 (3.62%) Distributed Systems
3 14 (3.62%) Product Ownership
4 11 (2.84%) Greenfield Project
5 8 (2.07%) Data Protection Act
5 8 (2.07%) FMCG
5 8 (2.07%) Public Cloud
6 7 (1.81%) Credit Risk
6 7 (1.81%) IoT
6 7 (1.81%) Multi-touch
6 7 (1.81%) Self-Motivation
7 6 (1.55%) Legacy Systems
8 5 (1.29%) AI Agents
8 5 (1.29%) Data Centre
8 5 (1.29%) Data Structures
8 5 (1.29%) Mobile App
8 5 (1.29%) Virtual Team
9 4 (1.03%) Analytical Mindset
Operating Systems
1 5 (1.29%) Linux
2 3 (0.78%) Windows
3 2 (0.52%) Apple iOS
4 1 (0.26%) Android
4 1 (0.26%) Unix
4 1 (0.26%) Windows Server
4 1 (0.26%) Windows Server 2003
Processes & Methodologies
1 262 (67.70%) Artificial Intelligence
2 156 (40.31%) Data Science
3 111 (28.68%) Analytics
4 86 (22.22%) Agile
5 85 (21.96%) CI/CD
6 84 (21.71%) LLM
7 83 (21.45%) Generative AI
8 78 (20.16%) Problem-Solving
9 68 (17.57%) DevOps
10 65 (16.80%) Data Pipeline
11 54 (13.95%) Visualisation
12 53 (13.70%) MLOps
13 50 (12.92%) Computer Science
13 50 (12.92%) Data Engineering
14 47 (12.14%) Business Intelligence
15 46 (11.89%) Data Modelling
16 45 (11.63%) Natural Language Processing
17 43 (11.11%) Data Visualisation
18 42 (10.85%) Data Analysis
18 42 (10.85%) SDLC
Programming Languages
1 248 (64.08%) Python
2 124 (32.04%) SQL
3 42 (10.85%) Java
4 33 (8.53%) TypeScript
5 30 (7.75%) R
6 28 (7.24%) JavaScript
7 20 (5.17%) C#
7 20 (5.17%) Scala
8 17 (4.39%) C++
9 14 (3.62%) C
10 9 (2.33%) Shell Script
11 8 (2.07%) Rust
12 5 (1.29%) Clojure
12 5 (1.29%) Elixir
12 5 (1.29%) Go
12 5 (1.29%) T-SQL
13 4 (1.03%) PowerShell
14 3 (0.78%) SystemVerilog
14 3 (0.78%) Tcl
15 2 (0.52%) Kusto Query Language
Qualifications
1 67 (17.31%) Degree
2 48 (12.40%) Security Cleared
3 41 (10.59%) SC Cleared
4 34 (8.79%) Master's Degree
5 27 (6.98%) PhD
6 22 (5.68%) Computer Science Degree
7 13 (3.36%) AWS Certification
8 6 (1.55%) CISSP
9 5 (1.29%) Azure Certification
10 4 (1.03%) CISM
11 3 (0.78%) BPSS Clearance
11 3 (0.78%) TOGAF Certification
12 2 (0.52%) CompTIA Security+
12 2 (0.52%) PMI Certification
12 2 (0.52%) PMP
13 1 (0.26%) AWS Certified Solutions Architect
13 1 (0.26%) ISEB
13 1 (0.26%) ITIL Foundation Certificate
13 1 (0.26%) Numerate Degree
13 1 (0.26%) SnowPro
Quality Assurance & Compliance
1 31 (8.01%) Data Quality
2 21 (5.43%) GDPR
3 16 (4.13%) QA
4 9 (2.33%) ISO/IEC 27001
5 8 (2.07%) NIST
6 7 (1.81%) EU AI Act
7 6 (1.55%) Accessibility
8 5 (1.29%) California Consumer Privacy Act
9 3 (0.78%) HIPAA
10 2 (0.52%) Actionable Recommendations
10 2 (0.52%) ISO/IEC 27002 (supersedes ISO/IEC 17799)
10 2 (0.52%) NCSC
10 2 (0.52%) SOC 2
11 1 (0.26%) 21 CFR Part 11
11 1 (0.26%) ISO 13485
11 1 (0.26%) ISO 9001
11 1 (0.26%) PCI DSS
11 1 (0.26%) Sarbanes-Oxley
System Software
1 56 (14.47%) Docker
2 2 (0.52%) Active Directory
3 1 (0.26%) BitLocker
3 1 (0.26%) Hyper-V
3 1 (0.26%) Microsoft App-V
3 1 (0.26%) Terminal Services
3 1 (0.26%) VMware ESXi
3 1 (0.26%) VMware Infrastructure
Systems Management
1 62 (16.02%) Kubernetes
2 23 (5.94%) Terraform
3 21 (5.43%) Ansible
4 8 (2.07%) Kubeflow
5 6 (1.55%) Kibana
6 4 (1.03%) Grafana
6 4 (1.03%) Prometheus
7 1 (0.26%) Apache Ranger
7 1 (0.26%) ITRS Geneos
7 1 (0.26%) logstash
7 1 (0.26%) Nagios
7 1 (0.26%) Puppet
7 1 (0.26%) Systems Management Server (SMS)
7 1 (0.26%) vCenter Server
7 1 (0.26%) vMotion
Vendors
1 63 (16.28%) Databricks
2 38 (9.82%) Microsoft
3 32 (8.27%) Google
4 10 (2.58%) Dataiku
4 10 (2.58%) OpenAI
5 9 (2.33%) Oracle
6 7 (1.81%) SAP
7 6 (1.55%) ServiceNow
8 5 (1.29%) DataRobot
9 4 (1.03%) Palantir
9 4 (1.03%) Talend
10 3 (0.78%) Adobe
10 3 (0.78%) Foundry
10 3 (0.78%) Intel
10 3 (0.78%) Salesforce
10 3 (0.78%) Xilinx
11 2 (0.52%) Genesys
11 2 (0.52%) IBM
12 1 (0.26%) Ariba
12 1 (0.26%) HP