Artificial Intelligence Contracts in London

Artificial Intelligence (AI)
England > London

The table below provides summary statistics for contract job vacancies advertised in London requiring Artificial Intelligence skills. It includes a benchmarking guide to the contractor rates offered in vacancies that cited Artificial Intelligence over the 6 months leading up to 1 May 2025, comparing them to the same period in the previous two years.

6 months to
1 May 2025
Same period 2024 Same period 2023
Rank 51 80 264
Rank change year-on-year +29 +184 +9
Contract jobs citing Artificial Intelligence 572 484 250
As % of all contract jobs advertised in London 4.56% 2.71% 0.92%
As % of the Processes & Methodologies category 4.95% 3.07% 1.01%
Number of daily rates quoted 404 352 161
10th Percentile £395 £425 £425
25th Percentile £463 £500 £513
Median daily rate (50th Percentile) £600 £600 £600
Median % change year-on-year - - +1.69%
75th Percentile £763 £750 £755
90th Percentile £879 £800 £913
England median daily rate £600 £600 £588
% change year-on-year - +2.13% +2.17%
Number of hourly rates quoted 3 6 2
10th Percentile £28.60 £27.19 £36.43
25th Percentile £29.50 - £38.56
Median hourly rate £32.00 £35.00 £42.75
Median % change year-on-year -8.57% -18.13% +14.00%
75th Percentile £41.38 £41.38 £47.56
90th Percentile £46.40 £61.13 £50.08
England median hourly rate £31.00 £46.18 £50.50
% change year-on-year -32.87% -8.55% +20.24%

All Process and Methodology Skills
London

Artificial Intelligence falls under the Processes and Methodologies category. For comparison with the information above, the following table provides summary statistics for all contract job vacancies requiring process or methodology skills in London.

Contract vacancies with a requirement for process or methodology skills 11,564 15,790 24,631
As % of all contract IT jobs advertised in London 92.16% 88.55% 91.11%
Number of daily rates quoted 7,847 11,316 17,711
10th Percentile £350 £338 £375
25th Percentile £440 £450 £475
Median daily rate (50th Percentile) £550 £550 £590
Median % change year-on-year - -6.78% +2.61%
75th Percentile £688 £675 £700
90th Percentile £813 £800 £800
England median daily rate £525 £525 £550
% change year-on-year - -4.55% +2.33%
Number of hourly rates quoted 166 324 278
10th Percentile £16.17 £16.00 £18.59
25th Percentile £22.68 £20.00 £22.53
Median hourly rate £31.67 £29.50 £38.13
Median % change year-on-year +7.36% -22.62% +5.90%
75th Percentile £50.75 £47.56 £62.64
90th Percentile £63.75 £65.93 £76.78
England median hourly rate £29.07 £36.00 £37.50
% change year-on-year -19.25% -4.00% +53.06%

Artificial Intelligence
Job Vacancy Trend in London

Job postings citing Artificial Intelligence as a proportion of all IT jobs advertised in London.
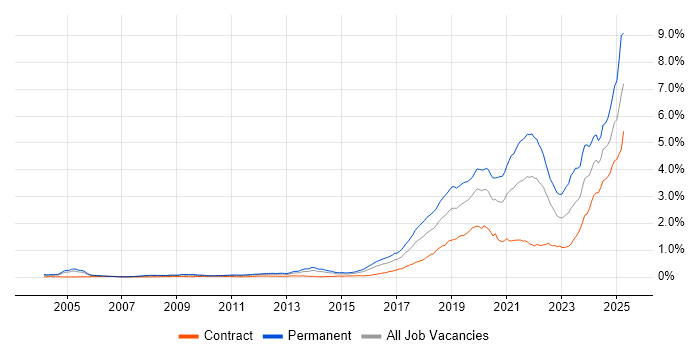
Job vacancy trend for Artificial Intelligence in London

Artificial Intelligence
Contractor Daily Rate Trend in London

3-month moving average daily rate quoted in jobs citing Artificial Intelligence in London.

Daily rate trend for Artificial Intelligence in London

Artificial Intelligence
Daily Rate Histogram in London

Daily rate distribution for jobs citing Artificial Intelligence in London over the 6 months to 1 May 2025.

Daily rate histogram for Artificial Intelligence in London

Artificial Intelligence
Contractor Hourly Rate Trend in London

3-month moving average hourly rates quoted in jobs citing Artificial Intelligence in London.

Hourly rate trend for Artificial Intelligence in London

Artificial Intelligence
Hourly Rate Histogram in London

Hourly rate distribution of jobs citing Artificial Intelligence in London over the 6 months to 1 May 2025.

Hourly rate histogram for Artificial Intelligence in London

Artificial Intelligence
Contract Job Locations in London

The table below looks at the demand and provides a guide to the median contractor rates quoted in IT jobs citing Artificial Intelligence within the London region over the 6 months to 1 May 2025. The 'Rank Change' column provides an indication of the change in demand within each location based on the same 6 month period last year.

Location Rank Change
on Same Period
Last Year
Matching
Contract
IT Job Ads
Median
Daily Rate
Past 6 Months
Median Daily Rate
% Change
on Same Period
Last Year
Live
Jobs
Central London +34 79 £613 +4.30% 152
East London - 9 £575 - 18
South London - 7 £700 - 6
North London -3 2 £650 +68.83% 1
Artificial Intelligence
England

Artificial Intelligence
Co-occurring Skills and Capabilities in London by Category

The follow tables expand on the table above by listing co-occurrences grouped by category. The same employment type, locality and period is covered with up to 20 co-occurrences shown in each of the following categories:

Application Platforms
1 32 (5.59%) Apache Spark
2 10 (1.75%) SharePoint
3 7 (1.22%) Apache Airflow
4 6 (1.05%) Apache
4 6 (1.05%) Microsoft Exchange
5 5 (0.87%) Jupyter
6 4 (0.70%) CMS
7 3 (0.52%) Cloud Foundry
7 3 (0.52%) Confluence
8 2 (0.35%) Drupal
8 2 (0.35%) SAS
9 1 (0.17%) Camunda
9 1 (0.17%) Facebook Platform
9 1 (0.17%) IBM Domino
9 1 (0.17%) Sitecore CMS
Applications
1 18 (3.15%) Chatbot
2 6 (1.05%) Camtasia
3 5 (0.87%) Microsoft Excel
3 5 (0.87%) Microsoft Project
4 4 (0.70%) Microsoft Office
5 3 (0.52%) Adobe XD
5 3 (0.52%) MS Visio
5 3 (0.52%) Sketch
6 2 (0.35%) Microsoft PowerPoint
6 2 (0.35%) Photoshop
7 1 (0.17%) AutoCAD
7 1 (0.17%) Final Cut Pro
7 1 (0.17%) Revit
7 1 (0.17%) Siemens NX
7 1 (0.17%) SOLIDWORKS
7 1 (0.17%) Trello
7 1 (0.17%) Weka
Business Applications
1 5 (0.87%) Shopify
2 3 (0.52%) Dynamics CRM
3 2 (0.35%) assyst
3 2 (0.35%) Remedy ITSM
3 2 (0.35%) Sparx Enterprise Architect
4 1 (0.17%) Distributed Ledger
4 1 (0.17%) Salesforce CRM
4 1 (0.17%) SAP QM
4 1 (0.17%) SAP SRM
4 1 (0.17%) Teamcenter
4 1 (0.17%) TrackWise
Cloud Services
1 128 (22.38%) Azure
2 115 (20.10%) AWS
3 61 (10.66%) GCP
4 50 (8.74%) Power Platform
5 31 (5.42%) GitHub
6 26 (4.55%) Microsoft 365
7 22 (3.85%) Serverless
8 21 (3.67%) Amazon SageMaker
8 21 (3.67%) Azure DevOps
8 21 (3.67%) Snowflake
9 18 (3.15%) AWS Lambda
9 18 (3.15%) Microsoft Copilot
10 16 (2.80%) Amazon S3
11 15 (2.62%) Azure Data Factory
12 14 (2.45%) GitHub Actions
12 14 (2.45%) Microsoft Purview
13 11 (1.92%) SaaS
14 10 (1.75%) Azure Machine Learning
14 10 (1.75%) dbt
15 9 (1.57%) Textract
Communications & Networking
1 6 (1.05%) Firewall
1 6 (1.05%) HTTP
2 4 (0.70%) Ethernet
2 4 (0.70%) VPN
3 3 (0.52%) DNS
3 3 (0.52%) Intrusion Detection
3 3 (0.52%) Network Security
4 2 (0.35%) Internet
4 2 (0.35%) NAS
4 2 (0.35%) SAN
4 2 (0.35%) SNMP
4 2 (0.35%) TCP/IP
4 2 (0.35%) VLAN
5 1 (0.17%) BGP
5 1 (0.17%) DHCP
5 1 (0.17%) HTTPS
5 1 (0.17%) LAN
5 1 (0.17%) MPLS
5 1 (0.17%) OSPF
5 1 (0.17%) SMTP
Database & Business Intelligence
1 40 (6.99%) Power BI
2 32 (5.59%) Big Data
3 24 (4.20%) Data Warehouse
4 21 (3.67%) PostgreSQL
5 15 (2.62%) Tableau
6 14 (2.45%) BigQuery
7 13 (2.27%) NoSQL
8 12 (2.10%) Hadoop
9 11 (1.92%) Data Lake
9 11 (1.92%) Metadata
10 9 (1.57%) Data Mining
10 9 (1.57%) Delta Lake
10 9 (1.57%) Oracle Database
11 8 (1.40%) Snowflake Schema
12 6 (1.05%) Apache Hive
13 5 (0.87%) Data Vault
13 5 (0.87%) Relational Database
14 4 (0.70%) Amazon Redshift
14 4 (0.70%) DynamoDB
14 4 (0.70%) Looker
Development Applications
1 40 (6.99%) Jenkins
2 20 (3.50%) Git
3 13 (2.27%) JIRA
4 11 (1.92%) MLflow
5 7 (1.22%) Bitbucket
6 6 (1.05%) GitLab
6 6 (1.05%) Gradle
6 6 (1.05%) IntelliJ
6 6 (1.05%) Maven
7 5 (0.87%) Cypress.io
7 5 (0.87%) ERwin
8 4 (0.70%) Atlassian Bamboo
8 4 (0.70%) Bitbucket Server
8 4 (0.70%) JUnit
8 4 (0.70%) Postman
8 4 (0.70%) SonarQube
8 4 (0.70%) Terragrunt
8 4 (0.70%) Visual Studio Code
9 3 (0.52%) Mocha
10 2 (0.35%) Eclipse
General
1 179 (31.29%) Finance
2 151 (26.40%) Social Skills
3 115 (20.10%) Analytical Skills
4 76 (13.29%) Banking
5 45 (7.87%) Investment Banking
6 44 (7.69%) Front Office
7 36 (6.29%) Public Sector
8 32 (5.59%) Legal
9 26 (4.55%) Financial Institution
9 26 (4.55%) Marketing
10 23 (4.02%) Retail
11 21 (3.67%) Organisational Skills
12 15 (2.62%) Inclusion and Diversity
12 15 (2.62%) Presentation Skills
13 13 (2.27%) Law
14 11 (1.92%) Local Government
15 7 (1.22%) Advertising
15 7 (1.22%) Influencing Skills
16 6 (1.05%) Manufacturing
16 6 (1.05%) Publishing
Job Titles
1 105 (18.36%) Developer
2 68 (11.89%) Senior
3 54 (9.44%) Analyst
4 50 (8.74%) Python Developer
5 47 (8.22%) Architect
6 43 (7.52%) Business Analyst
6 43 (7.52%) Lead
7 34 (5.94%) Data Engineer
8 32 (5.59%) Data Scientist
8 32 (5.59%) Product Manager
9 30 (5.24%) Artificial Intelligence Developer
9 30 (5.24%) Artificial Intelligence Engineer
10 29 (5.07%) Gen AI Developer
11 26 (4.55%) Python Engineer
12 24 (4.20%) Consultant
13 23 (4.02%) Business Manager
13 23 (4.02%) Project Manager
14 20 (3.50%) Full-Stack Developer
15 18 (3.15%) Product Analyst
15 18 (3.15%) Product Business Analyst
Libraries, Frameworks & Software Standards
1 59 (10.31%) FastAPI
2 55 (9.62%) React
3 38 (6.64%) TensorFlow
4 34 (5.94%) Django
4 34 (5.94%) PyTorch
5 27 (4.72%) Pandas
6 26 (4.55%) scikit-learn
7 24 (4.20%) .NET
7 24 (4.20%) LangChain
8 21 (3.67%) NumPy
9 19 (3.32%) REST
10 17 (2.97%) Kafka
10 17 (2.97%) Node.js
11 16 (2.80%) RESTful
12 12 (2.10%) Flask
12 12 (2.10%) pydantic
13 11 (1.92%) Hugging Face
13 11 (1.92%) PySpark
14 10 (1.75%) SciPy
14 10 (1.75%) Spring
Miscellaneous
1 38 (6.64%) Algorithms
2 33 (5.77%) Product Ownership
3 21 (3.67%) Distributed Systems
3 21 (3.67%) Equities
3 21 (3.67%) Foreign Exchange (FX)
4 20 (3.50%) Hedge funds
5 19 (3.32%) Derivative
5 19 (3.32%) Fixed Income
6 18 (3.15%) Management Information System
7 17 (2.97%) Onboarding
8 14 (2.45%) Distributed Computing
9 13 (2.27%) Greenfield Project
10 12 (2.10%) Cloud Native
10 12 (2.10%) Educational Technology
11 11 (1.92%) AI Agents
11 11 (1.92%) Legacy Systems
12 9 (1.57%) Public Cloud
13 8 (1.40%) Data Centre
14 7 (1.22%) Data Structures
15 6 (1.05%) Mobile App
Operating Systems
1 22 (3.85%) Apple iOS
2 8 (1.40%) Linux
3 7 (1.22%) Android
4 6 (1.05%) Windows
5 2 (0.35%) Unix
6 1 (0.17%) Windows Server
6 1 (0.17%) Windows Server 2003
Processes & Methodologies
1 281 (49.13%) Machine Learning
2 142 (24.83%) Agile
3 140 (24.48%) Generative AI
4 126 (22.03%) Problem-Solving
5 120 (20.98%) Data Science
6 118 (20.63%) LLM
7 113 (19.76%) Analytics
8 110 (19.23%) CI/CD
9 98 (17.13%) DevOps
10 60 (10.49%) Roadmaps
11 57 (9.97%) Use Case
12 52 (9.09%) Continuous Improvement
13 51 (8.92%) SDLC
14 49 (8.57%) Software Engineering
14 49 (8.57%) Stakeholder Management
15 48 (8.39%) Business Intelligence
16 47 (8.22%) Data Pipeline
17 46 (8.04%) Data Engineering
18 45 (7.87%) Decision-Making
19 42 (7.34%) Full-Stack Development
Programming Languages
1 254 (44.41%) Python
2 121 (21.15%) SQL
3 62 (10.84%) Java
4 52 (9.09%) TypeScript
5 35 (6.12%) JavaScript
6 29 (5.07%) C#
7 22 (3.85%) Scala
8 15 (2.62%) C++
9 14 (2.45%) R
10 11 (1.92%) C
10 11 (1.92%) Rust
11 10 (1.75%) Shell Script
12 8 (1.40%) Clojure
12 8 (1.40%) T-SQL
13 7 (1.22%) Elixir
14 6 (1.05%) BeanShell
14 6 (1.05%) PowerShell
15 5 (0.87%) Bash
15 5 (0.87%) Data Analysis Expressions
15 5 (0.87%) Go
Qualifications
1 88 (15.38%) Degree
2 45 (7.87%) Security Cleared
3 39 (6.82%) SC Cleared
4 22 (3.85%) Computer Science Degree
5 20 (3.50%) Master's Degree
6 12 (2.10%) PhD
7 10 (1.75%) CISSP
8 9 (1.57%) Azure Certification
9 7 (1.22%) AWS Certification
10 6 (1.05%) CISM
10 6 (1.05%) PMI Certification
10 6 (1.05%) PMP
11 4 (0.70%) Microsoft Certification
12 2 (0.35%) CompTIA Security+
12 2 (0.35%) SnowPro
12 2 (0.35%) Tableau Certification
12 2 (0.35%) TOGAF Certification
13 1 (0.17%) AWS Certified Solutions Architect
13 1 (0.17%) BPSS Clearance
13 1 (0.17%) CSPO
Quality Assurance & Compliance
1 35 (6.12%) Data Quality
2 23 (4.02%) GDPR
3 20 (3.50%) QA
4 16 (2.80%) Accessibility
5 12 (2.10%) ISO/IEC 27001
6 9 (1.57%) EU AI Act
7 8 (1.40%) NIST
8 6 (1.05%) PMO
9 5 (0.87%) California Consumer Privacy Act
10 2 (0.35%) Actionable Recommendations
10 2 (0.35%) ISO 20022
10 2 (0.35%) NCSC
10 2 (0.35%) Sarbanes-Oxley
10 2 (0.35%) WCAG
11 1 (0.17%) 21 CFR Part 11
11 1 (0.17%) GRC
11 1 (0.17%) HIPAA
11 1 (0.17%) ISO 13485
11 1 (0.17%) ISO 9001
11 1 (0.17%) PCI DSS
System Software
1 73 (12.76%) Docker
2 10 (1.75%) Active Directory
3 3 (0.52%) VMware ESXi
3 3 (0.52%) VMware Infrastructure
4 2 (0.35%) vSphere
5 1 (0.17%) BitLocker
5 1 (0.17%) Hyper-V
5 1 (0.17%) Microsoft App-V
5 1 (0.17%) OpenAM
5 1 (0.17%) OpenDJ
5 1 (0.17%) OpenIDM
5 1 (0.17%) Slurm Workload Manager
5 1 (0.17%) Terminal Services
5 1 (0.17%) Virtual Machines
Systems Management
1 88 (15.38%) Kubernetes
2 37 (6.47%) Terraform
3 32 (5.59%) Ansible
4 5 (0.87%) Grafana
4 5 (0.87%) Kubeflow
4 5 (0.87%) Prometheus
5 4 (0.70%) Microsoft Intune
6 2 (0.35%) Dell DRAC
6 2 (0.35%) Nagios
6 2 (0.35%) Puppet
7 1 (0.17%) Proxmox
7 1 (0.17%) Systems Management Server (SMS)
7 1 (0.17%) vCenter Server
7 1 (0.17%) vMotion
Vendors
1 69 (12.06%) Microsoft
2 38 (6.64%) Google
3 35 (6.12%) Databricks
4 20 (3.50%) Oracle
4 20 (3.50%) ServiceNow
5 16 (2.80%) OpenAI
6 14 (2.45%) SAP
7 12 (2.10%) Salesforce
8 11 (1.92%) Adobe
9 9 (1.57%) Splunk
10 8 (1.40%) Dataiku
11 6 (1.05%) IBM
11 6 (1.05%) Sitecore
12 5 (0.87%) Foundry
12 5 (0.87%) Palantir
13 4 (0.70%) Intel
13 4 (0.70%) MicroStrategy
13 4 (0.70%) Red Hat
13 4 (0.70%) Talend
13 4 (0.70%) Xilinx