Public Sector Contracts with Hybrid/Remote/WFH Options

Public Sector
UK > Work from Home

The table below looks at the prevalence of the term Public Sector in remote or hybrid contract work. Included is a benchmarking guide to the contractor rates offered in vacancies that cited Public Sector over the 6 months leading up to 5 August 2025, comparing them to the same period in the previous two years.

6 months to
5 Aug 2025
Same period 2024 Same period 2023
Rank 23 18 15
Rank change year-on-year -5 -3 0
Contract jobs citing Public Sector 849 1,182 2,178
As % of all contract jobs with a WFH option 8.38% 8.96% 9.71%
As % of the General category 13.34% 15.22% 16.61%
Number of daily rates quoted 608 851 1,692
10th Percentile £350 £263 £313
25th Percentile £425 £413 £425
Median daily rate (50th Percentile) £500 £500 £525
Median % change year-on-year - -4.76% +0.96%
75th Percentile £588 £600 £650
90th Percentile £652 £700 £743
UK median daily rate £500 £500 £525
% change year-on-year - -4.76% +1.94%
Number of hourly rates quoted 20 40 24
10th Percentile £14.78 £13.16 £16.20
25th Percentile £15.03 £20.45 £19.11
Median hourly rate £21.27 £25.13 £24.86
Median % change year-on-year -15.35% +1.10% -9.62%
75th Percentile £65.25 £57.81 £45.94
90th Percentile £68.75 £87.46 £66.00
UK median hourly rate £19.83 £23.21 £20.10
% change year-on-year -14.54% +15.45% +0.50%

All General Skills
Work from Home

Public Sector falls under the General Skills category. For comparison with the information above, the following table provides summary statistics for all contract job vacancies with remote or hybrid options requiring common skills.

Contract vacancies with a requirement for common skills 6,365 7,764 13,116
As % of all contract jobs with a WFH option 62.85% 58.84% 58.46%
Number of daily rates quoted 4,194 5,019 9,140
10th Percentile £325 £325 £350
25th Percentile £413 £425 £450
Median daily rate (50th Percentile) £513 £538 £550
Median % change year-on-year -4.65% -2.27% -
75th Percentile £638 £650 £675
90th Percentile £788 £800 £775
UK median daily rate £500 £525 £550
% change year-on-year -4.76% -4.55% -
Number of hourly rates quoted 220 321 301
10th Percentile £14.00 £16.50 £18.50
25th Percentile £17.51 £27.84 £25.71
Median hourly rate £34.00 £43.00 £47.50
Median % change year-on-year -20.93% -9.47% +35.71%
75th Percentile £64.52 £57.50 £65.00
90th Percentile £72.75 £72.50 £75.00
UK median hourly rate £25.15 £38.12 £30.00
% change year-on-year -34.02% +27.07% +21.53%

Public Sector
Trend for Jobs with a WFH Option

Job vacancies with remote working options citing Public Sector as a proportion of all IT jobs advertised.
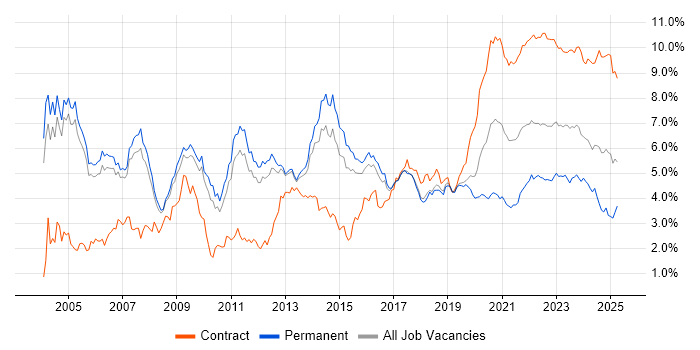
Public Sector trend for jobs with Hybrid/Remote/WFH options

Public Sector
Daily Rate Trend for Jobs with a WFH Option

3-month moving average daily rate quoted in job vacancies with remote working options citing Public Sector.

Public Sector daily rate for jobs with a WFH option

Public Sector
Daily Rate Histogram for Jobs with a WFH Option

Daily rate distribution for jobs with remote working options citing Public Sector over the 6 months to 5 August 2025.

Public Sector daily rate histogram for jobs with a WFH option

Public Sector
Hourly Rate Trend for Jobs with a WFH Option

3-month moving average hourly rate quoted in job vacancies with remote working options citing Public Sector.

Public Sector hourly rate for jobs with a WFH option

Public Sector
Hourly Rate Histogram for Jobs with a WFH Option

Hourly rate distribution for jobs with remote working options citing Public Sector over the 6 months to 5 August 2025.

Public Sector hourly rate histogram for jobs with a WFH option

Public Sector
Co-occurring Skills and Capabilities with WFH Options by Category

The follow tables expand on the table above by listing co-occurrences grouped by category. The same employment type, locality and period is covered with up to 20 co-occurrences shown in each of the following categories:

Application Platforms
1 34 (4.00%) Confluence
1 34 (4.00%) SharePoint
2 10 (1.18%) Microsoft Exchange
3 7 (0.82%) Apache Spark
3 7 (0.82%) nginx
4 6 (0.71%) Apache
4 6 (0.71%) ArcGIS
5 5 (0.59%) Apache Airflow
6 4 (0.47%) Exchange Server 2013
6 4 (0.47%) WordPress
7 3 (0.35%) Camunda
7 3 (0.35%) CMS
7 3 (0.35%) Oracle Workflow
8 2 (0.24%) Anypoint
8 2 (0.24%) Documentum
8 2 (0.24%) FileNet
8 2 (0.24%) GeoServer
8 2 (0.24%) Jupyter
8 2 (0.24%) Tomcat
8 2 (0.24%) WebLogic
Applications
1 29 (3.42%) Microsoft Excel
2 23 (2.71%) Microsoft Office
3 13 (1.53%) Microsoft PowerPoint
4 7 (0.82%) MS Visio
4 7 (0.82%) Trello
5 6 (0.71%) Microsoft Project
6 5 (0.59%) Oracle Smart View
7 3 (0.35%) Sketch
8 2 (0.24%) Adobe Illustrator
8 2 (0.24%) Photoshop
8 2 (0.24%) Spreadsheet
9 1 (0.12%) Adobe After Effects
9 1 (0.12%) Adobe Premiere
9 1 (0.12%) Adobe XD
9 1 (0.12%) Chatbot
9 1 (0.12%) CINEMA 4D
9 1 (0.12%) Final Cut Pro
9 1 (0.12%) InVision
9 1 (0.12%) Windchill
Business Applications
1 13 (1.53%) Dynamics CRM
2 8 (0.94%) Oracle ERP
3 4 (0.47%) Oracle Procure-to-Pay
3 4 (0.47%) SAP ERP
4 3 (0.35%) Oracle Financials
4 3 (0.35%) Oracle Payables
4 3 (0.35%) Oracle Payroll
4 3 (0.35%) Remedy ITSM
5 2 (0.24%) iTrent
5 2 (0.24%) Oracle EBS
5 2 (0.24%) Oracle HRMS
6 1 (0.12%) Loan IQ
6 1 (0.12%) Oracle Assets
6 1 (0.12%) Oracle Internet Expenses
6 1 (0.12%) Oracle Receivables
6 1 (0.12%) SAP CO
6 1 (0.12%) SAP FI
6 1 (0.12%) SAP FI/CO
6 1 (0.12%) SAP S/4HANA
6 1 (0.12%) Workday HCM
Cloud Services
1 189 (22.26%) AWS
2 173 (20.38%) Azure
3 63 (7.42%) Serverless
4 56 (6.60%) Power Platform
5 54 (6.36%) Amazon S3
6 52 (6.12%) Microsoft 365
7 50 (5.89%) AWS Lambda
8 45 (5.30%) Azure DevOps
9 35 (4.12%) GCP
9 35 (4.12%) GitHub
10 34 (4.00%) AWS CloudFormation
11 33 (3.89%) Amazon SQS
12 31 (3.65%) Amazon EKS
13 24 (2.83%) Amazon EC2
13 24 (2.83%) SaaS
14 20 (2.36%) Entra ID
14 20 (2.36%) PowerApps
15 19 (2.24%) Amazon CloudWatch
16 18 (2.12%) Dynamics 365
17 15 (1.77%) GitHub Actions
Communications & Networking
1 22 (2.59%) Firewall
2 15 (1.77%) VPN
3 14 (1.65%) Network Security
4 11 (1.30%) DNS
5 10 (1.18%) WAN
6 9 (1.06%) TCP/IP
7 8 (0.94%) LAN
8 7 (0.82%) BGP
9 6 (0.71%) OSPF
9 6 (0.71%) Wi-Fi
10 5 (0.59%) PSTN
10 5 (0.59%) SD-WAN
10 5 (0.59%) SSL
10 5 (0.59%) VoIP
11 4 (0.47%) Cisco ASA
11 4 (0.47%) HTTP
11 4 (0.47%) Internet
12 3 (0.35%) 4G
12 3 (0.35%) F5 BIG-IP GTM
12 3 (0.35%) F5 BIG-IP LTM
Database & Business Intelligence
1 36 (4.24%) Amazon RDS
2 32 (3.77%) Power BI
3 27 (3.18%) PostgreSQL
4 26 (3.06%) Relational Database
5 22 (2.59%) SQL Server
6 14 (1.65%) Amazon Aurora
6 14 (1.65%) Data Warehouse
6 14 (1.65%) Oracle Database
7 13 (1.53%) MongoDB
7 13 (1.53%) NoSQL
8 11 (1.30%) Big Data
8 11 (1.30%) GIS
9 10 (1.18%) Redis
10 9 (1.06%) Metadata
10 9 (1.06%) MySQL
11 8 (0.94%) DynamoDB
12 7 (0.82%) Tableau
13 6 (0.71%) DocumentDB
13 6 (0.71%) Oracle Reports
14 5 (0.59%) Data Lake
Development Applications
1 58 (6.83%) JIRA
2 55 (6.48%) Git
3 39 (4.59%) Jenkins
4 25 (2.94%) GitLab
5 16 (1.88%) Cypress.io
5 16 (1.88%) SonarQube
6 10 (1.18%) JUnit
7 9 (1.06%) Mockito
8 5 (0.59%) Maven
8 5 (0.59%) Oracle APEX
8 5 (0.59%) Selenium
9 4 (0.47%) Burp Suite
9 4 (0.47%) Cucumber
9 4 (0.47%) Metasploit
9 4 (0.47%) NUnit
9 4 (0.47%) Oracle Forms
9 4 (0.47%) REST Assured
9 4 (0.47%) Terragrunt
10 3 (0.35%) Bitbucket Server
10 3 (0.35%) DbUnit
General
1 252 (29.68%) Social Skills
2 113 (13.31%) Finance
3 93 (10.95%) Analytical Skills
4 49 (5.77%) Telecoms
5 42 (4.95%) Local Government
5 42 (4.95%) Marketing
6 40 (4.71%) Manufacturing
7 38 (4.48%) Electronics
8 33 (3.89%) Military
9 25 (2.94%) Law
10 22 (2.59%) Inclusion and Diversity
11 20 (2.36%) Documentation Skills
11 20 (2.36%) Legal
12 16 (1.88%) Organisational Skills
13 14 (1.65%) Police
14 10 (1.18%) Influencing Skills
14 10 (1.18%) Presentation Skills
15 6 (0.71%) Digital Health
15 6 (0.71%) Digital Healthcare
15 6 (0.71%) Fire and Rescue
Job Titles
1 129 (15.19%) Developer
2 115 (13.55%) Architect
3 82 (9.66%) Lead
4 79 (9.31%) Senior
5 74 (8.72%) Analyst
6 51 (6.01%) Consultant
7 33 (3.89%) Business Analyst
8 28 (3.30%) Designer
8 28 (3.30%) Project Manager
9 24 (2.83%) DevOps Engineer
10 22 (2.59%) Data Engineer
10 22 (2.59%) Technical Architect
11 21 (2.47%) .NET Developer
12 18 (2.12%) AWS Architect
12 18 (2.12%) IT Manager
12 18 (2.12%) Java Developer
12 18 (2.12%) Security Architect
12 18 (2.12%) Solutions Architect
13 15 (1.77%) Azure Engineer
14 14 (1.65%) Service Designer
Libraries, Frameworks & Software Standards
1 48 (5.65%) .NET
2 40 (4.71%) React
3 36 (4.24%) HTML
4 33 (3.89%) RESTful
5 30 (3.53%) REST
6 28 (3.30%) CSS
7 24 (2.83%) Node.js
7 24 (2.83%) OAuth
8 23 (2.71%) SOAP
9 22 (2.59%) AngularJS
9 22 (2.59%) Oracle Fusion
10 21 (2.47%) .NET Core
11 19 (2.24%) Spring Boot
12 18 (2.12%) Kafka
13 16 (1.88%) Spring
14 15 (1.77%) XML
15 13 (1.53%) AWS CDK
15 13 (1.53%) OpenID
16 12 (1.41%) OAuth2
16 12 (1.41%) Web Services
Miscellaneous
1 34 (4.00%) Product Ownership
2 30 (3.53%) Management Information System
3 24 (2.83%) Cloud Native
4 19 (2.24%) Legacy Systems
5 17 (2.00%) NHS
6 13 (1.53%) Onboarding
7 11 (1.30%) Data Centre
7 11 (1.30%) PKI
8 8 (0.94%) Clustering
8 8 (0.94%) Enterprise Software
8 8 (0.94%) Virtual Team
9 7 (0.82%) CMDB
9 7 (0.82%) Distributed Systems
9 7 (0.82%) Freedom of Information
9 7 (0.82%) Low-Code
10 6 (0.71%) CSOC
10 6 (0.71%) Data Structures
10 6 (0.71%) Driving Licence
10 6 (0.71%) Security Operations Centre
11 5 (0.59%) Mobile App
Operating Systems
1 40 (4.71%) Windows
2 33 (3.89%) Linux
3 19 (2.24%) Windows Server
4 10 (1.18%) Windows 10
5 7 (0.82%) Red Hat Enterprise Linux
5 7 (0.82%) Unix
6 6 (0.71%) Apple iOS
7 5 (0.59%) Android
7 5 (0.59%) Mac OS
8 4 (0.47%) Windows Server 2012
9 2 (0.24%) VMS
10 1 (0.12%) AIX
10 1 (0.12%) Debian
10 1 (0.12%) Kali Linux
10 1 (0.12%) Oracle Linux
10 1 (0.12%) Ubuntu
10 1 (0.12%) Windows Server 2016
10 1 (0.12%) zOS
Processes & Methodologies
1 251 (29.56%) Agile
2 145 (17.08%) DevOps
3 127 (14.96%) Problem-Solving
4 114 (13.43%) CI/CD
5 106 (12.49%) Stakeholder Management
6 81 (9.54%) Stakeholder Engagement
7 77 (9.07%) Business Intelligence
8 73 (8.60%) Containerisation
9 70 (8.24%) Mentoring
9 70 (8.24%) Migration
10 66 (7.77%) Infrastructure as Code
11 65 (7.66%) Microservices
11 65 (7.66%) Project Management
12 60 (7.07%) Scrum
13 58 (6.83%) Continuous Improvement
13 58 (6.83%) Roadmaps
14 56 (6.60%) User Experience
15 51 (6.01%) Decision-Making
16 44 (5.18%) Analytics
16 44 (5.18%) Service Design
Programming Languages
1 96 (11.31%) Python
2 92 (10.84%) SQL
3 74 (8.72%) Java
4 72 (8.48%) JavaScript
5 38 (4.48%) C#
6 37 (4.36%) TypeScript
7 35 (4.12%) PowerShell
8 27 (3.18%) Bash
9 12 (1.41%) PL/SQL
10 9 (1.06%) R
10 9 (1.06%) Shell Script
11 7 (0.82%) Apex Code
11 7 (0.82%) Bicep
12 5 (0.59%) C++
13 4 (0.47%) VBA
14 3 (0.35%) ABAP
14 3 (0.35%) C
14 3 (0.35%) Perl
14 3 (0.35%) PHP
14 3 (0.35%) Ruby
Qualifications
1 451 (53.12%) Security Cleared
2 339 (39.93%) SC Cleared
3 62 (7.30%) Degree
4 36 (4.24%) DV Cleared
5 26 (3.06%) BPSS Clearance
6 25 (2.94%) AWS Certification
7 23 (2.71%) AWS Certified Solutions Architect
8 20 (2.36%) Master's Degree
9 19 (2.24%) CISSP
10 17 (2.00%) Computer Science Degree
11 11 (1.30%) Cisco Certification
11 11 (1.30%) Microsoft Certification
12 9 (1.06%) CCNA
12 9 (1.06%) CISM
13 7 (0.82%) Azure Certification
13 7 (0.82%) CESG Certified Professional
13 7 (0.82%) CREST Certified
13 7 (0.82%) ISO 27001 Lead Auditor
13 7 (0.82%) VMware Certified Professional (VCP)
14 6 (0.71%) OSCP
Quality Assurance & Compliance
1 64 (7.54%) Accessibility
2 35 (4.12%) QA
3 22 (2.59%) NCSC
4 21 (2.47%) ISO/IEC 27001
5 18 (2.12%) Data Quality
6 16 (1.88%) GDPR
6 16 (1.88%) WCAG
7 11 (1.30%) PMO
8 9 (1.06%) NIST
9 8 (0.94%) Cyber Essentials
10 6 (0.71%) Cyber Essentials PLUS
11 5 (0.59%) Actionable Recommendations
11 5 (0.59%) RMADS
12 4 (0.47%) SLA
13 3 (0.35%) Disclosure Scotland
13 3 (0.35%) ISO/IEC 20000
13 3 (0.35%) JSP 440
13 3 (0.35%) Sarbanes-Oxley
14 2 (0.24%) ISO/IEC 27002 (supersedes ISO/IEC 17799)
15 1 (0.12%) GRC
System Software
1 83 (9.78%) Docker
2 28 (3.30%) Active Directory
3 11 (1.30%) VMware Infrastructure
4 8 (0.94%) Virtual Machines
4 8 (0.94%) VMware ESXi
5 7 (0.82%) VMware NSX
6 4 (0.47%) Hyper-V
6 4 (0.47%) Virtual Desktop
7 3 (0.35%) Postfix
7 3 (0.35%) Virtual Servers
8 2 (0.24%) Apache ZooKeeper
8 2 (0.24%) Firmware
8 2 (0.24%) vSphere
9 1 (0.12%) KVM
9 1 (0.12%) RACF
9 1 (0.12%) Terminal Services
9 1 (0.12%) VMware Workstation
Systems Management
1 67 (7.89%) Terraform
2 50 (5.89%) Kubernetes
3 32 (3.77%) Ansible
4 20 (2.36%) Grafana
5 16 (1.88%) Prometheus
6 11 (1.30%) Microsoft Intune
7 8 (0.94%) vCenter Server
8 5 (0.59%) Nmap
8 5 (0.59%) SCCM
9 4 (0.47%) Istio
9 4 (0.47%) Progress Chef
9 4 (0.47%) SCOM
10 3 (0.35%) Oracle Enterprise Manager
10 3 (0.35%) Oracle RMAN
10 3 (0.35%) Puppet
10 3 (0.35%) Single Sign-On
11 2 (0.24%) Argo
11 2 (0.24%) Data Guard
11 2 (0.24%) QRadar
11 2 (0.24%) Rsyslog
Vendors
1 144 (16.96%) Microsoft
2 64 (7.54%) Oracle
3 52 (6.12%) SAP
4 22 (2.59%) Cisco
5 19 (2.24%) ServiceNow
6 18 (2.12%) Google
7 17 (2.00%) Salesforce
8 14 (1.65%) VMware
9 11 (1.30%) Atlassian
10 10 (1.18%) CheckPoint
11 9 (1.06%) Palo Alto
12 8 (0.94%) Databricks
12 8 (0.94%) F5
13 7 (0.82%) IBM
13 7 (0.82%) Remedy
13 7 (0.82%) Splunk
14 6 (0.71%) Pega
15 5 (0.59%) Adobe
15 5 (0.59%) OutSystems
15 5 (0.59%) Zscaler