Ruby Jobs in England

Ruby
UK > England

The table below provides summary statistics for permanent job vacancies advertised in England requiring Ruby skills. It includes a benchmarking guide to the annual salaries offered in vacancies that cited Ruby over the 6 months leading up to 26 July 2024, comparing them to the same period in the previous two years.

6 months to
26 Jul 2024
Same period 2023 Same period 2022
Rank 574 285 178
Rank change year-on-year -289 -107 +21
Permanent jobs citing Ruby 233 852 3,426
As % of all permanent jobs advertised in England 0.30% 1.20% 2.33%
As % of the Programming Languages category 1.00% 2.97% 4.54%
Number of salaries quoted 184 457 932
10th Percentile £37,500 £47,040 £42,500
25th Percentile £54,688 £57,500 £56,250
Median annual salary (50th Percentile) £70,000 £70,000 £75,000
Median % change year-on-year - -6.67% +16.50%
75th Percentile £92,500 £87,500 £92,500
90th Percentile £121,375 £102,500 £105,000
UK median annual salary £70,000 £70,000 £75,000
% change year-on-year - -6.67% +19.05%

All Programming Languages
England

Ruby falls under the Programming Languages category. For comparison with the information above, the following table provides summary statistics for all permanent job vacancies requiring coding skills in England.

Permanent vacancies with a requirement for coding skills 23,314 28,657 75,412
As % of all permanent jobs advertised in England 29.75% 40.31% 51.29%
Number of salaries quoted 17,627 21,657 38,997
10th Percentile £36,250 £40,000 £37,500
25th Percentile £45,500 £50,000 £46,250
Median annual salary (50th Percentile) £60,000 £65,000 £62,500
Median % change year-on-year -7.69% +4.00% +8.70%
75th Percentile £82,500 £86,250 £85,000
90th Percentile £102,500 £110,000 £101,250
UK median annual salary £60,000 £65,000 £62,500
% change year-on-year -7.69% +4.00% +8.70%

Ruby
Job Vacancy Trend in England

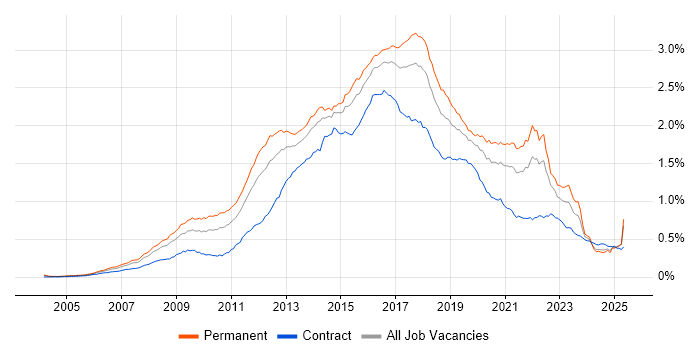
Job postings citing Ruby as a proportion of all IT jobs advertised in England.

Job vacancy trend for Ruby in England

Ruby
Salary Trend in England

3-month moving average salary quoted in jobs citing Ruby in England.

Salary trend for Ruby in England

Ruby
Salary Histogram in England

Salary distribution for jobs citing Ruby in England over the 6 months to 26 July 2024.

Salary histogram for Ruby in England

Ruby
Job Locations in England

The table below looks at the demand and provides a guide to the median salaries quoted in IT jobs citing Ruby within the England region over the 6 months to 26 July 2024. The 'Rank Change' column provides an indication of the change in demand within each location based on the same 6 month period last year.

Location Rank Change
on Same Period
Last Year
Matching
Permanent
IT Job Ads
Median Salary
Past 6 Months
Median Salary
% Change
on Same Period
Last Year
Live
Jobs
London -83 126 £85,000 +13.33% 15
North of England -138 41 £65,000 - 7
North West -91 33 £65,000 +8.33% 4
South West -60 30 £70,000 -4.44% 8
South East -53 25 £55,000 -10.20% 9
Yorkshire -19 6 £45,000 -30.77% 1
Midlands -84 6 £67,500 -3.57% 2
West Midlands -26 5 £67,500 -3.57% 1
East of England -6 3 £45,000 +28.57% 2
North East -18 2 £35,750 -56.00% 2
East Midlands -68 1 £67,500 -14.29% 1
Ruby
UK

Ruby
Co-occurring Skills and Capabilities in England by Category

The follow tables expand on the table above by listing co-occurrences grouped by category. The same employment type, locality and period is covered with up to 20 co-occurrences shown in each of the following categories:

Application Platforms
1 13 (5.58%) Apache
2 12 (5.15%) Apache Airflow
3 11 (4.72%) Confluence
4 10 (4.29%) Microsoft Exchange
5 6 (2.58%) OpenStack
6 2 (0.86%) nginx
7 1 (0.43%) IIS
7 1 (0.43%) SharePoint
Applications
1 4 (1.72%) Microsoft Office
2 2 (0.86%) Microsoft Excel
Business Applications
1 10 (4.29%) Fidessa
1 10 (4.29%) NEC Housing
2 6 (2.58%) Oracle Cash Management
Cloud Services
1 106 (45.49%) AWS
2 43 (18.45%) Azure
3 25 (10.73%) SaaS
4 22 (9.44%) GCP
5 18 (7.73%) Serverless
6 16 (6.87%) Azure DevOps
7 12 (5.15%) dbt
7 12 (5.15%) GitHub
8 9 (3.86%) IaaS
9 6 (2.58%) Power Platform
10 5 (2.15%) Amazon EC2
10 5 (2.15%) Heroku
10 5 (2.15%) Microsoft 365
11 4 (1.72%) AWS Lambda
11 4 (1.72%) PaaS
12 3 (1.29%) Amazon ECS
12 3 (1.29%) GitHub Actions
12 3 (1.29%) Google Kubernetes Engine
12 3 (1.29%) Power Automate
12 3 (1.29%) PowerApps
Communications & Networking
1 14 (6.01%) DNS
1 14 (6.01%) TCP/IP
2 13 (5.58%) Firewall
3 12 (5.15%) Remote Desktop
4 10 (4.29%) DHCP
4 10 (4.29%) FIX Connectivity
5 6 (2.58%) Internet
6 4 (1.72%) HTTP
7 3 (1.29%) MQTT
8 1 (0.43%) 5G
8 1 (0.43%) FTP
8 1 (0.43%) SSH
8 1 (0.43%) SSL
8 1 (0.43%) Wireless
Database & Business Intelligence
1 27 (11.59%) MySQL
1 27 (11.59%) PostgreSQL
2 23 (9.87%) SQL Server
3 18 (7.73%) NoSQL
4 14 (6.01%) Relational Database
5 13 (5.58%) MongoDB
6 12 (5.15%) Amazon Athena
6 12 (5.15%) Apache Arrow
6 12 (5.15%) Apache Ignite
6 12 (5.15%) Dremio
7 10 (4.29%) Oracle Database
8 6 (2.58%) Big Data
8 6 (2.58%) Elasticsearch
9 4 (1.72%) Amazon Aurora
9 4 (1.72%) Amazon RDS
9 4 (1.72%) DynamoDB
9 4 (1.72%) Power BI
9 4 (1.72%) Redis
10 2 (0.86%) Amazon Redshift
11 1 (0.43%) Qlik Sense
Development Applications
1 31 (13.30%) Git
2 29 (12.45%) Jenkins
3 23 (9.87%) JIRA
4 18 (7.73%) GitLab
5 10 (4.29%) Oracle APEX
6 6 (2.58%) Octopus Deploy
7 5 (2.15%) Cucumber
7 5 (2.15%) RSpec
7 5 (2.15%) Selenium
8 4 (1.72%) TeamCity
9 3 (1.29%) Bitbucket
9 3 (1.29%) Subversion
10 1 (0.43%) Appium
10 1 (0.43%) Capybara
10 1 (0.43%) Cypress.io
10 1 (0.43%) Gradle
10 1 (0.43%) JUnit
10 1 (0.43%) Maven
10 1 (0.43%) Metasploit
10 1 (0.43%) Mockito
General
1 51 (21.89%) Finance
2 47 (20.17%) Social Skills
3 34 (14.59%) Banking
4 24 (10.30%) Investment Banking
5 22 (9.44%) Inclusion and Diversity
5 22 (9.44%) Tech for Good
6 21 (9.01%) Analytical Skills
7 17 (7.30%) Legal
7 17 (7.30%) Public Sector
8 15 (6.44%) Local Government
9 12 (5.15%) Front Office
10 10 (4.29%) Health Technology
10 10 (4.29%) Police
11 4 (1.72%) Marketing
12 3 (1.29%) Aerospace
12 3 (1.29%) Games
12 3 (1.29%) Retail
13 1 (0.43%) Automotive
13 1 (0.43%) Billing
13 1 (0.43%) Electronics
Job Titles
1 102 (43.78%) Developer
2 65 (27.90%) Senior
3 34 (14.59%) Senior Developer
3 34 (14.59%) Software Engineer
4 32 (13.73%) Infrastructure Engineer
4 32 (13.73%) Software Developer
5 31 (13.30%) Ruby Developer
6 27 (11.59%) Lead
7 24 (10.30%) Ruby on Rails Developer
8 18 (7.73%) Lead Developer
9 16 (6.87%) Ruby Engineer
10 15 (6.44%) Senior Ruby on Rails Developer
11 14 (6.01%) Developer/Software Engineer
11 14 (6.01%) Senior Software Engineer
12 13 (5.58%) Architect
13 11 (4.72%) Senior Ruby Developer
14 10 (4.29%) Applications Support
14 10 (4.29%) DevOps Engineer
14 10 (4.29%) Full Stack Developer
14 10 (4.29%) Oracle Developer
Libraries, Frameworks & Software Standards
1 80 (34.33%) Ruby on Rails
2 34 (14.59%) HTML
3 29 (12.45%) CSS
4 28 (12.02%) React
5 23 (9.87%) Node.js
6 22 (9.44%) JSON
7 18 (7.73%) RESTful
8 16 (6.87%) XML
9 13 (5.58%) .NET
9 13 (5.58%) jQuery
9 13 (5.58%) Vue
10 12 (5.15%) gRPC
10 12 (5.15%) NumPy
10 12 (5.15%) Pandas
10 12 (5.15%) Protocol Buffers
10 12 (5.15%) REST
10 12 (5.15%) SciPy
10 12 (5.15%) SOAP
11 10 (4.29%) FIX Protocol
11 10 (4.29%) Laravel
Miscellaneous
1 16 (6.87%) NHS
2 15 (6.44%) Cloud Native
3 14 (6.01%) Cyberattack
3 14 (6.01%) Foreign Exchange (FX)
4 13 (5.58%) Hedge funds
5 12 (5.15%) Derivative
5 12 (5.15%) Equities
5 12 (5.15%) Fixed Income
6 10 (4.29%) Algorithms
6 10 (4.29%) Eurex
7 9 (3.86%) Data Structures
8 7 (3.00%) Self-Motivation
9 6 (2.58%) Life Science
9 6 (2.58%) SWIFT Messaging Network
10 5 (2.15%) Educational Technology
10 5 (2.15%) IoT
10 5 (2.15%) Product Ownership
11 4 (1.72%) Housing Association
11 4 (1.72%) Legacy Systems
11 4 (1.72%) Social Media
Operating Systems
1 56 (24.03%) Linux
2 37 (15.88%) Windows
3 19 (8.15%) Unix
4 14 (6.01%) Red Hat Enterprise Linux
5 12 (5.15%) Windows Server
6 10 (4.29%) CentOS
6 10 (4.29%) Ubuntu
7 9 (3.86%) Solaris
8 7 (3.00%) Apple iOS
9 6 (2.58%) Android
10 4 (1.72%) Windows 10
11 3 (1.29%) VMS
12 1 (0.43%) Embedded Linux
12 1 (0.43%) Kali Linux
Processes & Methodologies
1 61 (26.18%) Agile
2 55 (23.61%) Problem-Solving
3 52 (22.32%) Software Engineering
4 50 (21.46%) CI/CD
5 48 (20.60%) DevOps
6 46 (19.74%) Full Stack Development
7 43 (18.45%) Mentoring
8 33 (14.16%) Infrastructure Engineering
9 24 (10.30%) Computer Science
10 22 (9.44%) Infrastructure as Code
11 19 (8.15%) Microservices
12 18 (7.73%) Analytics
12 18 (7.73%) Artificial Intelligence
12 18 (7.73%) Containerisation
12 18 (7.73%) Test Automation
13 17 (7.30%) Customer Service
13 17 (7.30%) Line Management
14 16 (6.87%) Infrastructure Automation
14 16 (6.87%) Open Source
15 15 (6.44%) Task Automation
Programming Languages
1 121 (51.93%) Python
2 94 (40.34%) JavaScript
3 63 (27.04%) PowerShell
4 62 (26.61%) Java
5 53 (22.75%) Bash
6 42 (18.03%) Perl
7 36 (15.45%) SQL
8 29 (12.45%) Go
9 18 (7.73%) C++
9 18 (7.73%) TypeScript
10 16 (6.87%) Scala
11 15 (6.44%) C#
12 14 (6.01%) C
13 12 (5.15%) Korn
14 10 (4.29%) PHP
14 10 (4.29%) PL/SQL
15 3 (1.29%) Tcl
16 2 (0.86%) Lua
16 2 (0.86%) Rust
16 2 (0.86%) T-SQL
Qualifications
1 38 (16.31%) Degree
2 20 (8.58%) Security Cleared
3 19 (8.15%) Computer Science Degree
4 10 (4.29%) DBS Check
5 7 (3.00%) AWS Certification
6 4 (1.72%) BPSS Clearance
7 3 (1.29%) DV Cleared
7 3 (1.29%) SC Cleared
8 2 (0.86%) Master's Degree
8 2 (0.86%) OSCP
9 1 (0.43%) CEH
9 1 (0.43%) CHECK Team Leader
9 1 (0.43%) CHECK Team Member
9 1 (0.43%) CISSP
9 1 (0.43%) CREST Certified
9 1 (0.43%) OSCE
9 1 (0.43%) RHCE
Quality Assurance & Compliance
1 10 (4.29%) Accessibility
2 8 (3.43%) QA
3 2 (0.86%) ISO/IEC 27001
4 1 (0.43%) Actionable Recommendations
4 1 (0.43%) ISO/IEC 15288
4 1 (0.43%) SLA
System Software
1 41 (17.60%) Docker
2 14 (6.01%) VMware Infrastructure
3 12 (5.15%) XenApp
3 12 (5.15%) XenDesktop
4 5 (2.15%) Active Directory
4 5 (2.15%) Virtual Machines
5 2 (0.86%) VMware ESXi
6 1 (0.43%) Firmware
6 1 (0.43%) KVM
6 1 (0.43%) Virtual Desktop
6 1 (0.43%) VirtualBox
6 1 (0.43%) vSphere
6 1 (0.43%) Xen
Systems Management
1 36 (15.45%) Kubernetes
2 26 (11.16%) Terraform
3 24 (10.30%) Puppet
4 19 (8.15%) Ansible
5 12 (5.15%) Red Hat Satellite
6 11 (4.72%) Progress Chef
7 6 (2.58%) SCCM
8 2 (0.86%) Packer
8 2 (0.86%) vRealize
9 1 (0.43%) CFEngine
9 1 (0.43%) Docker Swarm
9 1 (0.43%) Grafana
9 1 (0.43%) HAProxy
9 1 (0.43%) HP Fortify
9 1 (0.43%) Jamf Pro
9 1 (0.43%) Kibana
9 1 (0.43%) logstash
9 1 (0.43%) Microsoft Intune
9 1 (0.43%) Prometheus
9 1 (0.43%) Rancher
Vendors
1 25 (10.73%) Red Hat
2 21 (9.01%) Microsoft
2 21 (9.01%) Oracle
3 16 (6.87%) VMware
4 12 (5.15%) Citrix
4 12 (5.15%) TOWER Software
5 10 (4.29%) Bloomberg
5 10 (4.29%) CQG
5 10 (4.29%) ION Trading
5 10 (4.29%) NEC
5 10 (4.29%) Patsystems
5 10 (4.29%) Reuters
5 10 (4.29%) Trayport
6 8 (3.43%) Facebook
7 6 (2.58%) PeopleSoft
8 4 (1.72%) PagerDuty
9 3 (1.29%) Atlassian
9 3 (1.29%) LogicMonitor
9 3 (1.29%) Splunk
10 2 (0.86%) ServiceNow