R Jobs in England

R
UK > England

The table below provides summary statistics for permanent job vacancies advertised in England requiring R skills. It includes a benchmarking guide to the annual salaries offered in vacancies that cited R over the 6 months leading up to 15 March 2025, comparing them to the same period in the previous two years.

6 months to
15 Mar 2025
Same period 2024 Same period 2023
Rank 349 348 289
Rank change year-on-year -1 -59 -25
Permanent jobs citing R 373 572 1,251
As % of all permanent jobs advertised in England 0.79% 0.75% 1.27%
As % of the Programming Languages category 2.49% 2.19% 2.86%
Number of salaries quoted 191 410 535
10th Percentile £38,000 £38,250 £40,435
25th Percentile £48,125 £47,500 £47,500
Median annual salary (50th Percentile) £62,000 £65,000 £65,000
Median % change year-on-year -4.62% - +8.33%
75th Percentile £75,000 £95,063 £81,875
90th Percentile £100,000 £130,500 £112,500
UK median annual salary £62,000 £63,000 £62,500
% change year-on-year -1.59% +0.80% +5.04%

All Programming Languages
England

R falls under the Programming Languages category. For comparison with the information above, the following table provides summary statistics for all permanent job vacancies requiring coding skills in England.

Permanent vacancies with a requirement for coding skills 15,009 26,137 43,809
As % of all permanent jobs advertised in England 31.64% 34.27% 44.30%
Number of salaries quoted 10,338 21,759 27,836
10th Percentile £37,574 £36,250 £39,000
25th Percentile £47,603 £45,000 £49,756
Median annual salary (50th Percentile) £62,500 £60,000 £65,000
Median % change year-on-year +4.17% -7.69% +4.00%
75th Percentile £85,000 £80,000 £87,500
90th Percentile £110,000 £100,000 £106,250
UK median annual salary £61,000 £60,000 £65,000
% change year-on-year +1.67% -7.69% +8.33%

R
Job Vacancy Trend in England

Job postings citing R as a proportion of all IT jobs advertised in England.
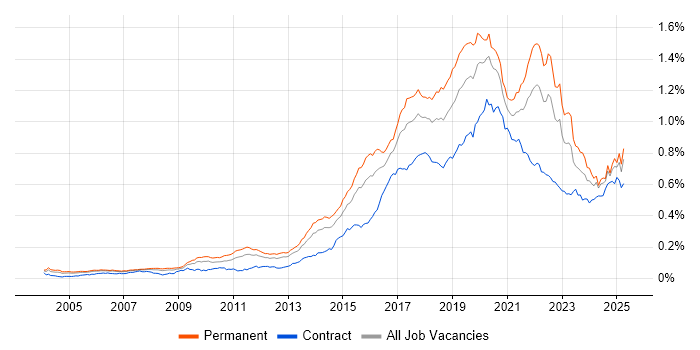
Job vacancy trend for R in England

R
Salary Trend in England

3-month moving average salary quoted in jobs citing R in England.

Salary trend for R in England

R
Salary Histogram in England

Salary distribution for jobs citing R in England over the 6 months to 15 March 2025.

Salary histogram for R in England

R
Job Locations in England

The table below looks at the demand and provides a guide to the median salaries quoted in IT jobs citing R within the England region over the 6 months to 15 March 2025. The 'Rank Change' column provides an indication of the change in demand within each location based on the same 6 month period last year.

Location Rank Change
on Same Period
Last Year
Matching
Permanent
IT Job Ads
Median Salary
Past 6 Months
Median Salary
% Change
on Same Period
Last Year
Live
Jobs
London -43 154 £70,000 -15.15% 510
South East +116 107 £62,000 +24.00% 80
North of England +47 45 £58,750 +14.02% 54
Midlands +41 40 £50,000 +7.53% 46
Yorkshire +74 28 £62,500 +21.29% 20
West Midlands +2 27 £45,000 -15.49% 33
South West +44 16 £65,000 -3.70% 37
East Midlands +39 13 £77,500 +72.22% 13
North West +3 13 £55,000 +12.24% 26
East of England +18 7 £100,000 +73.91% 38
North East +35 4 £44,933 -18.30% 8
R
UK

R
Co-occurring Skills and Capabilities in England by Category

The follow tables expand on the table above by listing co-occurrences grouped by category. The same employment type, locality and period is covered with up to 20 co-occurrences shown in each of the following categories:

Application Platforms
1 57 (15.28%) SAS
2 32 (8.58%) Confluence
3 7 (1.88%) Apache Spark
4 4 (1.07%) Apache
5 3 (0.80%) SharePoint
6 2 (0.54%) Apache Airflow
7 1 (0.27%) ArcGIS
7 1 (0.27%) Jupyter
Applications
1 39 (10.46%) Microsoft Excel
2 7 (1.88%) SPSS
2 7 (1.88%) Weka
3 6 (1.61%) Stata
4 5 (1.34%) Microsoft Office
4 5 (1.34%) Microsoft PowerPoint
4 5 (1.34%) Spreadsheet
5 1 (0.27%) Chatbot
5 1 (0.27%) Simulink
Business Applications
1 3 (0.80%) Dynamics CRM
1 3 (0.80%) GoldMine
2 2 (0.54%) SAP CO
2 2 (0.54%) SAP FI
2 2 (0.54%) SAP FI/CO
Cloud Services
1 95 (25.47%) Power Platform
2 72 (19.30%) Azure
3 51 (13.67%) AWS
4 23 (6.17%) GCP
5 18 (4.83%) Azure Synapse Analytics
6 14 (3.75%) Amazon S3
7 13 (3.49%) Amazon EC2
8 12 (3.22%) IBM Watson
8 12 (3.22%) Serverless
9 9 (2.41%) Typeform
10 7 (1.88%) Snowflake
11 6 (1.61%) Azure Data Factory
12 5 (1.34%) Azure DevOps
12 5 (1.34%) Cloud Computing
13 4 (1.07%) Power Automate
14 3 (0.80%) Amazon SageMaker
14 3 (0.80%) Azure Machine Learning
14 3 (0.80%) Dynamics 365
14 3 (0.80%) PowerApps
14 3 (0.80%) SaaS
Communications & Networking
1 32 (8.58%) Broadband
1 32 (8.58%) Wireshark
2 10 (2.68%) HTTP
3 8 (2.14%) Link 16
3 8 (2.14%) Tactical Data Link
3 8 (2.14%) VLAN
4 6 (1.61%) Internet
4 6 (1.61%) RS-232
4 6 (1.61%) RS-485
4 6 (1.61%) TCP/IP
5 3 (0.80%) DAB
6 2 (0.54%) ADSL
6 2 (0.54%) IPv4
7 1 (0.27%) Asterisk PBX
7 1 (0.27%) BGP
7 1 (0.27%) DMVPN
7 1 (0.27%) Firewall
7 1 (0.27%) NAS
7 1 (0.27%) OSPF
7 1 (0.27%) Wireless
Database & Business Intelligence
1 94 (25.20%) Power BI
2 93 (24.93%) Tableau
3 39 (10.46%) Data Warehouse
4 31 (8.31%) Amazon QuickSight
4 31 (8.31%) Data Mining
5 27 (7.24%) NoSQL
6 25 (6.70%) Relational Database
7 20 (5.36%) SQL Server
8 16 (4.29%) Amazon Redshift
9 13 (3.49%) DynamoDB
10 12 (3.22%) QlikView
11 10 (2.68%) MySQL
12 9 (2.41%) Data Lake
12 9 (2.41%) Hadoop
13 8 (2.14%) BigQuery
14 6 (1.61%) Power Query
15 5 (1.34%) Big Data
15 5 (1.34%) SQL Server Integration Services
16 4 (1.07%) Apache Hive
16 4 (1.07%) BusinessObjects
Development Applications
1 47 (12.60%) Rational DOORS
2 32 (8.58%) Fiddler
3 7 (1.88%) Git
4 3 (0.80%) MLflow
5 2 (0.54%) Visual Studio Code
6 1 (0.27%) RStudio
General
1 146 (39.14%) Analytical Skills
2 121 (32.44%) Social Skills
3 73 (19.57%) Marketing
4 69 (18.50%) Finance
5 59 (15.82%) Electronics
6 42 (11.26%) Advertising
7 37 (9.92%) Telecoms
8 29 (7.77%) Manufacturing
9 22 (5.90%) Retail
10 20 (5.36%) Pharmaceutical
11 18 (4.83%) Banking
12 17 (4.56%) Inclusion and Diversity
13 16 (4.29%) Law
14 15 (4.02%) Presentation Skills
14 15 (4.02%) Public Sector
15 14 (3.75%) Military
16 9 (2.41%) Organisational Skills
17 7 (1.88%) Legal
18 6 (1.61%) Influencing Skills
19 5 (1.34%) Aerospace
Job Titles
1 110 (29.49%) Senior
2 71 (19.03%) Analyst
3 57 (15.28%) Systems Engineer
4 51 (13.67%) Data Scientist
5 47 (12.60%) Senior Systems Engineer
6 32 (8.58%) Service Delivery Executive
7 28 (7.51%) Senior Analyst
8 27 (7.24%) Lead
9 25 (6.70%) Data Analyst
10 20 (5.36%) Data Engineer
11 19 (5.09%) Data Manager
12 18 (4.83%) Analytics Manager
13 13 (3.49%) Risk Manager
13 13 (3.49%) Senior Data Scientist
14 12 (3.22%) Audit Manager
14 12 (3.22%) Automation Engineer
14 12 (3.22%) Data Analytics Manager
14 12 (3.22%) Programmer
14 12 (3.22%) Technology Risk Manager
15 11 (2.95%) Business Intelligence Analyst
Libraries, Frameworks & Software Standards
1 38 (10.19%) XML
2 33 (8.85%) CSS
2 33 (8.85%) HTML
3 32 (8.58%) CSS3
4 18 (4.83%) JSON
5 12 (3.22%) TensorFlow
6 11 (2.95%) scikit-learn
7 10 (2.68%) PyTorch
8 7 (1.88%) Pandas
9 6 (1.61%) NumPy
10 5 (1.34%) .NET
10 5 (1.34%) Shiny
11 3 (0.80%) Kafka
11 3 (0.80%) Keras
11 3 (0.80%) PySpark
11 3 (0.80%) SciPy
11 3 (0.80%) Web Services
12 2 (0.54%) Flask
12 2 (0.54%) Node.js
12 2 (0.54%) React
Miscellaneous
1 70 (18.77%) Algorithms
2 32 (8.58%) Mobile App
2 32 (8.58%) Social Media
3 22 (5.90%) Robotics
4 21 (5.63%) Product Ownership
5 20 (5.36%) Credit Risk
5 20 (5.36%) Management Information System
6 12 (3.22%) Blockchain
7 10 (2.68%) SCADA
8 9 (2.41%) Data Structures
9 8 (2.14%) Life Science
9 8 (2.14%) Market Risk
10 7 (1.88%) Analytical Mindset
10 7 (1.88%) Distributed Systems
11 4 (1.07%) Biopharmaceutical
11 4 (1.07%) Multi-touch
11 4 (1.07%) Self-Motivation
12 3 (0.80%) Hybrid Cloud
12 3 (0.80%) Onboarding
13 2 (0.54%) Public Cloud
Operating Systems
1 17 (4.56%) Linux
2 8 (2.14%) Windows
3 3 (0.80%) Red Hat Enterprise Linux
3 3 (0.80%) Windows Server
4 2 (0.54%) Unix
4 2 (0.54%) VMS
5 1 (0.27%) Windows 7
5 1 (0.27%) Windows Server 2008
Processes & Methodologies
1 153 (41.02%) Analytics
2 109 (29.22%) Data Science
3 107 (28.69%) Visualisation
4 105 (28.15%) Machine Learning
5 102 (27.35%) Business Intelligence
6 92 (24.66%) Mentoring
7 80 (21.45%) Data Visualisation
8 78 (20.91%) Statistics
9 76 (20.38%) Problem-Solving
10 70 (18.77%) Data Analysis
11 68 (18.23%) Actionable Insight
12 67 (17.96%) Computer Science
12 67 (17.96%) Mathematics
13 62 (16.62%) Artificial Intelligence
14 61 (16.35%) Decision-Making
14 61 (16.35%) ETL
14 61 (16.35%) Stakeholder Engagement
15 50 (13.40%) Data Modelling
16 49 (13.14%) Stakeholder Management
16 49 (13.14%) Technical Leadership
Programming Languages
1 249 (66.76%) Python
2 197 (52.82%) SQL
3 42 (11.26%) MATLAB
4 35 (9.38%) JavaScript
5 23 (6.17%) C++
5 23 (6.17%) Java
6 18 (4.83%) C
7 15 (4.02%) Data Analysis Expressions
8 14 (3.75%) T-SQL
9 9 (2.41%) PL/SQL
10 7 (1.88%) C#
11 6 (1.61%) Perl
12 5 (1.34%) Bash
12 5 (1.34%) PowerShell
12 5 (1.34%) VBA
13 3 (0.80%) PHP
13 3 (0.80%) Scala
14 2 (0.54%) Embedded C
14 2 (0.54%) Rust
14 2 (0.54%) VB
Qualifications
1 106 (28.42%) Degree
2 47 (12.60%) BPSS Clearance
3 29 (7.77%) Computer Science Degree
4 27 (7.24%) DBS Check
4 27 (7.24%) Master's Degree
5 22 (5.90%) Security Cleared
6 15 (4.02%) Numerate Degree
7 11 (2.95%) SC Cleared
8 9 (2.41%) CompTIA Security+
9 8 (2.14%) PhD
10 7 (1.88%) CCNA
10 7 (1.88%) CCNP
10 7 (1.88%) Cisco Certification
11 6 (1.61%) CISM
11 6 (1.61%) CISSP
11 6 (1.61%) CRISC
11 6 (1.61%) GSEC
11 6 (1.61%) SSCP
12 4 (1.07%) MBA
13 3 (0.80%) Azure Certification
Quality Assurance & Compliance
1 47 (12.60%) ISO/IEC 15288
2 23 (6.17%) Data Quality
3 10 (2.68%) GDPR
3 10 (2.68%) IFRS
3 10 (2.68%) IFRS 9
3 10 (2.68%) SLA
4 8 (2.14%) CDISC
4 8 (2.14%) PCI DSS
5 7 (1.88%) Basel II
5 7 (1.88%) Basel III
5 7 (1.88%) Dodd-Frank
5 7 (1.88%) ISO/IEC 27001
6 6 (1.61%) MIL-STD-1553
6 6 (1.61%) SOC 2
7 4 (1.07%) QA
8 2 (0.54%) Actionable Recommendations
9 1 (0.27%) Accessibility
9 1 (0.27%) ISO 9001
9 1 (0.27%) PERC
9 1 (0.27%) SEPA
System Software
1 4 (1.07%) Docker
2 2 (0.54%) Firmware
3 1 (0.27%) HDFS
3 1 (0.27%) Virtual Machines
3 1 (0.27%) VMware Infrastructure
Systems Management
1 2 (0.54%) Ansible
1 2 (0.54%) Kibana
1 2 (0.54%) Kubeflow
1 2 (0.54%) Kubernetes
1 2 (0.54%) Puppet
Vendors
1 59 (15.82%) IBM
2 53 (14.21%) Microsoft
3 40 (10.72%) Google
4 31 (8.31%) Databricks
5 23 (6.17%) Oracle
6 12 (3.22%) SAP
7 8 (2.14%) Salesforce
8 5 (1.34%) Intel
9 4 (1.07%) Vertica
10 3 (0.80%) Adobe
10 3 (0.80%) Red Hat
11 2 (0.54%) Apple
11 2 (0.54%) Atlassian
11 2 (0.54%) BMC
12 1 (0.27%) Apteco
12 1 (0.27%) CA Agile Central
12 1 (0.27%) eFront
12 1 (0.27%) OpenAI
12 1 (0.27%) Palantir
12 1 (0.27%) TikTok