Electronics Jobs in London

Electronics
England > London

The table below looks at the prevalence of the term Electronics in permanent job vacancies in London. Included is a benchmarking guide to the salaries offered in vacancies that cited Electronics over the 6 months leading up to 26 July 2024, comparing them to the same period in the previous two years.

6 months to
26 Jul 2024
Same period 2023 Same period 2022
Rank 399 378 522
Rank change year-on-year -21 +144 -144
Permanent jobs citing Electronics 78 186 462
As % of all permanent jobs advertised in London 0.38% 0.69% 0.62%
As % of the General category 0.55% 1.01% 0.87%
Number of salaries quoted 62 164 234
10th Percentile £43,529 £33,000 £37,950
25th Percentile £51,196 £46,570 £49,063
Median annual salary (50th Percentile) £60,000 £48,687 £65,000
Median % change year-on-year +23.24% -25.10% -18.75%
75th Percentile £76,875 £67,500 £90,000
90th Percentile £85,000 £93,375 £102,500
England median annual salary £52,500 £50,000 £52,500
% change year-on-year +5.00% -4.76% -8.70%

All General Skills
London

Electronics falls under the General Skills category. For comparison with the information above, the following table provides summary statistics for all permanent job vacancies requiring common skills in London.

Permanent vacancies with a requirement for common skills 14,244 18,353 53,034
As % of all permanent jobs advertised in London 68.68% 67.67% 70.70%
Number of salaries quoted 9,429 13,938 24,332
10th Percentile £37,000 £41,250 £41,250
25th Percentile £51,250 £53,750 £52,500
Median annual salary (50th Percentile) £72,500 £73,993 £70,000
Median % change year-on-year -2.02% +5.70% -
75th Percentile £95,000 £95,000 £92,500
90th Percentile £122,500 £120,000 £112,500
England median annual salary £55,000 £60,000 £60,000
% change year-on-year -8.33% - +4.35%

Electronics
Job Vacancy Trend in London

Job postings citing Electronics as a proportion of all IT jobs advertised in London.
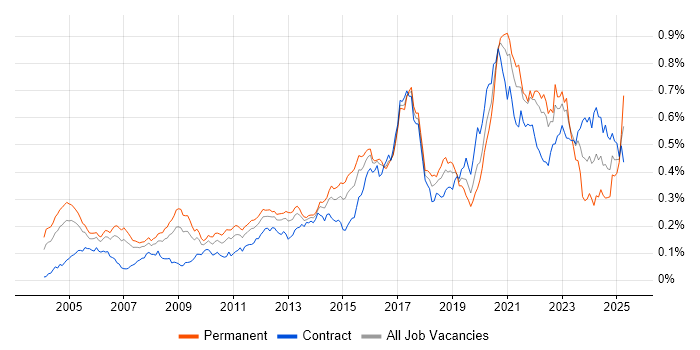
Job vacancy trend for Electronics in London

Electronics
Salary Trend in London

3-month moving average salary quoted in jobs citing Electronics in London.

Salary trend for Electronics in London

Electronics
Salary Histogram in London

Salary distribution for jobs citing Electronics in London over the 6 months to 26 July 2024.

Salary histogram for Electronics in London

Electronics
Job Locations in London

The table below looks at the demand and provides a guide to the median salaries quoted in IT jobs citing Electronics within the London region over the 6 months to 26 July 2024. The 'Rank Change' column provides an indication of the change in demand within each location based on the same 6 month period last year.

Location Rank Change
on Same Period
Last Year
Matching
Permanent
IT Job Ads
Median Salary
Past 6 Months
Median Salary
% Change
on Same Period
Last Year
Live
Jobs
West London -40 6 £50,000 +2.70% 19
South London -19 5 £55,000 +12.97% 7
North London - 4 £65,000 - 5
Central London +27 3 £60,000 -31.43% 10
East London - 1 £55,000 - 3
Electronics
England

Electronics
Co-occurring Skills and Capabilities in London by Category

The follow tables expand on the table above by listing co-occurrences grouped by category. The same employment type, locality and period is covered with up to 20 co-occurrences shown in each of the following categories:

Application Platforms
1 12 (15.38%) Apache
2 11 (14.10%) Apache Spark
3 10 (12.82%) Apache Airflow
4 6 (7.69%) SharePoint
5 3 (3.85%) CMS
5 3 (3.85%) IIS
6 2 (2.56%) Microsoft Exchange
Applications
1 4 (5.13%) Microsoft Excel
1 4 (5.13%) Microsoft Office
2 1 (1.28%) AutoCAD
2 1 (1.28%) Blender
2 1 (1.28%) Houdini
Business Applications
1 9 (11.54%) Adobe Campaign
2 2 (2.56%) Dynamics CRM
3 1 (1.28%) LabWindows
Cloud Services
1 17 (21.79%) AWS
1 17 (21.79%) Azure
2 13 (16.67%) GCP
3 6 (7.69%) Power Platform
4 5 (6.41%) Microsoft 365
5 2 (2.56%) Azure DevOps
5 2 (2.56%) Azure Machine Learning
5 2 (2.56%) Dynamics 365
5 2 (2.56%) PaaS
5 2 (2.56%) Power Automate
6 1 (1.28%) Amazon SQS
6 1 (1.28%) IaaS
6 1 (1.28%) SaaS
Communications & Networking
1 2 (2.56%) Bluetooth
1 2 (2.56%) Multicast
2 1 (1.28%) Broadband
2 1 (1.28%) DAB
2 1 (1.28%) DVB
2 1 (1.28%) Ethernet
2 1 (1.28%) Firewall
2 1 (1.28%) IPv4
2 1 (1.28%) IPv6
2 1 (1.28%) Network Security
2 1 (1.28%) RS-232
2 1 (1.28%) Software-Defined Networking
2 1 (1.28%) Structured Cabling
2 1 (1.28%) Unified Communications
2 1 (1.28%) VPN
2 1 (1.28%) Wireless
Database & Business Intelligence
1 10 (12.82%) Apache Hive
1 10 (12.82%) Presto
2 6 (7.69%) Power BI
3 5 (6.41%) SQL Server
4 4 (5.13%) MySQL
5 1 (1.28%) Big Data
5 1 (1.28%) Firebird
5 1 (1.28%) Hadoop
5 1 (1.28%) NoSQL
Development Applications
1 4 (5.13%) Git
2 2 (2.56%) JIRA
3 1 (1.28%) LabVIEW
3 1 (1.28%) PHPUnit
3 1 (1.28%) Robot Framework
3 1 (1.28%) TensorBoard
General
1 27 (34.62%) Marketing
2 25 (32.05%) Finance
2 25 (32.05%) Telecoms
3 22 (28.21%) Social Skills
4 18 (23.08%) Manufacturing
5 15 (19.23%) Public Sector
6 10 (12.82%) Retail
7 9 (11.54%) Publishing
8 7 (8.97%) Police
9 4 (5.13%) Analytical Skills
10 2 (2.56%) French Language
10 2 (2.56%) Games
10 2 (2.56%) Health Technology
10 2 (2.56%) Music Industry
10 2 (2.56%) Presentation Skills
10 2 (2.56%) Spanish Language
10 2 (2.56%) Wearables
11 1 (1.28%) Aerospace
11 1 (1.28%) Automotive
11 1 (1.28%) Legal
Job Titles
1 21 (26.92%) Software Engineer
2 14 (17.95%) Senior
3 10 (12.82%) Consultant
3 10 (12.82%) Scala Engineer
3 10 (12.82%) Scala Software Engineer
4 8 (10.26%) Developer
5 6 (7.69%) Infrastructure Engineer
5 6 (7.69%) Senior Software Engineer
6 5 (6.41%) Embedded Engineer
6 5 (6.41%) Embedded Software Engineer
6 5 (6.41%) Full Stack Developer
6 5 (6.41%) IT Manager
6 5 (6.41%) Operations Manager
6 5 (6.41%) Senior Consultant
7 4 (5.13%) Analyst
7 4 (5.13%) Architect
7 4 (5.13%) Infrastructure Operations Engineer
7 4 (5.13%) IT Support
7 4 (5.13%) Support Manager
7 4 (5.13%) Technical Consultant
Libraries, Frameworks & Software Standards
1 10 (12.82%) HTML
1 10 (12.82%) http4s
1 10 (12.82%) Lambda Expressions
2 9 (11.54%) Web Services
2 9 (11.54%) XML
3 4 (5.13%) .NET
4 3 (3.85%) Alpine.js
4 3 (3.85%) Laravel
4 3 (3.85%) RESTful
4 3 (3.85%) Tailwind CSS
5 2 (2.56%) COM
5 2 (2.56%) HTML5 Canvas
5 2 (2.56%) React
5 2 (2.56%) React Native
6 1 (1.28%) .NET Core
6 1 (1.28%) CSS
6 1 (1.28%) OpenGL ES
6 1 (1.28%) TensorFlow
6 1 (1.28%) Unreal Engine
6 1 (1.28%) Vulkan
Miscellaneous
1 15 (19.23%) Management Information System
2 7 (8.97%) IoT
3 5 (6.41%) CCTV
4 3 (3.85%) ARM Cortex
4 3 (3.85%) Video\Live Streaming
5 2 (2.56%) Analytical Mindset
5 2 (2.56%) Embedded Systems
6 1 (1.28%) 3D Graphics
6 1 (1.28%) Algorithms
6 1 (1.28%) Analogue Electronics
6 1 (1.28%) Animation
6 1 (1.28%) Data Centre
6 1 (1.28%) Fat Client
6 1 (1.28%) FPGA
6 1 (1.28%) Legacy Systems
6 1 (1.28%) MPEG
6 1 (1.28%) Photography
6 1 (1.28%) Product Ownership
6 1 (1.28%) Thin Client
Operating Systems
1 10 (12.82%) Windows
2 8 (10.26%) Linux
3 4 (5.13%) Android
4 1 (1.28%) Alpine Linux
4 1 (1.28%) Apple iOS
4 1 (1.28%) Embedded Linux
4 1 (1.28%) FreeRTOS
4 1 (1.28%) Ubuntu
4 1 (1.28%) VMS
4 1 (1.28%) Windows 10
4 1 (1.28%) Windows Server
Processes & Methodologies
1 31 (39.74%) Software Engineering
2 21 (26.92%) Computer Science
3 19 (24.36%) Business Intelligence
4 18 (23.08%) Agile
5 17 (21.79%) CI/CD
6 15 (19.23%) Digital Marketing
6 15 (19.23%) Programme Management
7 14 (17.95%) Machine Learning
8 13 (16.67%) OOP
8 13 (16.67%) Scrum
9 12 (15.38%) OO
9 12 (15.38%) Sprint Planning
10 11 (14.10%) CRM
10 11 (14.10%) Identity Access Management
10 11 (14.10%) Infrastructure as Code
10 11 (14.10%) Kanban
10 11 (14.10%) Project Delivery
10 11 (14.10%) Scrum-ban
11 10 (12.82%) Continuous Integration
11 10 (12.82%) Functional Programming
Programming Languages
1 23 (29.49%) Python
2 17 (21.79%) Java
2 17 (21.79%) JavaScript
3 12 (15.38%) C++
3 12 (15.38%) Scala
4 11 (14.10%) Kotlin
5 10 (12.82%) SQL
6 8 (10.26%) C#
7 7 (8.97%) C
8 4 (5.13%) T-SQL
9 3 (3.85%) PHP
10 1 (1.28%) Ruby
Qualifications
1 40 (51.28%) Degree
2 17 (21.79%) Computer Science Degree
3 7 (8.97%) Microsoft Certification
3 7 (8.97%) Security Cleared
4 6 (7.69%) DV Cleared
5 5 (6.41%) HNC
5 5 (6.41%) HND
5 5 (6.41%) MCSE
5 5 (6.41%) SC Cleared
6 4 (5.13%) MCP
7 3 (3.85%) CISSP
7 3 (3.85%) Master's Degree
7 3 (3.85%) Postgraduate
8 1 (1.28%) BICSI Certification
8 1 (1.28%) BICSI RCDD
8 1 (1.28%) CCIE
8 1 (1.28%) Cisco Certification
8 1 (1.28%) PhD
8 1 (1.28%) RHCE
8 1 (1.28%) RIBA
Quality Assurance & Compliance
1 17 (21.79%) QA
2 3 (3.85%) GDPR
3 2 (2.56%) HIPAA
3 2 (2.56%) IEC 62304
3 2 (2.56%) ISO 13485
4 1 (1.28%) Data Quality
4 1 (1.28%) JTAG
System Software
1 12 (15.38%) Firmware
2 11 (14.10%) Virtual Machines
3 6 (7.69%) Embedded Firmware
4 3 (3.85%) Docker
5 1 (1.28%) VMware Infrastructure
5 1 (1.28%) vSphere
Systems Management
1 11 (14.10%) Terraform
2 2 (2.56%) Active Directory Federation Services
3 1 (1.28%) Kubernetes
3 1 (1.28%) SCCM
3 1 (1.28%) vRealize
Vendors
1 20 (25.64%) Microsoft
2 15 (19.23%) SAP
3 10 (12.82%) Databricks
3 10 (12.82%) Google
4 9 (11.54%) Adobe
5 1 (1.28%) Cadence
5 1 (1.28%) F5
5 1 (1.28%) Fortinet
5 1 (1.28%) Sony
5 1 (1.28%) TOWER Software
5 1 (1.28%) Veeam
5 1 (1.28%) VMware
5 1 (1.28%) Zend