Subversion Jobs in the UK excluding London

Apache Subversion (SVN)
UK > UK excluding London

The table below provides summary statistics for permanent job vacancies advertised in the UK excluding London requiring Subversion skills. It includes a benchmarking guide to the annual salaries offered in vacancies that cited Subversion over the 6 months leading up to 27 July 2024, comparing them to the same period in the previous two years.

6 months to
27 Jul 2024
Same period 2023 Same period 2022
Rank 587 530 426
Rank change year-on-year -57 -104 -80
Permanent jobs citing Subversion 115 139 548
As % of all permanent jobs advertised in the UK excluding London 0.18% 0.29% 0.70%
As % of the Development Applications category 2.17% 2.23% 3.77%
Number of salaries quoted 72 74 262
10th Percentile £37,500 £38,125 £35,000
25th Percentile £42,500 £50,000 £41,063
Median annual salary (50th Percentile) £60,000 £60,000 £50,845
Median % change year-on-year - +18.01% +1.69%
75th Percentile £70,000 £75,000 £65,000
90th Percentile £82,500 £85,125 £72,500
UK median annual salary £62,500 £60,000 £60,000
% change year-on-year +4.17% - +14.29%

All Development Application Skills
UK excluding London

Subversion falls under the Development Applications category. For comparison with the information above, the following table provides summary statistics for all permanent job vacancies requiring development application skills in the UK excluding London.

Permanent vacancies with a requirement for development application skills 5,307 6,242 14,525
As % of all permanent jobs advertised in the UK excluding London 8.13% 13.04% 18.58%
Number of salaries quoted 3,453 3,951 7,685
10th Percentile £35,000 £37,250 £35,000
25th Percentile £42,500 £46,250 £42,500
Median annual salary (50th Percentile) £55,000 £57,500 £55,000
Median % change year-on-year -4.35% +4.55% +10.00%
75th Percentile £69,500 £72,500 £68,750
90th Percentile £82,500 £85,000 £81,250
UK median annual salary £58,600 £65,000 £62,500
% change year-on-year -9.85% +4.00% +8.70%

Subversion
Job Vacancy Trend in the UK excluding London

Job postings citing Subversion as a proportion of all IT jobs advertised in the UK excluding London.
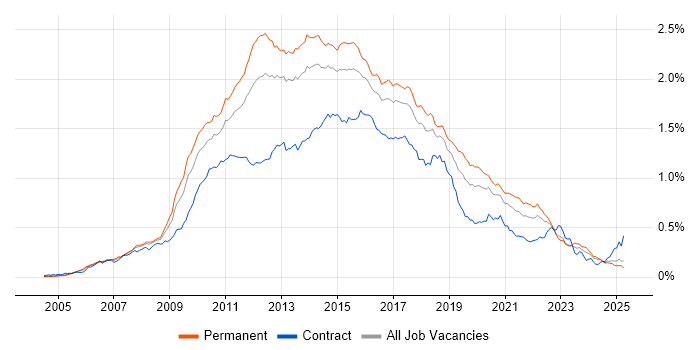
Job vacancy trend for Subversion in the UK excluding London

Subversion
Salary Trend in the UK excluding London

3-month moving average salary quoted in jobs citing Subversion in the UK excluding London.

Salary trend for Subversion in the UK excluding London

Subversion
Salary Histogram in the UK excluding London

Salary distribution for jobs citing Subversion in the UK excluding London over the 6 months to 27 July 2024.

Salary histogram for Subversion in the UK excluding London

Subversion
Job Locations in the UK excluding London

The table below looks at the demand and provides a guide to the median salaries quoted in IT jobs citing Subversion within the UK excluding London region over the 6 months to 27 July 2024. The 'Rank Change' column provides an indication of the change in demand within each location based on the same 6 month period last year.

Location Rank Change
on Same Period
Last Year
Matching
Permanent
IT Job Ads
Median Salary
Past 6 Months
Median Salary
% Change
on Same Period
Last Year
Live
Jobs
South East +3 56 £61,250 -12.50% 8
South West -7 27 £70,000 +40.00% 6
North of England +18 21 £45,000 -14.29% 3
North West +3 15 £40,500 -22.86% 1
Yorkshire +56 6 £45,000 +28.57% 1
Midlands -20 6 £67,500 +21.08% 5
West Midlands -7 5 £67,500 +18.77% 2
Wales +25 2 £45,000 -30.77%
East of England -13 2 £46,250 -38.33%
East Midlands -35 1 - - 3
Scotland -41 1 £47,500 -26.92%
Subversion
UK

Subversion
Co-occurring Skills and Capabilities in the UK excluding London by Category

The follow tables expand on the table above by listing co-occurrences grouped by category. The same employment type, locality and period is covered with up to 20 co-occurrences shown in each of the following categories:

Application Platforms
1 4 (3.48%) Confluence
2 3 (2.61%) Apache
2 3 (2.61%) nginx
3 1 (0.87%) Apache Spark
Applications
1 6 (5.22%) Simulink
2 5 (4.35%) Microsoft Office
3 4 (3.48%) OrCAD
4 3 (2.61%) Microsoft Excel
4 3 (2.61%) Microsoft PowerPoint
Cloud Services
1 20 (17.39%) Azure
2 16 (13.91%) Power Platform
3 7 (6.09%) AWS
4 6 (5.22%) GitHub
5 4 (3.48%) Azure DevOps
6 3 (2.61%) Amazon EC2
6 3 (2.61%) Amazon ECR
6 3 (2.61%) Amazon ECS
6 3 (2.61%) Amazon ELB
6 3 (2.61%) AWS Lambda
6 3 (2.61%) Serverless
7 2 (1.74%) Azure Data Factory
7 2 (1.74%) Boomi
8 1 (0.87%) NuGet
8 1 (0.87%) Pulumi
8 1 (0.87%) SaaS
Communications & Networking
1 11 (9.57%) RS-232
2 7 (6.09%) Ethernet
2 7 (6.09%) TCP/IP
3 6 (5.22%) Wireless
4 4 (3.48%) 3G
4 4 (3.48%) 4G
4 4 (3.48%) GPRS
4 4 (3.48%) HTTP
4 4 (3.48%) Modbus
4 4 (3.48%) RS-485
4 4 (3.48%) Wi-Fi
5 3 (2.61%) Bluetooth
5 3 (2.61%) MQTT
5 3 (2.61%) RS-422
6 2 (1.74%) Firewall
6 2 (1.74%) SNMP
6 2 (1.74%) ZigBee
7 1 (0.87%) LTE
7 1 (0.87%) Network Security
7 1 (0.87%) Unified Communications
Database & Business Intelligence
1 16 (13.91%) Power BI
2 15 (13.04%) Data Warehouse
3 14 (12.17%) MySQL
3 14 (12.17%) Qlik Sense
3 14 (12.17%) Tableau
4 10 (8.70%) PostgreSQL
5 7 (6.09%) SQL Server
6 4 (3.48%) SQLite
7 3 (2.61%) Amazon Aurora
7 3 (2.61%) Amazon RDS
7 3 (2.61%) DynamoDB
7 3 (2.61%) MongoDB
7 3 (2.61%) SQL Server Integration Services
8 2 (1.74%) Big Data
8 2 (1.74%) Relational Database
9 1 (0.87%) Azure SQL Database
9 1 (0.87%) Data Lake
9 1 (0.87%) Hadoop
9 1 (0.87%) Lumira
9 1 (0.87%) SQL Server Analysis Services
Development Applications
1 95 (82.61%) Git
2 16 (13.91%) Visual Studio
3 13 (11.30%) JIRA
4 8 (6.96%) CMake
4 8 (6.96%) Eclipse
5 7 (6.09%) Bitbucket
6 4 (3.48%) Jenkins
6 4 (3.48%) Postman
7 3 (2.61%) Rational Rhapsody
8 2 (1.74%) GNU Toolchain
8 2 (1.74%) LabVIEW
8 2 (1.74%) SoapUI
8 2 (1.74%) Team Foundation Server
8 2 (1.74%) Visual Studio Team System
9 1 (0.87%) ClearCase
9 1 (0.87%) ClearQuest
9 1 (0.87%) IntelliJ
9 1 (0.87%) JUnit
9 1 (0.87%) Selenium
9 1 (0.87%) TeamCity
General
1 31 (26.96%) Social Skills
2 30 (26.09%) Electronics
3 21 (18.26%) Analytical Skills
4 13 (11.30%) Aerospace
5 12 (10.43%) Military
6 11 (9.57%) Finance
6 11 (9.57%) Manufacturing
7 9 (7.83%) Marketing
8 8 (6.96%) Public Sector
9 7 (6.09%) Telecoms
10 6 (5.22%) Wearables
11 4 (3.48%) Retail
12 3 (2.61%) Games
13 2 (1.74%) Documentation Skills
13 2 (1.74%) Presentation Skills
13 2 (1.74%) Tech for Good
14 1 (0.87%) Automotive
14 1 (0.87%) Dutch Language
Job Titles
1 43 (37.39%) Software Engineer
2 23 (20.00%) Lead
3 22 (19.13%) Senior
4 15 (13.04%) Developer
5 13 (11.30%) Applications Engineer
5 13 (11.30%) Embedded Engineer
5 13 (11.30%) Senior Software Engineer
6 10 (8.70%) Configuration Manager
7 9 (7.83%) Analyst
7 9 (7.83%) Embedded Software Engineer
8 8 (6.96%) C++ Software Engineer
8 8 (6.96%) Java Engineer
9 7 (6.09%) Data Analyst
9 7 (6.09%) Senior C++ Software Engineer
9 7 (6.09%) Team Leader
10 5 (4.35%) Principal Engineer
11 4 (3.48%) Data Modeller
11 4 (3.48%) Electronics Engineer
11 4 (3.48%) Senior Data Modeller
11 4 (3.48%) Software Team Leader
Libraries, Frameworks & Software Standards
1 24 (20.87%) .NET
2 22 (19.13%) Qt
3 16 (13.91%) .NET Framework
4 11 (9.57%) XML
5 10 (8.70%) Web Services
6 9 (7.83%) MFC
6 9 (7.83%) Spring
6 9 (7.83%) Spring Boot
7 8 (6.96%) SOAP
7 8 (6.96%) STL
8 7 (6.09%) CSS
8 7 (6.09%) HTML
9 6 (5.22%) ASP.NET Web API
9 6 (5.22%) JSON
9 6 (5.22%) Laravel
9 6 (5.22%) RESTful
10 5 (4.35%) AngularJS
10 5 (4.35%) Node.js
10 5 (4.35%) React
10 5 (4.35%) WinForms
Miscellaneous
1 20 (17.39%) IoT
2 14 (12.17%) Data Structures
3 12 (10.43%) Distributed Systems
3 12 (10.43%) Robotics
4 10 (8.70%) Algorithms
5 6 (5.22%) ARM Cortex
5 6 (5.22%) Embedded Systems
6 5 (4.35%) NB-IoT
6 5 (4.35%) VHDL
7 4 (3.48%) FPGA
8 2 (1.74%) Driving Licence
8 2 (1.74%) Graphic Design
8 2 (1.74%) Linux Command Line
8 2 (1.74%) PCIe
8 2 (1.74%) Product Ownership
8 2 (1.74%) Self-Motivation
8 2 (1.74%) Smart Energy
9 1 (0.87%) CAN bus
9 1 (0.87%) Legacy Systems
9 1 (0.87%) Onboarding
Operating Systems
1 53 (46.09%) Linux
2 37 (32.17%) Windows
3 12 (10.43%) Ubuntu
3 12 (10.43%) Windows 10
4 5 (4.35%) FreeRTOS
5 3 (2.61%) Android
5 3 (2.61%) Apple iOS
5 3 (2.61%) VxWorks
6 2 (1.74%) Embedded Linux
6 2 (1.74%) Unix
7 1 (0.87%) OpenWrt
7 1 (0.87%) Red Hat Enterprise Linux
7 1 (0.87%) ThreadX
Processes & Methodologies
1 59 (51.30%) Agile
2 52 (45.22%) Software Engineering
3 30 (26.09%) DevOps
4 28 (24.35%) Mentoring
5 25 (21.74%) Configuration Management
6 23 (20.00%) Business Intelligence
6 23 (20.00%) Computer Science
7 22 (19.13%) Collaborative Working
8 21 (18.26%) Customer Requirements
8 21 (18.26%) Software Architecture
9 19 (16.52%) Analytics
9 19 (16.52%) Validation
10 17 (14.78%) Data Modelling
10 17 (14.78%) E-Commerce
11 16 (13.91%) Coaching
11 16 (13.91%) Problem-Solving
12 15 (13.04%) Infrastructure as Code
12 15 (13.04%) Mathematics
13 14 (12.17%) Data Validation
13 14 (12.17%) MapReduce
Programming Languages
1 41 (35.65%) C++
1 41 (35.65%) Python
2 36 (31.30%) C
3 28 (24.35%) SQL
4 20 (17.39%) Java
5 18 (15.65%) C#
5 18 (15.65%) R
6 14 (12.17%) Julia
7 11 (9.57%) Embedded C
8 9 (7.83%) JavaScript
9 8 (6.96%) Bash
9 8 (6.96%) PHP
10 7 (6.09%) MATLAB
11 5 (4.35%) Assembly Language
11 5 (4.35%) Embedded C++
11 5 (4.35%) TypeScript
12 4 (3.48%) T-SQL
13 3 (2.61%) Ruby
13 3 (2.61%) Scala
13 3 (2.61%) XAML
Qualifications
1 49 (42.61%) Degree
2 14 (12.17%) Computer Science Degree
3 11 (9.57%) Security Cleared
4 8 (6.96%) SC Cleared
5 6 (5.22%) Master's Degree
6 4 (3.48%) Chartered Engineer
7 3 (2.61%) HNC
7 3 (2.61%) HND
8 2 (1.74%) BPSS Clearance
9 1 (0.87%) DV Cleared
9 1 (0.87%) ISEB
9 1 (0.87%) ISTQB
9 1 (0.87%) PhD
9 1 (0.87%) PMI Certification
Quality Assurance & Compliance
1 4 (3.48%) Accessibility
1 4 (3.48%) IEC 61131
1 4 (3.48%) JTAG
1 4 (3.48%) PMO
2 1 (0.87%) GDPR
2 1 (0.87%) ISO 9001
2 1 (0.87%) QA
System Software
1 8 (6.96%) Firmware
2 2 (1.74%) Docker
2 2 (1.74%) Embedded Firmware
3 1 (0.87%) iptables
3 1 (0.87%) VMware Infrastructure
Systems Management
1 10 (8.70%) Ansible
2 2 (1.74%) Kubernetes
3 1 (0.87%) Terraform
Vendors
1 27 (23.48%) Microsoft
2 8 (6.96%) SAP
3 7 (6.09%) EMC
4 3 (2.61%) Wind River
5 2 (1.74%) Altera
5 2 (1.74%) Atlassian
5 2 (1.74%) Cadence
5 2 (1.74%) Databricks
5 2 (1.74%) Lattice Semiconductor
5 2 (1.74%) Oracle
6 1 (0.87%) Autodesk
6 1 (0.87%) BT
6 1 (0.87%) CA
6 1 (0.87%) Fortinet
6 1 (0.87%) IBM
6 1 (0.87%) Mitel
6 1 (0.87%) NCR
6 1 (0.87%) Red Hat
6 1 (0.87%) VMware
6 1 (0.87%) webMethods