User Acceptance Testing Jobs in the UK excluding London

User Acceptance Testing (UAT)
UK > UK excluding London

The table below provides summary statistics for permanent job vacancies advertised in the UK excluding London requiring User Acceptance Testing skills. It includes a benchmarking guide to the annual salaries offered in vacancies that cited User Acceptance Testing over the 6 months leading up to 26 July 2024, comparing them to the same period in the previous two years.

6 months to
26 Jul 2024
Same period 2023 Same period 2022
Rank 381 225 292
Rank change year-on-year -156 +67 +12
Permanent jobs citing User Acceptance Testing 358 766 939
As % of all permanent jobs advertised in the UK excluding London 0.55% 1.59% 1.20%
As % of the Processes & Methodologies category 0.69% 1.67% 1.26%
Number of salaries quoted 263 346 607
10th Percentile £31,250 £32,500 £32,000
25th Percentile £42,375 £40,000 £37,500
Median annual salary (50th Percentile) £52,500 £55,000 £45,041
Median % change year-on-year -4.55% +22.11% +0.09%
75th Percentile £62,500 £61,250 £57,500
90th Percentile £75,000 £70,000 £65,000
UK median annual salary £55,000 £55,100 £52,500
% change year-on-year -0.18% +4.95% +5.00%

All Process and Methodology Skills
UK excluding London

User Acceptance Testing falls under the Processes and Methodologies category. For comparison with the information above, the following table provides summary statistics for all permanent job vacancies requiring process or methodology skills in the UK excluding London.

Permanent vacancies with a requirement for process or methodology skills 51,975 45,995 74,754
As % of all permanent jobs advertised in the UK excluding London 79.63% 95.53% 95.46%
Number of salaries quoted 33,355 26,900 43,045
10th Percentile £28,371 £30,500 £30,076
25th Percentile £37,500 £40,000 £39,000
Median annual salary (50th Percentile) £50,000 £55,000 £52,500
Median % change year-on-year -9.09% +4.76% +6.06%
75th Percentile £65,000 £69,500 £67,500
90th Percentile £80,000 £82,050 £81,250
UK median annual salary £55,000 £60,000 £60,000
% change year-on-year -8.33% - +9.09%

User Acceptance Testing
Job Vacancy Trend in the UK excluding London

Job postings citing User Acceptance Testing as a proportion of all IT jobs advertised in the UK excluding London.
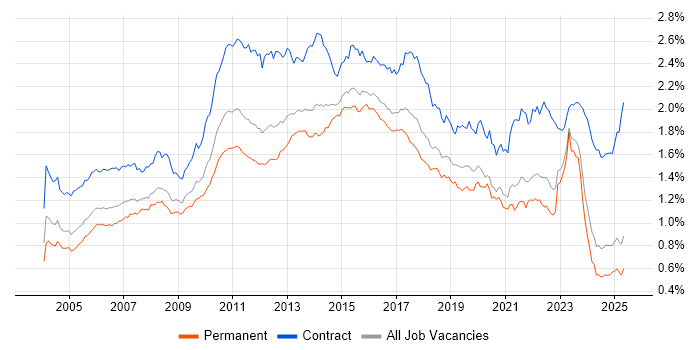
Job vacancy trend for User Acceptance Testing in the UK excluding London

User Acceptance Testing
Salary Trend in the UK excluding London

3-month moving average salary quoted in jobs citing User Acceptance Testing in the UK excluding London.

Salary trend for User Acceptance Testing in the UK excluding London

User Acceptance Testing
Salary Histogram in the UK excluding London

Salary distribution for jobs citing User Acceptance Testing in the UK excluding London over the 6 months to 26 July 2024.

Salary histogram for User Acceptance Testing in the UK excluding London

User Acceptance Testing
Job Locations in the UK excluding London

The table below looks at the demand and provides a guide to the median salaries quoted in IT jobs citing User Acceptance Testing within the UK excluding London region over the 6 months to 26 July 2024. The 'Rank Change' column provides an indication of the change in demand within each location based on the same 6 month period last year.

Location Rank Change
on Same Period
Last Year
Matching
Permanent
IT Job Ads
Median Salary
Past 6 Months
Median Salary
% Change
on Same Period
Last Year
Live
Jobs
North of England -126 94 £55,000 - 13
Midlands -61 88 £52,500 -4.55% 19
South East -67 67 £52,500 +11.70% 21
North West -107 55 £55,000 -4.35% 9
West Midlands -27 53 £58,700 -9.69% 14
South West -30 38 £43,750 -20.45% 3
Scotland -54 36 £52,000 +5.65% 4
Yorkshire -5 35 £60,000 +20.00% 3
East Midlands -46 35 £40,500 -10.00% 5
East of England -7 33 £46,297 +15.74% 7
North East -28 4 £40,250 -5.29% 1
Wales +9 2 £41,200 +17.71% 1
Northern Ireland +5 2 £47,500 - 3
User Acceptance Testing
UK

User Acceptance Testing
Co-occurring Skills and Capabilities in the UK excluding London by Category

The follow tables expand on the table above by listing co-occurrences grouped by category. The same employment type, locality and period is covered with up to 20 co-occurrences shown in each of the following categories:

Application Platforms
1 28 (7.82%) IIS
2 17 (4.75%) Confluence
3 8 (2.23%) SharePoint
4 3 (0.84%) Microsoft Exchange
5 2 (0.56%) CMS
6 1 (0.28%) SAS
Applications
1 19 (5.31%) Microsoft Excel
2 17 (4.75%) Microsoft PowerPoint
3 16 (4.47%) Microsoft Office
4 6 (1.68%) MS Visio
5 1 (0.28%) Microsoft Project
5 1 (0.28%) Trello
Business Applications
1 22 (6.15%) Dynamics CRM
2 5 (1.40%) Dynamics NAV
2 5 (1.40%) Oracle ERP
3 4 (1.12%) SAP ERP
4 2 (0.56%) Oracle EBS
4 2 (0.56%) SAP CRM
5 1 (0.28%) NetSuite
5 1 (0.28%) SAP MM
5 1 (0.28%) SAP PLM
5 1 (0.28%) SAP PP
5 1 (0.28%) SAP S/4HANA
5 1 (0.28%) SAP SCM
5 1 (0.28%) SAP WM
5 1 (0.28%) Teamcenter
Cloud Services
1 68 (18.99%) Azure
2 45 (12.57%) Dynamics 365
3 38 (10.61%) Azure DevOps
4 35 (9.78%) Power Platform
5 17 (4.75%) PowerApps
6 13 (3.63%) Microsoft 365
7 9 (2.51%) SaaS
8 6 (1.68%) PaaS
8 6 (1.68%) Power Automate
9 5 (1.40%) AWS
10 4 (1.12%) IaaS
10 4 (1.12%) OCI
11 2 (0.56%) Azure App Service
11 2 (0.56%) Azure Data Factory
11 2 (0.56%) Azure Synapse Analytics
12 1 (0.28%) Cloud Computing
12 1 (0.28%) Figma
12 1 (0.28%) GitHub
12 1 (0.28%) GitHub Actions
12 1 (0.28%) SuccessFactors
Communications & Networking
1 5 (1.40%) 5G
1 5 (1.40%) Broadband
1 5 (1.40%) Wi-Fi
1 5 (1.40%) Wireless
2 4 (1.12%) LAN
3 1 (0.28%) Bluetooth
3 1 (0.28%) Internet
3 1 (0.28%) Intranet
Database & Business Intelligence
1 33 (9.22%) SQL Server
2 25 (6.98%) Power BI
3 11 (3.07%) Power Query
4 6 (1.68%) Data Lake
4 6 (1.68%) Data Warehouse
5 3 (0.84%) Relational Database
6 2 (0.56%) Oracle Reports
6 2 (0.56%) PostgreSQL
6 2 (0.56%) Tableau
7 1 (0.28%) RDBMS
7 1 (0.28%) Redis
7 1 (0.28%) SAS Enterprise Guide
7 1 (0.28%) SQL Server Reporting Services
Development Applications
1 34 (9.50%) JIRA
2 28 (7.82%) Jasmine
2 28 (7.82%) Karma Test Runner
3 15 (4.19%) Selenium
4 12 (3.35%) Cucumber
5 8 (2.23%) Bitbucket
5 8 (2.23%) Cypress.io
5 8 (2.23%) TeamCity
6 7 (1.96%) Git
7 6 (1.68%) MSTest
7 6 (1.68%) Postman
7 6 (1.68%) Visual Studio
8 3 (0.84%) JMeter
8 3 (0.84%) LoadRunner
9 2 (0.56%) MSI
9 2 (0.56%) Zephyr
10 1 (0.28%) Appium
10 1 (0.28%) GitLab
10 1 (0.28%) Jenkins
10 1 (0.28%) Sourcetree
General
1 122 (34.08%) Social Skills
2 106 (29.61%) Finance
3 59 (16.48%) Analytical Skills
4 43 (12.01%) Law
5 34 (9.50%) Inclusion and Diversity
6 28 (7.82%) Retail
7 18 (5.03%) Marketing
8 15 (4.19%) Influencing Skills
9 13 (3.63%) Back Office
10 10 (2.79%) Banking
10 10 (2.79%) Billing
10 10 (2.79%) Presentation Skills
10 10 (2.79%) Public Sector
10 10 (2.79%) Telecoms
11 9 (2.51%) Investment Banking
12 8 (2.23%) Legal
12 8 (2.23%) Manufacturing
12 8 (2.23%) Organisational Skills
13 7 (1.96%) Local Government
14 6 (1.68%) Documentation Skills
Job Titles
1 70 (19.55%) Analyst
2 57 (15.92%) Developer
3 41 (11.45%) Senior
4 35 (9.78%) Business Analyst
5 28 (7.82%) C# Developer
6 27 (7.54%) Test Manager
7 25 (6.98%) Applications Support
8 23 (6.42%) Lead
9 21 (5.87%) Project Manager
10 15 (4.19%) Consultant
11 13 (3.63%) Applications Engineer
11 13 (3.63%) Applications Support Engineer
11 13 (3.63%) Support Engineer
12 12 (3.35%) Test Engineer
13 10 (2.79%) Architect
13 10 (2.79%) Business Manager
13 10 (2.79%) Product Manager
13 10 (2.79%) Support Analyst
14 9 (2.51%) Build Engineer
14 9 (2.51%) Windows Engineer
Libraries, Frameworks & Software Standards
1 42 (11.73%) .NET
2 37 (10.34%) XML
3 34 (9.50%) JSON
4 33 (9.22%) SOAP
4 33 (9.22%) Web Services
5 32 (8.94%) ASP.NET
6 29 (8.10%) AngularJS
7 28 (7.82%) REST
7 28 (7.82%) RxJS
7 28 (7.82%) Sass
7 28 (7.82%) XML Schema
8 12 (3.35%) Gherkin
9 6 (1.68%) Hibernate
9 6 (1.68%) HTML
9 6 (1.68%) RESTful
10 5 (1.40%) Middleware
10 5 (1.40%) Oracle Fusion
11 2 (0.56%) CSS
11 2 (0.56%) EDI
11 2 (0.56%) React
Miscellaneous
1 21 (5.87%) Product Ownership
2 14 (3.91%) Management Information System
3 9 (2.51%) IoT
4 6 (1.68%) Self-Motivation
5 5 (1.40%) Data Protection Act
5 5 (1.40%) Virtual Team
6 4 (1.12%) Analytical Mindset
6 4 (1.12%) Blog
6 4 (1.12%) Data Centre
6 4 (1.12%) Enterprise Software
6 4 (1.12%) Housing Association
6 4 (1.12%) Mobile App
7 3 (0.84%) Blockchain
7 3 (0.84%) Derivative
7 3 (0.84%) FMCG
7 3 (0.84%) Legacy Systems
7 3 (0.84%) Onboarding
8 2 (0.56%) BBC
8 2 (0.56%) Greenfield Project
8 2 (0.56%) Market Risk
Operating Systems
1 26 (7.26%) Windows
2 12 (3.35%) Windows 10
3 11 (3.07%) Windows Server 2012
4 9 (2.51%) Windows NT
4 9 (2.51%) Windows Server
4 9 (2.51%) Windows Server 2016
4 9 (2.51%) Windows Server 2019
5 2 (0.56%) Android
5 2 (0.56%) Apple iOS
6 1 (0.28%) Linux
6 1 (0.28%) Unix
Processes & Methodologies
1 103 (28.77%) Agile
2 98 (27.37%) Problem-Solving
3 63 (17.60%) Customer Service
4 58 (16.20%) DevOps
5 56 (15.64%) Project Management
6 50 (13.97%) Test Automation
7 48 (13.41%) Continuous Improvement
8 43 (12.01%) ERP
8 43 (12.01%) Project Delivery
9 41 (11.45%) Stakeholder Management
9 41 (11.45%) Test Strategy
10 40 (11.17%) Service Management
10 40 (11.17%) Unit Testing
11 38 (10.61%) Software Testing
12 37 (10.34%) CRM
13 35 (9.78%) Customer Requirements
14 34 (9.50%) Business Intelligence
14 34 (9.50%) ITIL
14 34 (9.50%) Process Improvement
15 31 (8.66%) Waterfall
Programming Languages
1 90 (25.14%) SQL
2 48 (13.41%) C#
3 39 (10.89%) JavaScript
4 29 (8.10%) T-SQL
5 28 (7.82%) TypeScript
5 28 (7.82%) VB
5 28 (7.82%) VB.NET
5 28 (7.82%) VB6
6 19 (5.31%) Java
7 8 (2.23%) Python
8 5 (1.40%) C++
9 3 (0.84%) C
9 3 (0.84%) PL/SQL
10 2 (0.56%) PowerShell
10 2 (0.56%) VBA
11 1 (0.28%) Data Analysis Expressions
11 1 (0.28%) Shell Script
Qualifications
1 71 (19.83%) Degree
2 34 (9.50%) Security Cleared
3 28 (7.82%) SC Cleared
4 14 (3.91%) DV Cleared
5 11 (3.07%) ISTQB
6 7 (1.96%) ISEB
6 7 (1.96%) Microsoft Certification
7 6 (1.68%) CSPO
7 6 (1.68%) IIBA
8 5 (1.40%) ISTQB Foundation Certification
9 4 (1.12%) Computer Science Degree
10 3 (0.84%) A+ Certification
10 3 (0.84%) Azure Certification
10 3 (0.84%) ITIL Certification
10 3 (0.84%) MCITP
10 3 (0.84%) PMI Certification
10 3 (0.84%) PMP
11 2 (0.56%) CAPM
11 2 (0.56%) HND
11 2 (0.56%) PRINCE2 Certification
Quality Assurance & Compliance
1 104 (29.05%) QA
2 16 (4.47%) SLA
3 10 (2.79%) ISO/IEC 27001
4 9 (2.51%) Data Quality
5 7 (1.96%) ISO 9001
6 5 (1.40%) GDPR
7 4 (1.12%) Cyber Essentials
8 2 (0.56%) ISO 14001
9 1 (0.28%) Accessibility
9 1 (0.28%) Cyber Essentials PLUS
9 1 (0.28%) EMIR
9 1 (0.28%) MiFID
9 1 (0.28%) NIST
System Software
1 12 (3.35%) Active Directory
1 12 (3.35%) Firmware
2 2 (0.56%) Microsoft App-V
2 2 (0.56%) Virtual Machines
2 2 (0.56%) Virtual Servers
3 1 (0.28%) Docker
Systems Management
1 11 (3.07%) SCCM
2 9 (2.51%) Sysprep
2 9 (2.51%) WSUS
3 1 (0.28%) Grafana
3 1 (0.28%) Kibana
Vendors
1 112 (31.28%) Microsoft
2 16 (4.47%) Oracle
2 16 (4.47%) SAP
3 15 (4.19%) ServiceNow
4 7 (1.96%) Salesforce
5 5 (1.40%) Virgin Media
6 3 (0.84%) Cadence
6 3 (0.84%) Cisco
6 3 (0.84%) Genesys
6 3 (0.84%) Meraki
6 3 (0.84%) Sophos
7 2 (0.56%) Civica
7 2 (0.56%) Databricks
7 2 (0.56%) Workday
8 1 (0.28%) Anaplan
8 1 (0.28%) Blue Prism
8 1 (0.28%) CA Agile Central
8 1 (0.28%) Splunk
8 1 (0.28%) UiPath
8 1 (0.28%) YouTube