User Acceptance Testing Jobs

User Acceptance Testing (UAT)
UK

The following table provides summary statistics for permanent job vacancies with a requirement for User Acceptance Testing skills. Included is a benchmarking guide to the salaries offered in vacancies that have cited User Acceptance Testing over the 6 months to 27 April 2024 with a comparison to the same period in the previous 2 years.

6 months to
27 Apr 2024
Same period 2023 Same period 2022
Rank 357 304 339
Rank change year-on-year -53 +35 -42
Permanent jobs citing User Acceptance Testing 755 1,211 1,799
As % of all permanent jobs advertised in the UK 0.77% 1.16% 1.17%
As % of the Processes & Methodologies category 0.90% 1.21% 1.22%
Number of salaries quoted 589 775 1,251
10th Percentile £36,200 £37,500 £35,000
25th Percentile £42,500 £45,000 £42,000
Median annual salary (50th Percentile) £55,000 £55,000 £55,000
Median % change year-on-year - - +15.79%
75th Percentile £70,000 £68,750 £70,000
90th Percentile £82,500 £80,000 £82,500
UK excluding London median annual salary £52,500 £52,000 £45,250
% change year-on-year +0.96% +14.92% +6.47%

All Process and Methodology Skills
UK

User Acceptance Testing is in the Processes and Methodologies category. The following table is for comparison with the above and provides summary statistics for all permanent job vacancies with a requirement for process or methodology skills.

Permanent vacancies with a requirement for process or methodology skills 84,305 100,095 147,310
As % of all permanent jobs advertised in the UK 85.99% 95.64% 95.57%
Number of salaries quoted 59,591 58,745 83,129
10th Percentile £29,000 £34,000 £33,500
25th Percentile £40,000 £45,000 £43,750
Median annual salary (50th Percentile) £55,000 £62,000 £60,000
Median % change year-on-year -11.29% +3.33% +9.09%
75th Percentile £72,500 £82,500 £80,000
90th Percentile £92,500 £100,000 £96,250
UK excluding London median annual salary £50,000 £55,000 £52,500
% change year-on-year -9.09% +4.76% +9.38%

User Acceptance Testing
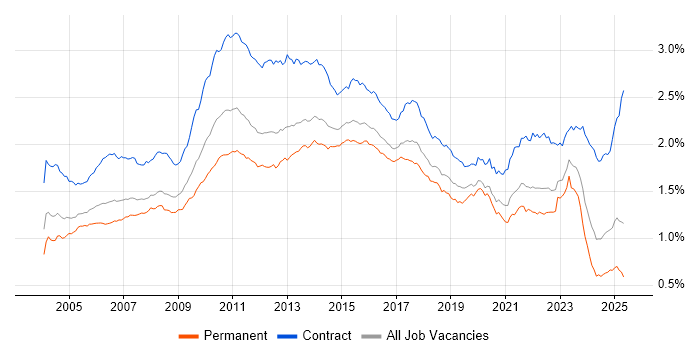
Job Vacancy Trend

Job postings citing User Acceptance Testing as a proportion of all IT jobs advertised.

Job vacancy trend for User Acceptance Testing in the UK

User Acceptance Testing
Salary Trend

3-month moving average salary quoted in jobs citing User Acceptance Testing.

Salary trend for User Acceptance Testing in the UK

User Acceptance Testing
Salary Histogram

Salary distribution for jobs citing User Acceptance Testing over the 6 months to 27 April 2024.

Salary histogram for User Acceptance Testing in the UK

User Acceptance Testing
Top 16 Job Locations

The table below looks at the demand and provides a guide to the median salaries quoted in IT jobs citing User Acceptance Testing within the UK over the 6 months to 27 April 2024. The 'Rank Change' column provides an indication of the change in demand within each location based on the same 6 month period last year.

Location Rank Change
on Same Period
Last Year
Matching
Permanent
IT Job Ads
Median Salary
Past 6 Months
Median Salary
% Change
on Same Period
Last Year
Live
Jobs
England -34 688 £56,000 +1.82% 211
UK excluding London -21 516 £52,500 +0.96% 136
Work from Home -37 330 £55,000 - 80
London -60 205 £67,000 +7.63% 85
North of England +55 149 £52,500 -4.55% 30
Midlands +46 131 £52,500 +5.00% 32
South East -37 93 £57,500 +4.55% 33
North West +3 85 £51,337 -10.72% 15
West Midlands +53 74 £57,500 +9.52% 15
Yorkshire +112 59 £57,500 +22.34% 14
East Midlands +1 57 £45,000 - 17
East of England +5 55 £45,000 -5.26% 12
South West -41 45 £60,000 +14.29% 11
Scotland -69 34 £52,000 +2.08% 10
Wales +10 12 £55,000 +57.14% 2
North East -6 7 £40,500 -26.36% 1

User Acceptance Testing
Co-occurring Skills and Capabilities by Category

The follow tables expand on the table above by listing co-occurrences grouped by category. The same employment type, locality and period is covered with up to 20 co-occurrences shown in each of the following categories:

Application Platforms
1 28 (3.71%) IIS
2 18 (2.38%) Confluence
3 17 (2.25%) SharePoint
4 8 (1.06%) CMS
4 8 (1.06%) Microsoft Exchange
5 4 (0.53%) Adobe Experience Manager
5 4 (0.53%) SAS
6 2 (0.26%) Anypoint
6 2 (0.26%) Kentico
6 2 (0.26%) Sitecore CMS
7 1 (0.13%) Umbraco
Applications
1 52 (6.89%) Microsoft Excel
2 32 (4.24%) Microsoft Office
3 16 (2.12%) Microsoft PowerPoint
4 10 (1.32%) MS Visio
5 4 (0.53%) SPSS
6 3 (0.40%) Microsoft Project
7 1 (0.13%) Photoshop
Business Applications
1 34 (4.50%) Dynamics CRM
2 18 (2.38%) NetSuite
3 11 (1.46%) Dynamics NAV
4 7 (0.93%) Dynamics AX
4 7 (0.93%) SAP S/4HANA
5 6 (0.79%) SAP ERP
5 6 (0.79%) SAP PLM
5 6 (0.79%) Teamcenter
6 5 (0.66%) Oracle ERP
6 5 (0.66%) Salesforce CRM
7 2 (0.26%) SAP CO
7 2 (0.26%) SAP CRM
7 2 (0.26%) SAP EWM
7 2 (0.26%) SAP FI
7 2 (0.26%) SAP FI/CO
7 2 (0.26%) SAP MM
7 2 (0.26%) SAP SCM
7 2 (0.26%) SAP SD
7 2 (0.26%) SAP WM
8 1 (0.13%) thinkFolio
Cloud Services
1 154 (20.40%) Azure
2 87 (11.52%) Azure DevOps
3 74 (9.80%) Dynamics 365
4 68 (9.01%) Power Platform
5 35 (4.64%) AWS
6 22 (2.91%) Microsoft 365
7 20 (2.65%) PowerApps
7 20 (2.65%) SaaS
8 14 (1.85%) PaaS
9 13 (1.72%) GitHub
10 9 (1.19%) Azure Logic Apps
10 9 (1.19%) OCI
11 8 (1.06%) Power Automate
12 5 (0.66%) Azure Data Factory
12 5 (0.66%) GitHub Actions
13 4 (0.53%) Dropbox
13 4 (0.53%) IaaS
14 3 (0.40%) AWS CodePipeline
14 3 (0.40%) WhatsApp
15 2 (0.26%) Azure Monitor
Communications & Networking
1 5 (0.66%) 5G
1 5 (0.66%) Broadband
2 4 (0.53%) LAN
2 4 (0.53%) Wi-Fi
2 4 (0.53%) Wireless
3 2 (0.26%) DNS
3 2 (0.26%) SSH
4 1 (0.13%) Diameter Protocol
4 1 (0.13%) GSM
4 1 (0.13%) Intranet
4 1 (0.13%) SIGTRAN
4 1 (0.13%) SS7
4 1 (0.13%) Value-Added Service
Database & Business Intelligence
1 88 (11.66%) SQL Server
2 59 (7.81%) Power BI
3 31 (4.11%) SQL Server Integration Services
4 29 (3.84%) SQL Server Reporting Services
5 23 (3.05%) Data Warehouse
6 14 (1.85%) Data Lake
6 14 (1.85%) Oracle Reports
7 12 (1.59%) Relational Database
8 11 (1.46%) PostgreSQL
9 10 (1.32%) BusinessObjects
9 10 (1.32%) NoSQL
10 9 (1.19%) BusinessObjects Web Intelligence
10 9 (1.19%) Semantic Layer
11 8 (1.06%) Power Query
11 8 (1.06%) Tableau
12 6 (0.79%) SAP HANA
13 5 (0.66%) Amazon QuickSight
13 5 (0.66%) Big Data
13 5 (0.66%) Data Mining
13 5 (0.66%) Redis
Development Applications
1 73 (9.67%) JIRA
2 33 (4.37%) Selenium
3 32 (4.24%) Jasmine
4 28 (3.71%) Karma Test Runner
5 19 (2.52%) Git
6 18 (2.38%) Cucumber
6 18 (2.38%) Visual Studio
7 15 (1.99%) Bitbucket
8 14 (1.85%) Postman
9 11 (1.46%) SQL Server Management Studio (SSMS)
10 10 (1.32%) Cypress.io
11 9 (1.19%) Zephyr
12 8 (1.06%) JMeter
12 8 (1.06%) TeamCity
13 6 (0.79%) MSTest
14 5 (0.66%) GitLab
14 5 (0.66%) Team Foundation Server
14 5 (0.66%) TestRail
15 4 (0.53%) Visual Studio Code
15 4 (0.53%) WebDriver
General
1 260 (34.44%) Finance
2 248 (32.85%) Social Skills
3 154 (20.40%) Analytical Skills
4 88 (11.66%) Law
5 59 (7.81%) Retail
6 45 (5.96%) Inclusion and Diversity
7 42 (5.56%) Marketing
8 39 (5.17%) Influencing Skills
9 34 (4.50%) Back Office
10 26 (3.44%) Billing
11 24 (3.18%) Public Sector
12 22 (2.91%) Legal
13 19 (2.52%) Presentation Skills
14 16 (2.12%) Banking
14 16 (2.12%) Documentation Skills
15 15 (1.99%) Local Government
16 14 (1.85%) General Ledger
17 13 (1.72%) Front Office
17 13 (1.72%) Organisational Skills
18 12 (1.59%) Manufacturing
Job Titles
1 224 (29.67%) Analyst
2 114 (15.10%) Senior
3 91 (12.05%) Business Analyst
4 78 (10.33%) Developer
5 75 (9.93%) Consultant
6 47 (6.23%) Project Manager
7 44 (5.83%) Lead
8 40 (5.30%) Test Analyst
9 39 (5.17%) Applications Support
10 38 (5.03%) Systems Analyst
11 37 (4.90%) Test Manager
12 30 (3.97%) C# Developer
13 29 (3.84%) Functional Consultant
13 29 (3.84%) Support Analyst
14 27 (3.58%) Dynamics 365 Consultant
15 25 (3.31%) Senior Analyst
15 25 (3.31%) Senior Consultant
16 23 (3.05%) Tester
17 19 (2.52%) Senior Manager
18 18 (2.38%) Applications Support Analyst
Libraries, Frameworks & Software Standards
1 70 (9.27%) .NET
2 52 (6.89%) SOAP
3 44 (5.83%) Web Services
4 40 (5.30%) XML
5 37 (4.90%) JSON
6 35 (4.64%) AngularJS
6 35 (4.64%) ASP.NET
7 32 (4.24%) Sass
8 31 (4.11%) REST
9 29 (3.84%) RESTful
10 28 (3.71%) RxJS
10 28 (3.71%) XML Schema
11 23 (3.05%) HTML
12 20 (2.65%) CSS
13 14 (1.85%) Oracle Fusion
14 12 (1.59%) Gherkin
15 6 (0.79%) CSS3
15 6 (0.79%) HTML5
15 6 (0.79%) Middleware
15 6 (0.79%) React
Miscellaneous
1 48 (6.36%) Product Ownership
2 35 (4.64%) Management Information System
3 33 (4.37%) Self-Motivation
4 22 (2.91%) Virtual Team
5 18 (2.38%) Greenfield Project
6 17 (2.25%) Fixed Income
6 17 (2.25%) Legacy Systems
7 16 (2.12%) Onboarding
8 15 (1.99%) Hedge funds
9 14 (1.85%) Foreign Exchange (FX)
10 11 (1.46%) Enterprise Software
11 10 (1.32%) FMCG
11 10 (1.32%) IoT
12 7 (0.93%) Derivative
13 5 (0.66%) Analytical Mindset
13 5 (0.66%) Cloud Native
13 5 (0.66%) Housing Association
14 4 (0.53%) Blog
14 4 (0.53%) Cybercrime
14 4 (0.53%) Data Centre
Operating Systems
1 25 (3.31%) Windows
2 18 (2.38%) Linux
3 8 (1.06%) Unix
4 7 (0.93%) Windows Server
5 3 (0.40%) Red Hat Enterprise Linux
5 3 (0.40%) Windows 10
6 2 (0.26%) Windows Server 2012
7 1 (0.13%) AIX
7 1 (0.13%) Solaris
7 1 (0.13%) Ubuntu
7 1 (0.13%) VMS
7 1 (0.13%) Windows XP
Processes & Methodologies
1 227 (30.07%) Agile
2 217 (28.74%) Problem-Solving
3 144 (19.07%) DevOps
4 133 (17.62%) Project Management
5 113 (14.97%) Software Testing
6 101 (13.38%) Requirements Gathering
7 93 (12.32%) Project Delivery
7 93 (12.32%) Test Automation
8 92 (12.19%) Business Intelligence
9 80 (10.60%) Continuous Improvement
9 80 (10.60%) Stakeholder Management
10 78 (10.33%) Customer Service
11 77 (10.20%) ERP
12 76 (10.07%) Business Analysis
12 76 (10.07%) Migration
13 75 (9.93%) Process Improvement
14 73 (9.67%) SDLC
15 72 (9.54%) Regression Testing
16 71 (9.40%) Functional Testing
17 70 (9.27%) Test Strategy
Programming Languages
1 157 (20.79%) SQL
2 71 (9.40%) JavaScript
3 68 (9.01%) C#
4 47 (6.23%) T-SQL
5 35 (4.64%) TypeScript
6 32 (4.24%) Python
6 32 (4.24%) VB
7 30 (3.97%) Java
8 28 (3.71%) VB.NET
8 28 (3.71%) VB6
9 14 (1.85%) PL/SQL
10 13 (1.72%) PowerShell
11 11 (1.46%) VBA
12 8 (1.06%) C++
13 6 (0.79%) R
14 5 (0.66%) Rust
15 4 (0.53%) Apex Code
16 3 (0.40%) C
16 3 (0.40%) Perl
16 3 (0.40%) Shell Script
Qualifications
1 172 (22.78%) Degree
2 42 (5.56%) Security Cleared
3 32 (4.24%) SC Cleared
4 29 (3.84%) ISTQB
5 22 (2.91%) ISEB
6 19 (2.52%) Computer Science Degree
7 11 (1.46%) Microsoft Certification
8 8 (1.06%) ISTQB Foundation Certification
9 7 (0.93%) BPSS Clearance
9 7 (0.93%) DBS Check
10 6 (0.79%) Azure Certification
10 6 (0.79%) CSPO
10 6 (0.79%) IIBA
10 6 (0.79%) ITIL Certification
11 5 (0.66%) MCITP
11 5 (0.66%) PMI Certification
12 4 (0.53%) HND
13 3 (0.40%) A+ Certification
13 3 (0.40%) DV Cleared
14 2 (0.26%) PRINCE2 Practitioner
Quality Assurance & Compliance
1 161 (21.32%) QA
2 23 (3.05%) Data Quality
3 20 (2.65%) SLA
4 19 (2.52%) GDPR
5 8 (1.06%) ISO/IEC 27001
6 7 (0.93%) Accessibility
7 5 (0.66%) ISO 9001
8 3 (0.40%) PMO
9 2 (0.26%) Cyber Essentials
9 2 (0.26%) EMIR
9 2 (0.26%) ISO 14001
9 2 (0.26%) MiFID
9 2 (0.26%) PCI DSS
10 1 (0.13%) Good Clinical Practice
System Software
1 13 (1.72%) Firmware
2 10 (1.32%) Docker
2 10 (1.32%) Embedded Firmware
3 5 (0.66%) Active Directory
4 3 (0.40%) Virtual Machines
5 2 (0.26%) Microsoft App-V
5 2 (0.26%) Virtual Servers
5 2 (0.26%) VMware Infrastructure
Systems Management
1 7 (0.93%) Grafana
1 7 (0.93%) Kibana
2 4 (0.53%) Control-M
2 4 (0.53%) Kubernetes
2 4 (0.53%) SCCM
3 2 (0.26%) Ansible
3 2 (0.26%) logstash
3 2 (0.26%) Prometheus
3 2 (0.26%) Terraform
4 1 (0.13%) HP Quality Center
4 1 (0.13%) Progress Chef
Vendors
1 182 (24.11%) Microsoft
2 53 (7.02%) Oracle
3 36 (4.77%) Salesforce
4 32 (4.24%) SAP
5 20 (2.65%) ServiceNow
6 13 (1.72%) Charles River
7 11 (1.46%) Splunk
8 9 (1.19%) Google
9 7 (0.93%) Genesys
9 7 (0.93%) Intapp
10 6 (0.79%) Workday
11 5 (0.66%) Virgin Media
11 5 (0.66%) YouTube
12 4 (0.53%) Adobe
12 4 (0.53%) Cadence
12 4 (0.53%) MuleSoft
12 4 (0.53%) Quadient
13 3 (0.40%) Calypso
13 3 (0.40%) Cisco
13 3 (0.40%) VMware