Software Testing Jobs in the UK excluding London

Software Testing
UK > UK excluding London

The table below provides summary statistics for permanent job vacancies advertised in the UK excluding London requiring Software Testing skills. It includes a benchmarking guide to the annual salaries offered in vacancies that cited Software Testing over the 6 months leading up to 19 June 2025, comparing them to the same period in the previous two years.

6 months to
19 Jun 2025
Same period 2024 Same period 2023
Rank 154 150 81
Rank change year-on-year -4 -69 -13
Permanent jobs citing Software Testing 840 1,442 2,190
As % of all permanent jobs advertised in the UK excluding London 2.11% 1.77% 4.00%
As % of the Processes & Methodologies category 2.32% 2.20% 4.19%
Number of salaries quoted 392 931 751
10th Percentile £26,250 £31,000 £31,250
25th Percentile £41,250 £37,500 £37,500
Median annual salary (50th Percentile) £56,000 £50,000 £50,000
Median % change year-on-year +12.00% - +5.26%
75th Percentile £63,264 £62,200 £70,000
90th Percentile £73,750 £71,250 £85,000
UK median annual salary £57,500 £50,000 £56,000
% change year-on-year +15.00% -10.71% +6.67%

All Process and Methodology Skills
UK excluding London

Software Testing falls under the Processes and Methodologies category. For comparison with the information above, the following table provides summary statistics for all permanent job vacancies requiring process or methodology skills in the UK excluding London.

Permanent vacancies with a requirement for process or methodology skills 36,202 65,409 52,318
As % of all permanent jobs advertised in the UK excluding London 91.10% 80.29% 95.52%
Number of salaries quoted 17,672 44,325 28,200
10th Percentile £25,750 £27,500 £30,500
25th Percentile £34,000 £36,250 £40,000
Median annual salary (50th Percentile) £50,055 £50,000 £55,000
Median % change year-on-year +0.11% -9.09% +4.76%
75th Percentile £65,000 £65,000 £70,000
90th Percentile £77,500 £77,500 £81,250
UK median annual salary £55,000 £55,000 £60,800
% change year-on-year - -9.54% +1.33%

Software Testing
Job Vacancy Trend in the UK excluding London

Job postings citing Software Testing as a proportion of all IT jobs advertised in the UK excluding London.
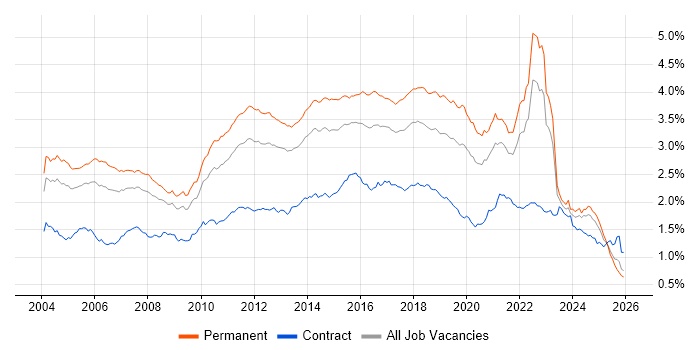
Job vacancy trend for Software Testing in the UK excluding London

Software Testing
Salary Trend in the UK excluding London

3-month moving average salary quoted in jobs citing Software Testing in the UK excluding London.

Salary trend for Software Testing in the UK excluding London

Software Testing
Salary Histogram in the UK excluding London

Salary distribution for jobs citing Software Testing in the UK excluding London over the 6 months to 19 June 2025.

Salary histogram for Software Testing in the UK excluding London

Software Testing
Job Locations in the UK excluding London

The table below looks at the demand and provides a guide to the median salaries quoted in IT jobs citing Software Testing within the UK excluding London region over the 6 months to 19 June 2025. The 'Rank Change' column provides an indication of the change in demand within each location based on the same 6 month period last year.

Location Rank Change
on Same Period
Last Year
Matching
Permanent
IT Job Ads
Median Salary
Past 6 Months
Median Salary
% Change
on Same Period
Last Year
Live
Jobs
Midlands +99 392 £43,500 -3.33% 261
West Midlands +110 258 £15,000 -66.67% 151
South East -2 204 £59,000 +20.41% 405
East Midlands +44 134 £52,000 +5.41% 110
North of England -106 86 £45,000 -18.18% 357
South West +36 68 £56,000 +6.67% 223
Scotland +16 42 £55,000 +15.79% 157
Yorkshire -5 42 £35,000 -36.36% 105
North West -107 38 £60,750 +11.62% 216
East of England -60 27 £53,000 -3.64% 216
Wales +14 20 £60,000 +14.29% 51
North East +35 6 £40,000 -27.27% 36
Northern Ireland +29 1 - - 36
Software Testing
UK

Software Testing
Co-occurring Skills and Capabilities in the UK excluding London by Category

The follow tables expand on the table above by listing co-occurrences grouped by category. The same employment type, locality and period is covered with up to 20 co-occurrences shown in each of the following categories:

Application Platforms
1 14 (1.67%) Appian
2 13 (1.55%) Confluence
3 4 (0.48%) WinCC
4 3 (0.36%) BizTalk Server
4 3 (0.36%) SharePoint
5 2 (0.24%) Microsoft Exchange
6 1 (0.12%) CICS
6 1 (0.12%) FactoryTalk
6 1 (0.12%) IIS
6 1 (0.12%) JBoss
6 1 (0.12%) Tomcat
Applications
1 209 (24.88%) Simulink
2 7 (0.83%) Microsoft Office
3 2 (0.24%) Chatbot
3 2 (0.24%) Microsoft Excel
3 2 (0.24%) Microsoft PowerPoint
4 1 (0.12%) CANalyzer
4 1 (0.12%) CATIA
Business Applications
1 3 (0.36%) Dynamics CRM
2 1 (0.12%) LabWindows
2 1 (0.12%) Sage 200
2 1 (0.12%) SAP Business One
2 1 (0.12%) Shopify
2 1 (0.12%) Sparx Enterprise Architect
2 1 (0.12%) Teamcenter
Cloud Services
1 57 (6.79%) AWS
2 52 (6.19%) SaaS
3 43 (5.12%) Azure
4 24 (2.86%) Cloud Computing
5 18 (2.14%) Azure DevOps
5 18 (2.14%) GCP
6 7 (0.83%) Dynamics 365
7 6 (0.71%) Power Platform
7 6 (0.71%) Serverless
8 4 (0.48%) GitHub
8 4 (0.48%) Microsoft 365
9 3 (0.36%) Amazon SageMaker
9 3 (0.36%) Snowflake
10 2 (0.24%) Amazon EC2
10 2 (0.24%) Amazon S3
10 2 (0.24%) AWS CloudTrail
10 2 (0.24%) AWS Lambda
10 2 (0.24%) Azure Logic Apps
10 2 (0.24%) Power Automate
10 2 (0.24%) Scribe Online
Communications & Networking
1 12 (1.43%) LTE
2 11 (1.31%) 5G
2 11 (1.31%) Bluetooth
2 11 (1.31%) Wi-Fi
3 5 (0.60%) Ethernet
4 4 (0.48%) Profibus
4 4 (0.48%) Software-Defined Radio
5 3 (0.36%) TCP/IP
6 2 (0.24%) Firewall
6 2 (0.24%) Internet
6 2 (0.24%) Modbus
6 2 (0.24%) VPN
7 1 (0.12%) BGP
7 1 (0.12%) DHCP
7 1 (0.12%) DNS
7 1 (0.12%) GSM
7 1 (0.12%) HTTP
7 1 (0.12%) Network Security
7 1 (0.12%) Radio Access Network
7 1 (0.12%) SSL
Database & Business Intelligence
1 44 (5.24%) SQL Server
2 13 (1.55%) OLTP
3 10 (1.19%) MongoDB
4 7 (0.83%) MySQL
4 7 (0.83%) Redis
5 5 (0.60%) NoSQL
5 5 (0.60%) PostgreSQL
5 5 (0.60%) Power BI
5 5 (0.60%) Relational Database
6 4 (0.48%) BigQuery
6 4 (0.48%) Hazelcast
7 3 (0.36%) Elasticsearch
7 3 (0.36%) SQL Server Reporting Services
8 2 (0.24%) Big Data
8 2 (0.24%) Metadata
8 2 (0.24%) RDBMS
9 1 (0.12%) Apache Cassandra
9 1 (0.12%) Couchbase
9 1 (0.12%) Neo4j
9 1 (0.12%) SQL Server Analysis Services
Development Applications
1 51 (6.07%) Git
1 51 (6.07%) JIRA
2 42 (5.00%) Selenium
3 17 (2.02%) Cypress.io
4 14 (1.67%) MagicDraw
5 13 (1.55%) Postman
6 12 (1.43%) SpecFlow
7 10 (1.19%) Jenkins
8 9 (1.07%) Appium
9 7 (0.83%) SoapUI
10 6 (0.71%) Cucumber
10 6 (0.71%) JMeter
10 6 (0.71%) Oracle Forms
10 6 (0.71%) TestRail
10 6 (0.71%) WebDriver
11 5 (0.60%) JUnit
12 4 (0.48%) LoadRunner
13 3 (0.36%) GitLab
13 3 (0.36%) LabVIEW
14 2 (0.24%) Robot Framework
General
1 230 (27.38%) Aerospace
2 208 (24.76%) Automotive
3 143 (17.02%) Social Skills
4 65 (7.74%) Analytical Skills
5 63 (7.50%) Finance
6 28 (3.33%) Inclusion and Diversity
7 26 (3.10%) Organisational Skills
8 19 (2.26%) Banking
9 17 (2.02%) Electronics
9 17 (2.02%) Law
10 12 (1.43%) Manufacturing
11 11 (1.31%) Legal
12 10 (1.19%) Public Sector
12 10 (1.19%) Retail
13 8 (0.95%) Marketing
14 7 (0.83%) Games
15 6 (0.71%) Pharmaceutical
15 6 (0.71%) Presentation Skills
16 4 (0.48%) Influencing Skills
17 3 (0.36%) Tech for Good
Job Titles
1 224 (26.67%) Senior
2 207 (24.64%) Software Engineer
3 138 (16.43%) Principal Engineer
4 119 (14.17%) Systems Engineer
5 102 (12.14%) Development Engineer
6 101 (12.02%) Software Development Engineer
7 100 (11.90%) Senior Software Engineer
8 90 (10.71%) Test Engineer
9 71 (8.45%) Developer
10 69 (8.21%) Software Test Engineer
11 65 (7.74%) Lead
11 65 (7.74%) Principal Software Engineer
12 63 (7.50%) Principal Systems Engineer
13 58 (6.90%) Senior Test Engineer
14 55 (6.55%) Senior Software Test Engineer
15 52 (6.19%) Instrumentation Engineer
16 45 (5.36%) Senior Developer
17 43 (5.12%) Analyst
18 39 (4.64%) Senior Systems Engineer
19 37 (4.40%) Senior Development Engineer
Libraries, Frameworks & Software Standards
1 46 (5.48%) .NET
2 31 (3.69%) HTML
3 30 (3.57%) React
3 30 (3.57%) XML
4 24 (2.86%) Node.js
4 24 (2.86%) Playwright
5 20 (2.38%) ASP.NET
6 19 (2.26%) SOAP
7 17 (2.02%) .NET Core
8 13 (1.55%) CSS
8 13 (1.55%) Kafka
8 13 (1.55%) Qt
9 10 (1.19%) GraphQL
10 8 (0.95%) REST
11 6 (0.71%) AngularJS
11 6 (0.71%) Express.js
11 6 (0.71%) React Native
12 5 (0.60%) Gherkin
12 5 (0.60%) Pandas
12 5 (0.60%) Vue
Miscellaneous
1 37 (4.40%) Mobile App
2 33 (3.93%) Product Ownership
3 27 (3.21%) Self-Motivation
4 17 (2.02%) Embedded Systems
4 17 (2.02%) EPoS
5 16 (1.90%) Acoustics
6 15 (1.79%) Algorithms
6 15 (1.79%) SCADA
7 11 (1.31%) Cloud Native
7 11 (1.31%) IoT
7 11 (1.31%) NB-IoT
8 8 (0.95%) Robotics
9 7 (0.83%) Distributed Systems
10 6 (0.71%) Management Information System
11 5 (0.60%) Data Centre
11 5 (0.60%) Driving Licence
11 5 (0.60%) FPGA
11 5 (0.60%) Operational Technology
12 4 (0.48%) Biopharmaceutical
12 4 (0.48%) Public Cloud
Operating Systems
1 52 (6.19%) Linux
2 51 (6.07%) Windows
3 27 (3.21%) Android
4 14 (1.67%) Windows Server
5 12 (1.43%) Apple iOS
6 10 (1.19%) Unix
7 2 (0.24%) Mac OS
8 1 (0.12%) Embedded Linux
8 1 (0.12%) FreeRTOS
8 1 (0.12%) Ubuntu
8 1 (0.12%) VxWorks
8 1 (0.12%) Windows Server 2008
8 1 (0.12%) Windows Server 2012
8 1 (0.12%) Windows Server 2019
Processes & Methodologies
1 548 (65.24%) Agile
2 390 (46.43%) Software Engineering
3 280 (33.33%) Validation
4 245 (29.17%) Test Automation
5 215 (25.60%) Systems Engineering
6 214 (25.48%) SDLC
7 193 (22.98%) Waterfall
8 153 (18.21%) Computer Science
9 123 (14.64%) Problem-Solving
10 100 (11.90%) CI/CD
11 95 (11.31%) Mathematics
12 77 (9.17%) UML
13 66 (7.86%) Verification and Validation
14 64 (7.62%) Configuration Management
15 57 (6.79%) Regression Testing
16 55 (6.55%) DevOps
17 54 (6.43%) Manual Testing
18 47 (5.60%) Code Quality
19 46 (5.48%) DevSecOps
20 42 (5.00%) Customer Service
Programming Languages
1 209 (24.88%) MATLAB
2 137 (16.31%) Python
3 74 (8.81%) C#
4 73 (8.69%) Java
5 71 (8.45%) JavaScript
6 66 (7.86%) C++
6 66 (7.86%) SQL
7 41 (4.88%) Rust
8 39 (4.64%) C
9 36 (4.29%) TypeScript
10 30 (3.57%) Ada
11 24 (2.86%) Bash
12 19 (2.26%) PL/SQL
13 13 (1.55%) PowerShell
14 11 (1.31%) Fortran
15 5 (0.60%) Embedded C
16 3 (0.36%) Clojure
16 3 (0.36%) Embedded C++
17 2 (0.24%) Go
17 2 (0.24%) T-SQL
Qualifications
1 409 (48.69%) BPSS Clearance
2 332 (39.52%) Degree
3 50 (5.95%) ISTQB
4 44 (5.24%) Security Cleared
5 32 (3.81%) Computer Science Degree
5 32 (3.81%) SC Cleared
6 22 (2.62%) Master's Degree
7 15 (1.79%) DV Cleared
8 14 (1.67%) Chartered Engineer
9 13 (1.55%) ISTQB Foundation Certification
10 11 (1.31%) CompTIA Security+
10 11 (1.31%) Network+ Certification
10 11 (1.31%) PhD
11 7 (0.83%) Numerate Degree
12 5 (0.60%) ISEB
13 3 (0.36%) DBS Check
14 2 (0.24%) Azure Certification
14 2 (0.24%) CCNP
14 2 (0.24%) Cisco Certification
14 2 (0.24%) CITP
Quality Assurance & Compliance
1 86 (10.24%) QA
2 42 (5.00%) ISO/IEC 12207
3 8 (0.95%) Accessibility
4 6 (0.71%) Def Stans
5 3 (0.36%) Data Quality
5 3 (0.36%) GDPR
5 3 (0.36%) ISO 9001
5 3 (0.36%) PMBOK
5 3 (0.36%) Software Quality Assurance
5 3 (0.36%) WCAG
6 2 (0.24%) AUTOSAR
6 2 (0.24%) GxP
6 2 (0.24%) SLA
7 1 (0.12%) IEC 61131
7 1 (0.12%) IEC 61508
7 1 (0.12%) ISO/IEC 15288
7 1 (0.12%) NIST
7 1 (0.12%) NIST 800
System Software
1 14 (1.67%) Docker
2 12 (1.43%) VMware Infrastructure
3 11 (1.31%) vSphere
4 6 (0.71%) Firmware
5 2 (0.24%) Active Directory
5 2 (0.24%) Embedded Firmware
Systems Management
1 22 (2.62%) Kubernetes
2 16 (1.90%) Terraform
3 14 (1.67%) Ansible
4 12 (1.43%) Puppet
5 2 (0.24%) Functional Safety
5 2 (0.24%) Grafana
5 2 (0.24%) Prometheus
6 1 (0.12%) FortiGate
6 1 (0.12%) Opsgenie
6 1 (0.12%) SCCM
6 1 (0.12%) SCOM
Vendors
1 130 (15.48%) Siemens
2 55 (6.55%) Microsoft
3 24 (2.86%) Oracle
4 20 (2.38%) VMware
5 18 (2.14%) Zoho
6 7 (0.83%) Google
6 7 (0.83%) Salesforce
7 6 (0.71%) Rockwell
8 4 (0.48%) Allen-Bradley
8 4 (0.48%) Xilinx
9 3 (0.36%) AVEVA
9 3 (0.36%) Red Hat
9 3 (0.36%) SAP
9 3 (0.36%) ServiceNow
9 3 (0.36%) UiPath
10 2 (0.24%) Splunk
10 2 (0.24%) Wonderware
11 1 (0.12%) Atlassian
11 1 (0.12%) Fortinet
11 1 (0.12%) Pega