Trayport Jobs

Trayport
UK

The table below provides summary statistics for permanent job vacancies requiring knowledge or experience of Trayport products and/or services. It includes a benchmarking guide to the annual salaries offered in vacancies that cited Trayport over the 6 months leading up to 15 May 2025, comparing them to the same period in the previous two years.

The figures below represent the IT labour market in general and are not representative of salaries within Trayport Limited.

6 months to
15 May 2025
Same period 2024 Same period 2023
Rank 680 873 958
Rank change year-on-year +193 +85 +176
Permanent jobs citing Trayport 25 24 19
As % of all permanent jobs advertised in the UK 0.045% 0.024% 0.019%
As % of the Vendors category 0.12% 0.066% 0.045%
Number of salaries quoted 24 17 14
10th Percentile £63,750 £67,500 £69,875
25th Percentile £67,500 £80,000 £73,125
Median annual salary (50th Percentile) £85,000 £85,000 £85,000
Median % change year-on-year - - -7.10%
75th Percentile £90,000 £96,250 £105,625
90th Percentile £109,250 - £123,250
UK excluding London median annual salary - - -

All Vendors
UK

Trayport falls under the Vendor Products and Services category. For comparison with the information above, the following table provides summary statistics for all permanent job vacancies requiring knowledge or experience of all vendor products and services.

Permanent vacancies with a requirement for knowledge or experience of vendor products and services 20,822 36,228 42,021
As % of all permanent jobs advertised in the UK 37.75% 36.58% 41.88%
Number of salaries quoted 11,859 24,854 24,035
10th Percentile £26,250 £26,700 £31,250
25th Percentile £37,500 £35,924 £41,250
Median annual salary (50th Percentile) £55,000 £50,000 £57,500
Median % change year-on-year +10.00% -13.04% +4.55%
75th Percentile £70,600 £68,750 £75,000
90th Percentile £90,000 £87,500 £92,500
UK excluding London median annual salary £50,000 £45,000 £50,000
% change year-on-year +11.11% -10.00% +5.26%

Trayport
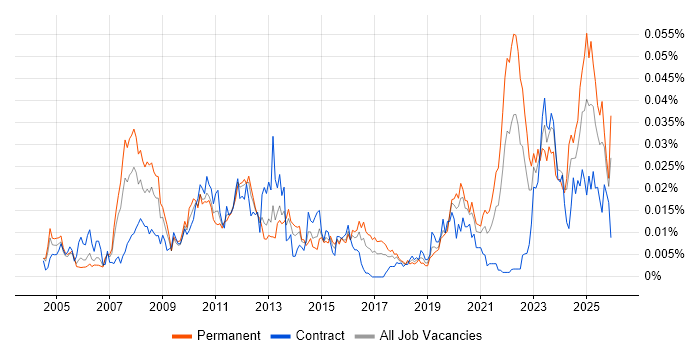
Job Vacancy Trend

Job postings citing Trayport as a proportion of all IT jobs advertised.

Job vacancy trend for Trayport in the UK

Trayport
Salary Trend

3-month moving average salary quoted in jobs citing Trayport.

Salary trend for Trayport in the UK

Trayport
Salary Histogram

Salary distribution for jobs citing Trayport over the 6 months to 15 May 2025.

Salary histogram for Trayport in the UK

Trayport
Top 3 Job Locations

The table below looks at the demand and provides a guide to the median salaries quoted in IT jobs citing Trayport within the UK over the 6 months to 15 May 2025. The 'Rank Change' column provides an indication of the change in demand within each location based on the same 6 month period last year.

Location Rank Change
on Same Period
Last Year
Matching
Permanent
IT Job Ads
Median Salary
Past 6 Months
Median Salary
% Change
on Same Period
Last Year
Live
Jobs
England +147 23 £87,500 +2.94% 7
London +103 23 £87,500 +2.94% 7
Work from Home +133 2 £140,000 +64.71% 2

Trayport
Co-occurring Skills and Capabilities by Category

The follow tables expand on the table above by listing co-occurrences grouped by category. The same employment type, locality and period is covered with up to 20 co-occurrences shown in each of the following categories:

Application Platforms
1 9 (36.00%) Microsoft Exchange
2 2 (8.00%) Confluence
Business Applications
1 9 (36.00%) Fidessa
Cloud Services
1 16 (64.00%) Azure
2 3 (12.00%) Amazon CloudWatch
2 3 (12.00%) AWS
2 3 (12.00%) Datadog
Communications & Networking
1 9 (36.00%) DHCP
1 9 (36.00%) DNS
1 9 (36.00%) Firewall
1 9 (36.00%) FIX Connectivity
1 9 (36.00%) TCP/IP
Database & Business Intelligence
1 12 (48.00%) SQL Server
Development Applications
1 5 (20.00%) Git
2 3 (12.00%) SQL Server Management Studio (SSMS)
3 2 (8.00%) Crucible
3 2 (8.00%) JIRA
General
1 16 (64.00%) Banking
2 13 (52.00%) Front Office
3 10 (40.00%) Finance
4 5 (20.00%) Back Office
5 4 (16.00%) Spanish Language
6 1 (4.00%) Social Skills
Job Titles
1 16 (64.00%) Applications Support
2 9 (36.00%) Analyst
2 9 (36.00%) Applications Support Analyst
2 9 (36.00%) Support Analyst
3 6 (24.00%) Senior
4 5 (20.00%) FIX Analyst
4 5 (20.00%) FIX Support Analyst
4 5 (20.00%) Linux Support
4 5 (20.00%) SQL Analyst
4 5 (20.00%) SQL Support Analyst
5 4 (16.00%) Banking Analyst
5 4 (16.00%) Financial Analyst
5 4 (16.00%) Senior Applications Support
6 3 (12.00%) Developer
7 2 (8.00%) Applications Engineer
7 2 (8.00%) Applications Support Engineer
7 2 (8.00%) DevOps Engineer
7 2 (8.00%) Senior Developer
7 2 (8.00%) Support Engineer
8 1 (4.00%) Middleware Developer
Libraries, Frameworks & Software Standards
1 12 (48.00%) FIX Protocol
2 3 (12.00%) .NET
2 3 (12.00%) Middleware
2 3 (12.00%) RESTful
2 3 (12.00%) XML
3 2 (8.00%) REST
3 2 (8.00%) Web Services
4 1 (4.00%) NHibernate
4 1 (4.00%) WPF
Miscellaneous
1 9 (36.00%) Eurex
2 5 (20.00%) Bitcoin
2 5 (20.00%) Derivative
2 5 (20.00%) Equities
2 5 (20.00%) Fixed Income
3 1 (4.00%) Data Protection Act
Operating Systems
1 9 (36.00%) CentOS
1 9 (36.00%) Linux
2 8 (32.00%) Windows
3 6 (24.00%) Unix
4 5 (20.00%) Rocky
5 1 (4.00%) Solaris
5 1 (4.00%) Ubuntu
Processes & Methodologies
1 9 (36.00%) Client Onboarding
1 9 (36.00%) ITIL
2 5 (20.00%) Electronic Trading
3 3 (12.00%) Agile
3 3 (12.00%) CI/CD
3 3 (12.00%) Configuration Management
3 3 (12.00%) DevOps
3 3 (12.00%) Incident Management
3 3 (12.00%) Infrastructure as Code
3 3 (12.00%) ITSM
3 3 (12.00%) Major Incident Management
3 3 (12.00%) Microservices
3 3 (12.00%) Release Management
3 3 (12.00%) Service Delivery
3 3 (12.00%) Unit Testing
4 2 (8.00%) Code Quality
4 2 (8.00%) TDD
5 1 (4.00%) Mentoring
5 1 (4.00%) Project Delivery
5 1 (4.00%) Risk Management
Programming Languages
1 23 (92.00%) SQL
2 22 (88.00%) Python
3 17 (68.00%) PowerShell
4 6 (24.00%) Bash
4 6 (24.00%) Perl
5 3 (12.00%) C#
5 3 (12.00%) PL/SQL
6 1 (4.00%) JavaScript
6 1 (4.00%) Ruby
Systems Management
1 13 (52.00%) Kubernetes
2 8 (32.00%) Grafana
3 3 (12.00%) Ansible
3 3 (12.00%) Prometheus
3 3 (12.00%) Puppet
Vendors
1 12 (48.00%) Bloomberg
1 12 (48.00%) Oracle
1 12 (48.00%) Reuters
2 9 (36.00%) CQG
2 9 (36.00%) ION Trading
2 9 (36.00%) Red Hat
3 8 (32.00%) Patsystems
4 5 (20.00%) Atlassian
5 3 (12.00%) Splunk