CentOS Linux
UK

The following table provides summary statistics for permanent job vacancies with a requirement for CentOS skills. Included is a benchmarking guide to the salaries offered in vacancies that have cited CentOS over the 6 months to 10 December 2023 with a comparison to the same period in the previous 2 years.

6 months to
10 Dec 2023
Same period 2022 Same period 2021
Rank 572 637 584
Rank change year-on-year +65 -53 -216
Permanent jobs citing CentOS 165 488 576
As % of all permanent jobs advertised in the UK 0.32% 0.40% 0.45%
As % of the Operating Systems category 1.82% 2.40% 2.60%
Number of salaries quoted 124 315 379
10th Percentile £38,084 £41,250 £36,635
25th Percentile £42,500 £45,000 £41,250
Median annual salary (50th Percentile) £55,000 £54,000 £52,500
Median % change year-on-year +1.85% +2.86% +5.00%
75th Percentile £72,500 £70,000 £72,500
90th Percentile £90,000 £87,500 £85,000
UK excluding London median annual salary £50,000 £50,000 £45,000
% change year-on-year - +11.11% -4.76%

All Operating Systems
UK

CentOS is in the Operating Systems category. The following table is for comparison with the above and provides summary statistics for all permanent job vacancies with a requirement for operating system skills.

Permanent vacancies with a requirement for operating system skills 9,056 20,329 22,159
As % of all permanent jobs advertised in the UK 17.32% 16.63% 17.44%
Number of salaries quoted 7,010 13,652 16,244
10th Percentile £27,500 £27,500 £26,250
25th Percentile £34,500 £36,250 £35,000
Median annual salary (50th Percentile) £50,000 £52,500 £50,000
Median % change year-on-year -4.76% +5.00% -
75th Percentile £68,750 £72,500 £70,000
90th Percentile £87,500 £92,500 £85,000
UK excluding London median annual salary £45,000 £45,000 £45,000

CentOS
Job Vacancy Trend

Job postings citing CentOS as a proportion of all IT jobs advertised.
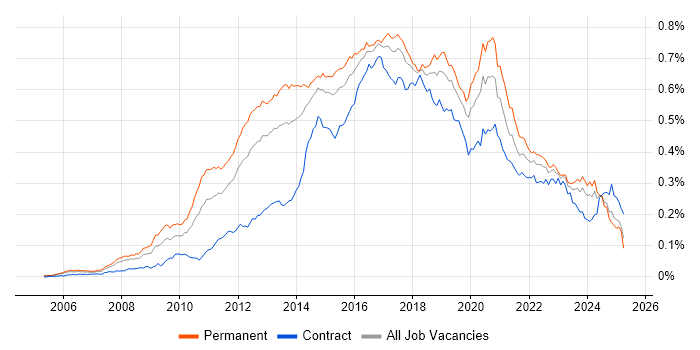
Job vacancy trend for CentOS in the UK

CentOS
Salary Trend

3-month moving average salary quoted in jobs citing CentOS.

Salary trend for CentOS in the UK

CentOS
Salary Histogram

Salary distribution for jobs citing CentOS over the 6 months to 10 December 2023.

Salary histogram for CentOS in the UK

CentOS
Top 13 Job Locations

The table below looks at the demand and provides a guide to the median salaries quoted in IT jobs citing CentOS within the UK over the 6 months to 10 December 2023. The 'Rank Change' column provides an indication of the change in demand within each location based on the same 6 month period last year.

Location Rank Change
on Same Period
Last Year
Matching
Permanent
IT Job Ads
Median Salary
Past 6 Months
Median Salary
% Change
on Same Period
Last Year
Live
Jobs
England +92 150 £55,000 +1.85% 55
UK excluding London +139 119 £50,000 - 32
Work from Home +132 66 £50,000 -4.76% 20
South West +95 50 £47,500 -17.39% 4
South East +125 40 £50,000 - 9
London +138 34 £85,000 +30.77% 33
North West +118 14 £47,500 -3.55% 3
North of England +112 14 £47,500 +3.26% 6
Midlands +93 6 £57,500 +4.55% 8
East Midlands +44 5 £60,000 - 5
Scotland +35 5 £65,000 - 4
Wales +16 4 £39,500 -16.84% 1
West Midlands +96 1 £42,500 -22.73% 3

CentOS
Co-occurring Skills and Capabilities by Category

The follow tables expand on the table above by listing co-occurrences grouped by category. The same employment type, locality and period is covered with up to 20 co-occurrences shown in each of the following categories:

Application Platforms
1 18 (10.91%) Apache
2 11 (6.67%) Apache Spark
2 11 (6.67%) nginx
3 5 (3.03%) OpenStack
4 4 (2.42%) Tomcat
5 1 (0.61%) Confluence
5 1 (0.61%) SAS
Business Applications
1 10 (6.06%) Fidessa
Cloud Services
1 52 (31.52%) AWS
2 40 (24.24%) Azure
3 19 (11.52%) Microsoft 365
4 13 (7.88%) OpenShift
5 9 (5.45%) Amazon EC2
5 9 (5.45%) GCP
6 7 (4.24%) Amazon S3
7 6 (3.64%) Amazon EKS
7 6 (3.64%) AWS CloudFormation
8 5 (3.03%) AWS Lambda
8 5 (3.03%) IaaS
8 5 (3.03%) Serverless
9 4 (2.42%) Entra ID
9 4 (2.42%) GitHub
10 3 (1.82%) Azure DevOps
10 3 (1.82%) Azure Sentinel
10 3 (1.82%) Cloud Computing
10 3 (1.82%) SaaS
10 3 (1.82%) WhatsApp
11 2 (1.21%) Virtual Private Cloud
Communications & Networking
1 34 (20.61%) DNS
2 32 (19.39%) Firewall
3 19 (11.52%) TCP/IP
4 18 (10.91%) DHCP
5 15 (9.09%) WAN
6 14 (8.48%) SAN
7 13 (7.88%) HTTP
8 11 (6.67%) LAN
9 10 (6.06%) FIX Connectivity
9 10 (6.06%) Internet
10 7 (4.24%) SSH
10 7 (4.24%) VPN
11 5 (3.03%) AMQP
11 5 (3.03%) OpenVPN
12 4 (2.42%) Remote Desktop
12 4 (2.42%) VoIP
12 4 (2.42%) VSAN
13 3 (1.82%) Kerberos
13 3 (1.82%) Wi-Fi
13 3 (1.82%) Wireless
Database & Business Intelligence
1 29 (17.58%) MongoDB
2 24 (14.55%) SQL Server
3 17 (10.30%) MySQL
4 15 (9.09%) PostgreSQL
5 12 (7.27%) Big Data
5 12 (7.27%) Hadoop
6 6 (3.64%) Amazon Redshift
6 6 (3.64%) MariaDB
7 5 (3.03%) Cloudera CDH
7 5 (3.03%) InfluxDB
8 4 (2.42%) NoSQL
9 2 (1.21%) Amazon RDS
9 2 (1.21%) Redis
9 2 (1.21%) Relational Database
10 1 (0.61%) Apache Cassandra
10 1 (0.61%) Elasticsearch
10 1 (0.61%) MySQL Workbench
10 1 (0.61%) Oracle Database
10 1 (0.61%) Oracle Reports
10 1 (0.61%) Power BI
Development Applications
1 19 (11.52%) Git
2 10 (6.06%) Jenkins
3 6 (3.64%) Cucumber
3 6 (3.64%) JUnit
3 6 (3.64%) ScalaTest
3 6 (3.64%) WebDriver
4 5 (3.03%) Artifactory
4 5 (3.03%) GitLab
5 4 (2.42%) Vagrant
6 2 (1.21%) Atlassian Bamboo
6 2 (1.21%) Maven
6 2 (1.21%) Subversion
7 1 (0.61%) DBeaver
7 1 (0.61%) JIRA
7 1 (0.61%) Robot Framework
7 1 (0.61%) Selenium
7 1 (0.61%) SonarQube
General
1 46 (27.88%) Finance
2 26 (15.76%) Social Skills
3 13 (7.88%) Banking
4 7 (4.24%) Analytical Skills
5 5 (3.03%) Financial Institution
6 4 (2.42%) Telecoms
7 3 (1.82%) Legal
7 3 (1.82%) Retail
8 2 (1.21%) Advertising
9 1 (0.61%) Aerospace
9 1 (0.61%) Automotive
9 1 (0.61%) Documentation Skills
9 1 (0.61%) Investment Banking
9 1 (0.61%) Organisational Skills
9 1 (0.61%) Public Sector
Job Titles
1 47 (28.48%) Administrator
2 36 (21.82%) Linux Engineer
3 23 (13.94%) DBA
4 22 (13.33%) Infrastructure Engineer
5 19 (11.52%) Senior
5 19 (11.52%) Systems Administrator
6 17 (10.30%) Linux Administrator
7 14 (8.48%) Linux Systems Administrator
8 13 (7.88%) 3rd Line Support
8 13 (7.88%) Applications Support
8 13 (7.88%) Linux Support
9 11 (6.67%) 2nd/3rd Line Support
9 11 (6.67%) Analyst
9 11 (6.67%) Applications Support Analyst
9 11 (6.67%) Developer
9 11 (6.67%) Support Analyst
9 11 (6.67%) Systems Engineer
10 10 (6.06%) 2nd/3rd Line Support Analyst
10 10 (6.06%) DV Cleared DBA
10 10 (6.06%) Financial Analyst
Libraries, Frameworks & Software Standards
1 16 (9.70%) React
2 13 (7.88%) REST
2 13 (7.88%) Spring
3 11 (6.67%) FIX Protocol
3 11 (6.67%) Redux
4 8 (4.85%) Hibernate
5 7 (4.24%) CSS
6 6 (3.64%) jQuery
6 6 (3.64%) JSP
6 6 (3.64%) Node.js
6 6 (3.64%) RabbitMQ
6 6 (3.64%) Sass
6 6 (3.64%) Servlets
7 5 (3.03%) AngularJS
7 5 (3.03%) Flask
7 5 (3.03%) gRPC
7 5 (3.03%) LAPP Stack
7 5 (3.03%) OpenAPI
7 5 (3.03%) Spring Boot
7 5 (3.03%) Swagger
Miscellaneous
1 14 (8.48%) Linux Command Line
2 11 (6.67%) Eurex
3 9 (5.45%) Onboarding
3 9 (5.45%) Video\Live Streaming
4 8 (4.85%) Legacy Systems
5 7 (4.24%) Data Centre
6 6 (3.64%) Cloud Native
7 5 (3.03%) Replication
8 3 (1.82%) PKI
9 2 (1.21%) Enterprise Software
9 2 (1.21%) Video Conferencing
10 1 (0.61%) Derivative
10 1 (0.61%) Foreign Exchange (FX)
10 1 (0.61%) Product Ownership
10 1 (0.61%) Public Cloud
10 1 (0.61%) Security Posture
10 1 (0.61%) Self-Motivation
Operating Systems
1 165 (100.00%) Linux
2 68 (41.21%) Red Hat Enterprise Linux
3 64 (38.79%) Windows
4 58 (35.15%) Ubuntu
5 37 (22.42%) Windows Server 2019
6 32 (19.39%) Unix
7 28 (16.97%) Windows Server 2012
7 28 (16.97%) Windows Server 2016
8 17 (10.30%) Debian
9 15 (9.09%) Windows Server
10 14 (8.48%) Solaris
10 14 (8.48%) Windows 10
11 8 (4.85%) Fedora
12 7 (4.24%) openSUSE
13 6 (3.64%) CoreOS
14 4 (2.42%) Apple iOS
14 4 (2.42%) Data ONTAP
14 4 (2.42%) Mac OS
15 2 (1.21%) OpenBSD
15 2 (1.21%) Rocky
Processes & Methodologies
1 31 (18.79%) Mentoring
2 29 (17.58%) Actionable Insight
2 29 (17.58%) ITIL
3 26 (15.76%) DevOps
4 23 (13.94%) Capacity Management
4 23 (13.94%) Database Tuning
4 23 (13.94%) Infrastructure Engineering
4 23 (13.94%) Performance Monitoring
4 23 (13.94%) Storage Management
4 23 (13.94%) User Experience
5 22 (13.33%) Open Source
6 14 (8.48%) Agile
6 14 (8.48%) Configuration Management
6 14 (8.48%) Migration
6 14 (8.48%) Problem-Solving
7 13 (7.88%) Containerisation
8 12 (7.27%) Infrastructure as Code
8 12 (7.27%) Software Engineering
9 11 (6.67%) Client Onboarding
9 11 (6.67%) Continuous Improvement
Programming Languages
1 82 (49.70%) Python
2 80 (48.48%) Bash
3 47 (28.48%) PowerShell
4 44 (26.67%) Perl
5 40 (24.24%) SQL
6 26 (15.76%) JavaScript
6 26 (15.76%) PHP
7 19 (11.52%) Java
8 15 (9.09%) Shell Script
9 11 (6.67%) Ruby
10 8 (4.85%) TypeScript
11 7 (4.24%) Go
12 6 (3.64%) Scala
13 2 (1.21%) C#
14 1 (0.61%) Bicep
14 1 (0.61%) C
14 1 (0.61%) Rust
Qualifications
1 57 (34.55%) Security Cleared
2 25 (15.15%) DV Cleared
3 18 (10.91%) SC Cleared
4 6 (3.64%) Degree
5 2 (1.21%) AWS Certification
5 2 (1.21%) CCNA
5 2 (1.21%) Cisco Certification
5 2 (1.21%) Computer Science Degree
5 2 (1.21%) JNCIA
6 1 (0.61%) AWS Certified Developer
6 1 (0.61%) AWS Certified Solutions Architect
6 1 (0.61%) AWS Certified SysOps Administrator
6 1 (0.61%) BPSS Clearance
Quality Assurance & Compliance
1 2 (1.21%) ISO 9001
1 2 (1.21%) ISO/IEC 27001
2 1 (0.61%) ISO/IEC 20000
System Software
1 23 (13.94%) VMware Infrastructure
2 20 (12.12%) Active Directory
2 20 (12.12%) Docker
3 9 (5.45%) Hyper-V
4 8 (4.85%) Citrix Hypervisor
4 8 (4.85%) Samba
5 7 (4.24%) NFS
6 5 (3.03%) Virtual Machines
7 4 (2.42%) VMware ESXi
8 3 (1.82%) KVM
8 3 (1.82%) LXC
8 3 (1.82%) Slurm Workload Manager
9 2 (1.21%) Firmware
9 2 (1.21%) Kamailio
9 2 (1.21%) OpenSIPS
9 2 (1.21%) Postfix
9 2 (1.21%) vSphere
10 1 (0.61%) QEMU
Systems Management
1 57 (34.55%) Ansible
2 34 (20.61%) Terraform
3 30 (18.18%) Puppet
4 22 (13.33%) Kubernetes
5 9 (5.45%) Nagios
6 8 (4.85%) ZABBIX
7 7 (4.24%) Red Hat Spacewalk
8 6 (3.64%) Cobbler
9 4 (2.42%) Jamf Pro
9 4 (2.42%) McAfee ePO
9 4 (2.42%) Progress Chef
9 4 (2.42%) SCOM
9 4 (2.42%) vCenter Server
9 4 (2.42%) vRealize
10 3 (1.82%) Cacti
10 3 (1.82%) Ganglia
10 3 (1.82%) Packer
11 2 (1.21%) Grafana
11 2 (1.21%) HAProxy
11 2 (1.21%) Prometheus
Vendors
1 97 (58.79%) Red Hat
2 45 (27.27%) Microsoft
3 41 (24.85%) Oracle
4 28 (16.97%) VMware
5 11 (6.67%) ION Trading
6 10 (6.06%) Bloomberg
6 10 (6.06%) CQG
6 10 (6.06%) Patsystems
6 10 (6.06%) Reuters
6 10 (6.06%) Trayport
7 9 (5.45%) NetApp
8 7 (4.24%) Cisco
9 6 (3.64%) Fortinet
9 6 (3.64%) Google
9 6 (3.64%) Juniper
9 6 (3.64%) SaltStack
10 5 (3.03%) Meraki
11 4 (2.42%) Intel
11 4 (2.42%) McAfee
12 2 (1.21%) Dell