Puppet
UK

The table below provides summary statistics for permanent job vacancies requiring Puppet skills. It includes a benchmarking guide to the annual salaries offered in vacancies that cited Puppet over the 6 months leading up to 23 October 2024, comparing them to the same period in the previous two years.

6 months to
23 Oct 2024
Same period 2023 Same period 2022
Rank 517 342 338
Rank change year-on-year -175 -4 -90
Permanent jobs citing Puppet 274 543 1,559
As % of all permanent jobs advertised in the UK 0.36% 0.91% 1.11%
As % of the Systems Management category 3.91% 6.06% 6.65%
Number of salaries quoted 171 306 782
10th Percentile £47,500 £42,500 £48,750
25th Percentile £54,000 £51,250 £58,750
Median annual salary (50th Percentile) £72,500 £67,500 £75,000
Median % change year-on-year +7.41% -10.00% +15.38%
75th Percentile £87,500 £83,625 £95,000
90th Percentile £92,500 £95,000 £110,000
UK excluding London median annual salary £65,000 £62,500 £70,000
% change year-on-year +4.00% -10.71% +16.67%

All Systems Management Skills
UK

Puppet falls under the Systems Management category. For comparison with the information above, the following table provides summary statistics for all permanent job vacancies requiring systems management skills.

Permanent vacancies with a requirement for systems management skills 7,013 8,955 23,426
As % of all permanent jobs advertised in the UK 9.27% 15.06% 16.67%
Number of salaries quoted 3,963 6,883 12,170
10th Percentile £37,500 £35,500 £36,500
25th Percentile £48,925 £47,500 £47,500
Median annual salary (50th Percentile) £67,500 £65,000 £67,500
Median % change year-on-year +3.85% -3.70% +3.85%
75th Percentile £86,250 £84,056 £87,500
90th Percentile £102,500 £100,000 £105,000
UK excluding London median annual salary £57,500 £57,500 £55,000
% change year-on-year - +4.55% -

Puppet
Job Vacancy Trend

Job postings citing Puppet as a proportion of all IT jobs advertised.
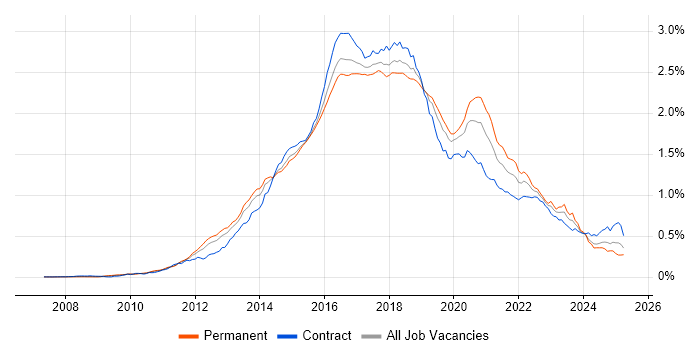
Job vacancy trend for Puppet in the UK

Puppet
Salary Trend

3-month moving average salary quoted in jobs citing Puppet.

Salary trend for Puppet in the UK

Puppet
Salary Histogram

Salary distribution for jobs citing Puppet over the 6 months to 23 October 2024.

Salary histogram for Puppet in the UK

Puppet
Top 17 Job Locations

The table below looks at the demand and provides a guide to the median salaries quoted in IT jobs citing Puppet within the UK over the 6 months to 23 October 2024. The 'Rank Change' column provides an indication of the change in demand within each location based on the same 6 month period last year.

Location Rank Change
on Same Period
Last Year
Matching
Permanent
IT Job Ads
Median Salary
Past 6 Months
Median Salary
% Change
on Same Period
Last Year
Live
Jobs
England -167 261 £72,500 +10.94% 74
UK excluding London -175 155 £65,000 +4.00% 44
London -34 113 £75,000 - 35
Work from Home -92 70 £65,000 -7.14% 178
South West -46 53 £75,000 +22.45% 13
North of England -57 43 £60,000 -7.69% 17
North West -34 28 £60,000 +17.65% 7
South East -77 22 £62,500 +35.87% 3
East of England -37 17 £56,000 -39.46% 2
Yorkshire +11 12 £53,250 -36.29% 7
Midlands -58 12 £70,000 +16.67% 4
West Midlands -47 11 £70,000 +3.70% 2
Scotland -26 6 - - 5
North East -28 3 £50,000 -13.04% 3
Wales +35 1 £93,500 +55.83% 1
Northern Ireland +22 1 - -
East Midlands -41 1 - - 2

Puppet
Co-occurring Skills and Capabilities by Category

The follow tables expand on the table above by listing co-occurrences grouped by category. The same employment type, locality and period is covered with up to 20 co-occurrences shown in each of the following categories:

Application Platforms
1 24 (8.76%) Confluence
2 16 (5.84%) Apache
3 6 (2.19%) SharePoint
4 5 (1.82%) Apache Spark
5 4 (1.46%) IIS
5 4 (1.46%) JBoss
5 4 (1.46%) Microsoft Exchange
5 4 (1.46%) nginx
5 4 (1.46%) OpenStack
6 3 (1.09%) Tomcat
7 1 (0.36%) CloudStack
7 1 (0.36%) WebSphere
Applications
1 4 (1.46%) Microsoft Excel
Cloud Services
1 166 (60.58%) AWS
2 132 (48.18%) Azure
3 58 (21.17%) GCP
4 42 (15.33%) AWS CloudFormation
5 34 (12.41%) OpenShift
6 31 (11.31%) Serverless
7 29 (10.58%) PaaS
8 26 (9.49%) Amazon EC2
9 24 (8.76%) SaaS
10 23 (8.39%) Amazon CloudWatch
11 21 (7.66%) IaaS
12 20 (7.30%) AWS Lambda
13 13 (4.74%) Azure DevOps
14 12 (4.38%) Amazon EKS
14 12 (4.38%) Datadog
15 11 (4.01%) Amazon ECS
16 10 (3.65%) GitHub
17 9 (3.28%) Microsoft 365
18 8 (2.92%) Entra ID
19 7 (2.55%) Amazon S3
Communications & Networking
1 40 (14.60%) Firewall
2 26 (9.49%) DNS
3 22 (8.03%) TCP/IP
4 20 (7.30%) DHCP
5 18 (6.57%) HTTP
5 18 (6.57%) VPN
6 14 (5.11%) VLAN
7 13 (4.74%) Remote Desktop
8 12 (4.38%) Broadband
8 12 (4.38%) SAN
9 7 (2.55%) IPv6
9 7 (2.55%) Network Security
10 6 (2.19%) MPLS
10 6 (2.19%) SSL
10 6 (2.19%) WAN
11 5 (1.82%) AMQP
11 5 (1.82%) iSCSI
11 5 (1.82%) LAN
11 5 (1.82%) Wireshark
12 4 (1.46%) VoIP
Database & Business Intelligence
1 20 (7.30%) Amazon RDS
2 13 (4.74%) NoSQL
3 12 (4.38%) MongoDB
3 12 (4.38%) Relational Database
3 12 (4.38%) SQL Server
4 10 (3.65%) PostgreSQL
5 8 (2.92%) Big Data
5 8 (2.92%) Hadoop
6 5 (1.82%) Cloudera CDH
7 2 (0.73%) Amazon Aurora
7 2 (0.73%) Amazon Redshift
7 2 (0.73%) DynamoDB
7 2 (0.73%) MySQL
8 1 (0.36%) Elasticsearch
8 1 (0.36%) Oracle Database
Development Applications
1 94 (34.31%) Jenkins
2 54 (19.71%) GitLab
3 27 (9.85%) JIRA
4 26 (9.49%) Git
5 14 (5.11%) Atlassian Bamboo
6 11 (4.01%) SonarQube
7 10 (3.65%) Maven
8 9 (3.28%) Bitbucket
8 9 (3.28%) CircleCI
8 9 (3.28%) Cucumber
9 8 (2.92%) AppScan
9 8 (2.92%) Selenium
10 7 (2.55%) Artifactory
11 6 (2.19%) TeamCity
12 4 (1.46%) Visual Studio Team System
13 3 (1.09%) GoCD
14 2 (0.73%) JUnit
14 2 (0.73%) Sonatype Nexus
15 1 (0.36%) Ant
15 1 (0.36%) Gradle
General
1 72 (26.28%) Social Skills
2 53 (19.34%) Finance
3 39 (14.23%) Banking
4 18 (6.57%) Investment Banking
5 16 (5.84%) Analytical Skills
5 16 (5.84%) Public Sector
5 16 (5.84%) Tech for Good
6 13 (4.74%) Aerospace
7 11 (4.01%) Retail
8 10 (3.65%) Telecoms
9 8 (2.92%) Games
10 6 (2.19%) Organisational Skills
11 4 (1.46%) Billing
11 4 (1.46%) Influencing Skills
12 3 (1.09%) Automotive
12 3 (1.09%) Inclusion and Diversity
13 2 (0.73%) Law
13 2 (0.73%) Presentation Skills
14 1 (0.36%) Legal
14 1 (0.36%) Manufacturing
Job Titles
1 73 (26.64%) Infrastructure Engineer
2 61 (22.26%) Senior
3 55 (20.07%) DevOps Engineer
4 41 (14.96%) Linux Engineer
5 35 (12.77%) Platform Engineer
6 32 (11.68%) Cloud Engineer
7 25 (9.12%) Senior Infrastructure Engineer
8 21 (7.66%) Automation Engineer
9 19 (6.93%) Architect
9 19 (6.93%) Linux Systems Administrator
9 19 (6.93%) Systems Administrator
10 18 (6.57%) Consultant
10 18 (6.57%) Lead
10 18 (6.57%) Senior DevOps
11 17 (6.20%) AWS Engineer
11 17 (6.20%) Cloud Automation Engineer
11 17 (6.20%) Cloud Consultant
11 17 (6.20%) Senior DevOps Engineer
12 15 (5.47%) Operations Engineer
12 15 (5.47%) Senior Linux Engineer
Libraries, Frameworks & Software Standards
1 21 (7.66%) React
2 18 (6.57%) Middleware
3 16 (5.84%) LDAP
3 16 (5.84%) RESTful
4 14 (5.11%) Node.js
5 12 (4.38%) Spring
6 11 (4.01%) JSON
7 9 (3.28%) OAuth
8 8 (2.92%) Keycloak
8 8 (2.92%) REST
8 8 (2.92%) Spring Boot
9 7 (2.55%) HTML
9 7 (2.55%) HTML5
9 7 (2.55%) RabbitMQ
10 6 (2.19%) Elastic Stack
11 5 (1.82%) AngularJS
11 5 (1.82%) gRPC
11 5 (1.82%) Material-UI
11 5 (1.82%) Swagger
11 5 (1.82%) YAML
Miscellaneous
1 28 (10.22%) Linux Command Line
2 20 (7.30%) Cloud Native
3 17 (6.20%) Hybrid Cloud
4 16 (5.84%) Public Cloud
5 15 (5.47%) Self-Motivation
6 13 (4.74%) Data Centre
7 11 (4.01%) Management Information System
8 8 (2.92%) Enterprise Cloud
8 8 (2.92%) Foreign Exchange (FX)
8 8 (2.92%) Replication
9 7 (2.55%) Private Cloud
10 6 (2.19%) Greenfield Project
10 6 (2.19%) IoT
11 4 (1.46%) Legacy Systems
11 4 (1.46%) Social Media
12 3 (1.09%) Team-Oriented Environment
13 2 (0.73%) Cyber Threat
14 1 (0.36%) Clustering
14 1 (0.36%) Distributed Systems
14 1 (0.36%) Onboarding
Operating Systems
1 196 (71.53%) Linux
2 88 (32.12%) Red Hat Enterprise Linux
3 75 (27.37%) Windows
4 25 (9.12%) CentOS
4 25 (9.12%) Ubuntu
5 22 (8.03%) Windows Server
6 12 (4.38%) Debian
7 6 (2.19%) Unix
8 3 (1.09%) Rocky
9 1 (0.36%) CoreOS
9 1 (0.36%) SUSE
9 1 (0.36%) SUSE Linux Enterprise Server
9 1 (0.36%) VMS
Processes & Methodologies
1 153 (55.84%) DevOps
2 112 (40.88%) CI/CD
3 107 (39.05%) Infrastructure as Code
4 100 (36.50%) Infrastructure Engineering
5 90 (32.85%) Agile
5 90 (32.85%) Configuration Management
6 67 (24.45%) Containerisation
7 47 (17.15%) Microservices
8 42 (15.33%) Continuous Integration
9 37 (13.50%) High Availability
10 36 (13.14%) Problem-Solving
11 33 (12.04%) Software Engineering
12 31 (11.31%) Platform Engineering
13 30 (10.95%) Mentoring
13 30 (10.95%) Migration
13 30 (10.95%) Task Automation
14 29 (10.58%) Open Source
15 24 (8.76%) Continuous Improvement
15 24 (8.76%) Kanban
16 22 (8.03%) Software Testing
Programming Languages
1 177 (64.60%) Python
2 102 (37.23%) Bash
3 83 (30.29%) PowerShell
4 67 (24.45%) Java
5 56 (20.44%) Perl
6 30 (10.95%) Ruby
7 15 (5.47%) JavaScript
8 12 (4.38%) C++
8 12 (4.38%) Korn
8 12 (4.38%) SQL
9 9 (3.28%) Go
10 8 (2.92%) C
11 6 (2.19%) Shell Script
11 6 (2.19%) TypeScript
12 4 (1.46%) Bicep
12 4 (1.46%) Groovy
12 4 (1.46%) Scala
13 2 (0.73%) AWK
14 1 (0.36%) C#
14 1 (0.36%) PHP
Qualifications
1 55 (20.07%) Security Cleared
2 38 (13.87%) DV Cleared
3 24 (8.76%) SC Cleared
4 16 (5.84%) RHCE
5 13 (4.74%) AWS Certification
5 13 (4.74%) Degree
6 11 (4.01%) Computer Science Degree
7 8 (2.92%) LPIC
8 5 (1.82%) AWS Certified DevOps Engineer
8 5 (1.82%) AWS Certified Solutions Architect
8 5 (1.82%) AWS Certified SysOps Administrator
8 5 (1.82%) Linux+ Certification
8 5 (1.82%) RHCSA
9 4 (1.46%) BPSS Clearance
9 4 (1.46%) ITIL Certification
10 2 (0.73%) MCSA
10 2 (0.73%) Microsoft Certification
10 2 (0.73%) Network+ Certification
11 1 (0.36%) Azure Certification
11 1 (0.36%) Master's Degree
Quality Assurance & Compliance
1 8 (2.92%) PCI DSS
2 6 (2.19%) ISO/IEC 27001
3 5 (1.82%) GDPR
3 5 (1.82%) HIPAA
4 4 (1.46%) ISO 9001
4 4 (1.46%) Sarbanes-Oxley
4 4 (1.46%) SLA
5 3 (1.09%) QA
6 2 (0.73%) Government Security Classifications
6 2 (0.73%) NIST
System Software
1 98 (35.77%) Docker
2 41 (14.96%) VMware Infrastructure
3 12 (4.38%) Hyper-V
3 12 (4.38%) XenApp
3 12 (4.38%) XenDesktop
4 10 (3.65%) Active Directory
4 10 (3.65%) VMware ESXi
5 6 (2.19%) Virtual Machines
5 6 (2.19%) vSphere
6 5 (1.82%) Ceph
6 5 (1.82%) Virtual Desktop
7 4 (1.46%) KVM
8 2 (0.73%) VMware NSX
9 1 (0.36%) Gluster
9 1 (0.36%) oVirt
9 1 (0.36%) VirtualBox
Systems Management
1 212 (77.37%) Ansible
2 127 (46.35%) Progress Chef
2 127 (46.35%) Terraform
3 119 (43.43%) Kubernetes
4 27 (9.85%) Prometheus
5 20 (7.30%) Grafana
5 20 (7.30%) Salt
6 18 (6.57%) ZABBIX
7 12 (4.38%) Red Hat Satellite
8 11 (4.01%) Nagios
9 9 (3.28%) Single Sign-On
10 7 (2.55%) Active Directory Federation Services
11 6 (2.19%) Argo
12 5 (1.82%) Failover Clustering
12 5 (1.82%) vCenter Server
13 4 (1.46%) Avamar
13 4 (1.46%) Cisco Prime
13 4 (1.46%) FortiGate
13 4 (1.46%) Microsoft Intune
13 4 (1.46%) N-central
Vendors
1 64 (23.36%) Red Hat
2 53 (19.34%) VMware
3 32 (11.68%) Microsoft
4 30 (10.95%) Google
5 19 (6.93%) Atlassian
6 17 (6.20%) Oracle
6 17 (6.20%) Splunk
7 16 (5.84%) Citrix
8 14 (5.11%) Cisco
9 12 (4.38%) TOWER Software
10 10 (3.65%) SaltStack
10 10 (3.65%) Veeam
10 10 (3.65%) Zerto
11 8 (2.92%) Palo Alto
12 6 (2.19%) ForgeRock
12 6 (2.19%) Zscaler
13 5 (1.82%) Sophos
14 4 (1.46%) Dell
14 4 (1.46%) IBM
14 4 (1.46%) Juniper