Finance Analyst
UK
The median Finance Analyst salary in the UK is £55,000 per year, according to job vacancies posted during the 6 months leading to 1 May 2025.
The table below provides salary benchmarking and summary statistics, comparing them to the same period in the previous two years.
| 6 months to 1 May 2025 |
Same period 2024 | Same period 2023 | |
|---|---|---|---|
| Rank | 440 | 420 | 588 |
| Rank change year-on-year | -20 | +168 | +97 |
| Permanent jobs requiring a Financial Analyst | 265 | 583 | 437 |
| As % of all permanent jobs advertised in the UK | 0.51% | 0.59% | 0.42% |
| As % of the Job Titles category | 0.57% | 0.63% | 0.46% |
| Number of salaries quoted | 143 | 304 | 255 |
| 10th Percentile | £35,000 | £32,300 | £36,250 |
| 25th Percentile | £42,500 | £43,500 | £46,250 |
| Median annual salary (50th Percentile) | £55,000 | £60,000 | £60,000 |
| Median % change year-on-year | -8.33% | - | -4.00% |
| 75th Percentile | £80,000 | £83,750 | £75,000 |
| 90th Percentile | £99,000 | £112,500 | £90,000 |
| UK excluding London median annual salary | £45,000 | £47,500 | £47,500 |
| % change year-on-year | -5.26% | - | - |
All Permanent IT Job Vacancies
UK
For comparison with the information above, the following table provides summary statistics for all permanent IT job vacancies. Most job vacancies include a discernible job title that can be normalized. As such, the figures in the second row provide an indication of the number of permanent jobs in our overall sample.
| Permanent vacancies in the UK with a recognized job title | 46,902 | 93,183 | 95,132 |
| % of permanent jobs with a recognized job title | 90.12% | 94.62% | 91.53% |
| Number of salaries quoted | 27,275 | 66,883 | 59,840 |
| 10th Percentile | £30,000 | £28,500 | £32,500 |
| 25th Percentile | £42,000 | £38,500 | £45,000 |
| Median annual salary (50th Percentile) | £57,500 | £52,777 | £60,000 |
| Median % change year-on-year | +8.95% | -12.04% | - |
| 75th Percentile | £75,000 | £71,250 | £81,250 |
| 90th Percentile | £97,500 | £90,000 | £100,000 |
| UK excluding London median annual salary | £52,000 | £50,000 | £52,500 |
| % change year-on-year | +4.00% | -4.76% | +5.00% |
Financial Analyst
Job Vacancy Trend
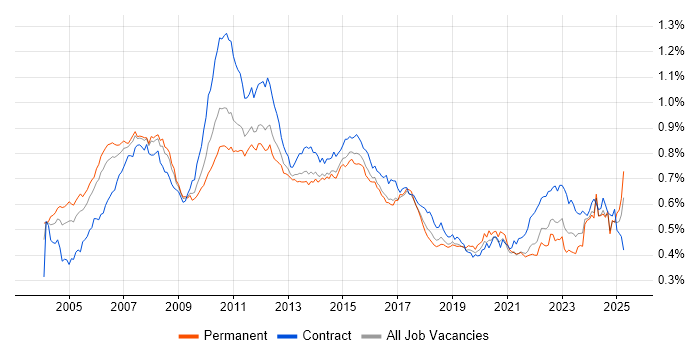
Job postings that featured Financial Analyst in the job title as a proportion of all IT jobs advertised.

Financial Analyst
Salary Trend
3-month moving average salary quoted in jobs citing Financial Analyst.
Financial Analyst
Salary Histogram
Salary distribution for jobs citing Financial Analyst over the 6 months to 1 May 2025.
Financial Analyst
Top 14 Job Locations
The table below looks at the demand and provides a guide to the median salaries quoted in IT jobs citing Financial Analyst within the UK over the 6 months to 1 May 2025. The 'Rank Change' column provides an indication of the change in demand within each location based on the same 6 month period last year.
| Location | Rank Change on Same Period Last Year |
Matching Permanent IT Job Ads |
Median Salary Past 6 Months |
Median Salary % Change on Same Period Last Year |
Live Jobs |
|---|---|---|---|---|---|
| England | -38 | 239 | £55,000 | -8.33% | 100 |
| UK excluding London | +98 | 151 | £45,000 | -5.26% | 39 |
| London | -46 | 104 | £75,000 | - | 73 |
| Work from Home | -7 | 101 | £72,500 | +20.83% | 47 |
| South East | +71 | 55 | £35,000 | -30.00% | 16 |
| North of England | +63 | 53 | £52,500 | +45.83% | 6 |
| North West | +33 | 52 | £52,500 | +31.25% | 5 |
| Scotland | +124 | 18 | - | - | 2 |
| Midlands | +65 | 14 | £45,000 | -5.26% | 9 |
| West Midlands | +45 | 14 | £45,000 | -5.26% | 5 |
| Northern Ireland | - | 5 | - | - | |
| South West | +91 | 4 | £57,500 | +15.00% | 2 |
| East of England | +45 | 2 | £65,000 | +25.60% | 4 |
| Yorkshire | +56 | 1 | - | - |
Financial Analyst Skill Set
Top 30 Co-occurring Skills and Capabilities
For the 6 months to 1 May 2025, Financial Analyst job roles required the following skills and capabilities in order of popularity. The figures indicate the absolute number co-occurrences and as a proportion of all permanent job ads featuring Financial Analyst in the job title.
|
|
Financial Analyst Skill Set
Co-occurring Skills and Capabilities by Category
The follow tables expand on the table above by listing co-occurrences grouped by category. The same employment type, locality and period is covered with up to 20 co-occurrences shown in each of the following categories:
|
|
|||||||||||||||||||||||||||||||||||||||||||||||||||||||||||||||||||||||||||||||||||||||||||||||||||||||||||||||
|
|
|||||||||||||||||||||||||||||||||||||||||||||||||||||||||||||||||||||||||||||||||||||||||||||||||||||||||||||||
|
|
|||||||||||||||||||||||||||||||||||||||||||||||||||||||||||||||||||||||||||||||||||||||||||||||||||||||||||||||
|
|
|||||||||||||||||||||||||||||||||||||||||||||||||||||||||||||||||||||||||||||||||||||||||||||||||||||||||||||||
|
|
|||||||||||||||||||||||||||||||||||||||||||||||||||||||||||||||||||||||||||||||||||||||||||||||||||||||||||||||
|
|
|||||||||||||||||||||||||||||||||||||||||||||||||||||||||||||||||||||||||||||||||||||||||||||||||||||||||||||||
|
|
|||||||||||||||||||||||||||||||||||||||||||||||||||||||||||||||||||||||||||||||||||||||||||||||||||||||||||||||
|
|
|||||||||||||||||||||||||||||||||||||||||||||||||||||||||||||||||||||||||||||||||||||||||||||||||||||||||||||||
|
|
|||||||||||||||||||||||||||||||||||||||||||||||||||||||||||||||||||||||||||||||||||||||||||||||||||||||||||||||
