Front Office Jobs

Front Office
UK

The table below looks at the prevalence of the term Front Office in permanent job vacancies. Included is a benchmarking guide to the salaries offered in vacancies that cited Front Office over the 6 months leading up to 26 October 2024, comparing them to the same period in the previous two years.

6 months to
26 Oct 2024
Same period 2023 Same period 2022
Rank 203 215 293
Rank change year-on-year +12 +78 +16
Permanent jobs citing Front Office 1,034 989 1,822
As % of all permanent jobs advertised in the UK 1.36% 1.68% 1.29%
As % of the General category 2.31% 2.55% 1.89%
Number of salaries quoted 937 926 1,592
10th Percentile £77,500 £67,500 £65,000
25th Percentile £85,000 £80,000 £80,000
Median annual salary (50th Percentile) £112,500 £107,500 £102,500
Median % change year-on-year +4.65% +4.88% +2.50%
75th Percentile £142,500 £142,500 £126,250
90th Percentile £148,750 £151,250 £142,250
UK excluding London median annual salary £85,000 £60,000 £65,000
% change year-on-year +41.67% -7.69% +30.00%

All General Skills
UK

Front Office falls under the General Skills category. For comparison with the information above, the following table provides summary statistics for all permanent job vacancies requiring common skills.

Permanent vacancies with a requirement for common skills 44,834 38,845 96,332
As % of all permanent jobs advertised in the UK 58.98% 66.16% 68.28%
Number of salaries quoted 19,835 26,844 50,848
10th Percentile £32,000 £31,250 £32,500
25th Percentile £42,500 £42,500 £44,192
Median annual salary (50th Percentile) £58,500 £60,000 £60,000
Median % change year-on-year -2.50% - +4.35%
75th Percentile £78,750 £80,000 £81,250
90th Percentile £100,000 £100,000 £100,000
UK excluding London median annual salary £50,500 £50,000 £52,500
% change year-on-year +1.00% -4.76% +10.53%

Front Office
Job Vacancy Trend

Job postings citing Front Office as a proportion of all IT jobs advertised.
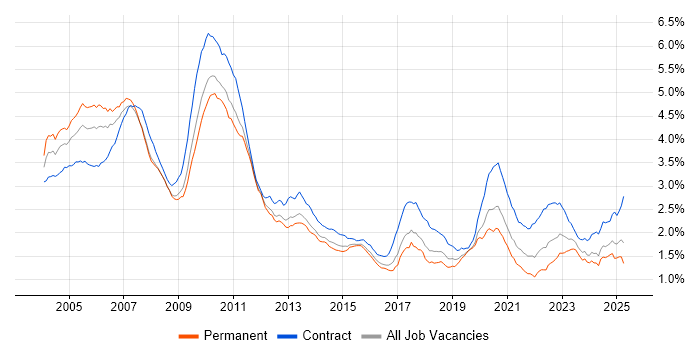
Job vacancy trend for Front Office in the UK

Front Office
Salary Trend

3-month moving average salary quoted in jobs citing Front Office.

Salary trend for Front Office in the UK

Front Office
Salary Histogram

Salary distribution for jobs citing Front Office over the 6 months to 26 October 2024.

Salary histogram for Front Office in the UK

Front Office
Top 14 Job Locations

The table below looks at the demand and provides a guide to the median salaries quoted in IT jobs citing Front Office within the UK over the 6 months to 26 October 2024. The 'Rank Change' column provides an indication of the change in demand within each location based on the same 6 month period last year.

Location Rank Change
on Same Period
Last Year
Matching
Permanent
IT Job Ads
Median Salary
Past 6 Months
Median Salary
% Change
on Same Period
Last Year
Live
Jobs
England +3 1,030 £112,500 +2.27% 109
London +9 1,002 £112,500 +2.27% 105
Work from Home +76 688 £115,000 +12.20% 43
UK excluding London -39 30 £85,000 +41.67% 4
South West +22 10 - - 1
South East -33 8 £40,000 -38.46%
North of England - 7 £92,500 - 2
North West - 5 - -
Scotland -11 2 £85,000 +36.00%
East of England -48 2 - - 1
East Midlands -23 1 - -
Midlands -39 1 - -
North East - 1 £92,500 - 2
Yorkshire - 1 - -

Front Office
Co-occurring Skills and Capabilities by Category

The follow tables expand on the table above by listing co-occurrences grouped by category. The same employment type, locality and period is covered with up to 20 co-occurrences shown in each of the following categories:

Application Platforms
1 547 (52.90%) Apache Airflow
2 525 (50.77%) Apache
3 10 (0.97%) Confluence
4 6 (0.58%) Apache Spark
5 2 (0.19%) Microsoft Exchange
5 2 (0.19%) SAS
5 2 (0.19%) SharePoint
6 1 (0.097%) Documentum
6 1 (0.097%) Jupyter
Applications
1 9 (0.87%) Microsoft Excel
2 4 (0.39%) Microsoft PowerPoint
3 1 (0.097%) Microsoft Office
Business Applications
1 53 (5.13%) Aladdin
2 5 (0.48%) Markit EDM
3 4 (0.39%) Eagle PACE
3 4 (0.39%) thinkFolio
4 2 (0.19%) Front Arena
5 1 (0.097%) Dynamics CRM
5 1 (0.097%) Endur
5 1 (0.097%) Fidessa
Cloud Services
1 754 (72.92%) AWS
2 508 (49.13%) dbt
3 392 (37.91%) Snowflake
4 370 (35.78%) GCP
5 132 (12.77%) Amazon ECS
6 113 (10.93%) Amazon EC2
7 110 (10.64%) Azure
8 93 (8.99%) Amazon EKS
9 52 (5.03%) Dagster
10 51 (4.93%) Serverless
11 49 (4.74%) AWS Lambda
12 47 (4.55%) Amazon SQS
13 40 (3.87%) Power Platform
14 30 (2.90%) Amazon S3
15 27 (2.61%) AWS Step Functions
16 20 (1.93%) AWS CloudFormation
17 11 (1.06%) SaaS
18 10 (0.97%) Figma
18 10 (0.97%) Miro
19 6 (0.58%) OpenShift
Communications & Networking
1 7 (0.68%) HTTP
2 4 (0.39%) Internet
3 3 (0.29%) FTP
4 2 (0.19%) BGP
4 2 (0.19%) Ethernet
4 2 (0.19%) Firewall
4 2 (0.19%) FIX Connectivity
4 2 (0.19%) MPLS
4 2 (0.19%) Network Security
4 2 (0.19%) TCP/IP
4 2 (0.19%) VPLS
5 1 (0.097%) Broadband
5 1 (0.097%) SSH
Database & Business Intelligence
1 502 (48.55%) Dremio
2 488 (47.20%) Apache Ignite
3 480 (46.42%) Data Lake
4 466 (45.07%) Amazon Athena
5 450 (43.52%) Apache Arrow
6 72 (6.96%) PostgreSQL
7 40 (3.87%) Power BI
8 38 (3.68%) Tableau
9 35 (3.38%) Big Data
10 33 (3.19%) NoSQL
11 24 (2.32%) MongoDB
11 24 (2.32%) SQL Server
12 22 (2.13%) Amazon Redshift
13 21 (2.03%) Amazon RDS
14 13 (1.26%) Relational Database
15 9 (0.87%) Apache Hive
16 7 (0.68%) KDB
17 5 (0.48%) Redis
18 4 (0.39%) Hadoop
19 3 (0.29%) Hazelcast
Development Applications
1 23 (2.22%) Jenkins
2 22 (2.13%) Cypress.io
3 18 (1.74%) JIRA
4 16 (1.55%) Git
5 13 (1.26%) Gradle
6 10 (0.97%) MSTest
7 6 (0.58%) Artifactory
8 5 (0.48%) TeamCity
9 3 (0.29%) Ant
9 3 (0.29%) Babel
9 3 (0.29%) webpack
10 2 (0.19%) Cucumber
10 2 (0.19%) JUnit
10 2 (0.19%) Maven
11 1 (0.097%) GitLab
11 1 (0.097%) Mockito
11 1 (0.097%) Rational Performance Tester
11 1 (0.097%) SpecFlow
General
1 892 (86.27%) Finance
2 671 (64.89%) Banking
3 527 (50.97%) Investment Banking
4 79 (7.64%) Social Skills
5 36 (3.48%) Analytical Skills
6 16 (1.55%) Inclusion and Diversity
6 16 (1.55%) Law
7 15 (1.45%) Back Office
8 12 (1.16%) Publishing
9 6 (0.58%) Legal
10 4 (0.39%) Financial Institution
10 4 (0.39%) Marketing
11 3 (0.29%) Agriculture
11 3 (0.29%) Retail
12 2 (0.19%) Dutch Language
12 2 (0.19%) International Banking
12 2 (0.19%) Organisational Skills
13 1 (0.097%) Documentation Skills
Job Titles
1 430 (41.59%) Software Engineer
2 385 (37.23%) Developer
3 334 (32.30%) Python Engineer
4 265 (25.63%) AWS Engineer
5 263 (25.44%) Senior
6 259 (25.05%) Python Software Engineer
7 244 (23.60%) AWS Software Engineer
8 230 (22.24%) Developer/Software Engineer
9 194 (18.76%) Java Engineer
10 190 (18.38%) Java Software Engineer
11 171 (16.54%) Senior Software Engineer
12 153 (14.80%) Analyst
12 153 (14.80%) Lead
13 136 (13.15%) Python Developer
14 133 (12.86%) Senior Java Engineer
15 129 (12.48%) Senior Java Software Engineer
16 106 (10.25%) React Developer
17 93 (8.99%) Java Developer
18 88 (8.51%) Business Analyst
19 87 (8.41%) AWS Developer
Libraries, Frameworks & Software Standards
1 490 (47.39%) gRPC
2 489 (47.29%) Pandas
3 488 (47.20%) Protocol Buffers
4 486 (47.00%) NumPy
5 480 (46.42%) SciPy
6 173 (16.73%) React
7 144 (13.93%) PySpark
8 136 (13.15%) Redux
9 119 (11.51%) Node.js
10 74 (7.16%) AngularJS
11 40 (3.87%) .NET
12 38 (3.68%) Vue
13 33 (3.19%) Material-UI
14 25 (2.42%) FIX Protocol
14 25 (2.42%) REST
15 22 (2.13%) CSS
15 22 (2.13%) HTML
16 20 (1.93%) Lambda Expressions
17 16 (1.55%) Kafka
18 12 (1.16%) .NET Core
Miscellaneous
1 708 (68.47%) Fixed Income
2 611 (59.09%) Hedge funds
3 576 (55.71%) Equities
4 550 (53.19%) Foreign Exchange (FX)
5 547 (52.90%) Derivative
6 127 (12.28%) Product Ownership
7 99 (9.57%) Pricing Data
8 24 (2.32%) Distributed Systems
9 22 (2.13%) Algorithms
10 16 (1.55%) Greenfield Project
11 14 (1.35%) Legacy Applications
12 13 (1.26%) Onboarding
13 12 (1.16%) Data Structures
14 9 (0.87%) Cloud Native
15 8 (0.77%) Self-Motivation
16 7 (0.68%) Blog
16 7 (0.68%) Data Protection Act
16 7 (0.68%) N-Tier
16 7 (0.68%) Private Cloud
17 6 (0.58%) Tandem
Operating Systems
1 58 (5.61%) Linux
2 20 (1.93%) Unix
3 14 (1.35%) Windows
4 7 (0.68%) Apple iOS
5 4 (0.39%) Android
6 3 (0.29%) Windows Server
7 1 (0.097%) Windows 10
Processes & Methodologies
1 800 (77.37%) Agile
2 772 (74.66%) Asset Management
3 671 (64.89%) Software Engineering
4 574 (55.51%) Investment Management
5 244 (23.60%) Fintech
6 206 (19.92%) Analytics
7 141 (13.64%) Line Management
8 131 (12.67%) Full-Stack Development
9 119 (11.51%) Greeks
10 104 (10.06%) Migration
11 95 (9.19%) Machine Learning
11 95 (9.19%) User Experience
12 92 (8.90%) Roadmaps
13 89 (8.61%) Artificial Intelligence
14 80 (7.74%) Performance Attribution
15 75 (7.25%) Business Analysis
16 67 (6.48%) DevOps
17 62 (6.00%) CI/CD
18 58 (5.61%) Data Engineering
19 57 (5.51%) Portfolio Management
Programming Languages
1 847 (81.91%) Python
2 571 (55.22%) TypeScript
3 570 (55.13%) Java
4 567 (54.84%) JavaScript
5 359 (34.72%) SQL
6 67 (6.48%) C#
7 23 (2.22%) C++
8 15 (1.45%) Scala
9 12 (1.16%) Kotlin
10 9 (0.87%) Shell Script
11 8 (0.77%) Go
12 7 (0.68%) Groovy
12 7 (0.68%) PowerShell
13 5 (0.48%) Haskell
13 5 (0.48%) R
14 4 (0.39%) F#
15 3 (0.29%) Clojure
15 3 (0.29%) Rust
16 2 (0.19%) Perl
16 2 (0.19%) VBA
Qualifications
1 61 (5.90%) Degree
2 17 (1.64%) Computer Science Degree
3 16 (1.55%) Master's Degree
4 10 (0.97%) Numerate Degree
5 3 (0.29%) CBAP
6 2 (0.19%) CCNA
6 2 (0.19%) Cisco Certification
6 2 (0.19%) ITIL Certification
6 2 (0.19%) SC Cleared
6 2 (0.19%) Security Cleared
7 1 (0.097%) AWS Certification
7 1 (0.097%) IIBA
7 1 (0.097%) ISEB
7 1 (0.097%) ITIL Foundation Certificate
7 1 (0.097%) PhD
Quality Assurance & Compliance
1 163 (15.76%) Data Quality
2 8 (0.77%) MiFID
2 8 (0.77%) QA
3 6 (0.58%) Accessibility
4 5 (0.48%) EMIR
5 1 (0.097%) Actionable Recommendations
5 1 (0.097%) COSHH
5 1 (0.097%) NEBOSH
System Software
1 42 (4.06%) Docker
2 3 (0.29%) Active Directory
2 3 (0.29%) VMware Infrastructure
Systems Management
1 38 (3.68%) Kubernetes
2 23 (2.22%) Terraform
3 3 (0.29%) Cisco CUCM
3 3 (0.29%) Microsoft Intune
4 2 (0.19%) Argo
4 2 (0.19%) Packer
4 2 (0.19%) SCCM
5 1 (0.097%) Ansible
5 1 (0.097%) Control-M
5 1 (0.097%) MOM
Vendors
1 161 (15.57%) Bloomberg
2 67 (6.48%) Reuters
3 48 (4.64%) BISAM
4 30 (2.90%) Google
5 10 (0.97%) Microsoft
5 10 (0.97%) Murex
6 7 (0.68%) Oracle
7 6 (0.58%) Cisco
8 5 (0.48%) Charles River
9 4 (0.39%) Sophis
10 3 (0.29%) Apple
10 3 (0.29%) Citrix
10 3 (0.29%) Solace
10 3 (0.29%) VMware
11 2 (0.19%) MicroStrategy
11 2 (0.19%) Nokia
11 2 (0.19%) ServiceNow
11 2 (0.19%) StreamBase
11 2 (0.19%) Tradeweb
12 1 (0.097%) Pega