Configuration Management Jobs

Configuration Management
UK

The following table provides summary statistics for permanent job vacancies with a requirement for Configuration Management skills. Included is a benchmarking guide to the salaries offered in vacancies that have cited Configuration Management over the 6 months to 5 December 2023 with a comparison to the same period in the previous 2 years.

6 months to
5 Dec 2023
Same period 2022 Same period 2021
Rank 205 203 204
Rank change year-on-year -2 +1 -61
Permanent jobs citing Configuration Management 928 2,352 2,422
As % of all permanent jobs advertised in the UK 1.74% 1.89% 1.90%
As % of the Processes & Methodologies category 1.85% 1.98% 1.99%
Number of salaries quoted 581 1,345 1,606
10th Percentile £36,250 £39,000 £43,750
25th Percentile £47,500 £48,750 £53,750
Median annual salary (50th Percentile) £62,400 £65,000 £65,000
Median % change year-on-year -4.00% - +8.33%
75th Percentile £80,000 £87,500 £82,500
90th Percentile £90,000 £100,000 £95,000
UK excluding London median annual salary £53,760 £55,000 £60,000
% change year-on-year -2.25% -8.33% +14.29%

All Process and Methodology Skills
UK

Configuration Management is in the Processes and Methodologies category. The following table is for comparison with the above and provides summary statistics for all permanent job vacancies with a requirement for process or methodology skills.

Permanent vacancies with a requirement for process or methodology skills 50,261 118,879 121,556
As % of all permanent jobs advertised in the UK 94.08% 95.74% 95.44%
Number of salaries quoted 36,398 72,456 81,203
10th Percentile £32,500 £34,500 £32,500
25th Percentile £43,750 £45,000 £42,500
Median annual salary (50th Percentile) £60,000 £60,000 £60,000
Median % change year-on-year - - +9.09%
75th Percentile £80,000 £82,500 £77,500
90th Percentile £100,000 £100,000 £95,000
UK excluding London median annual salary £52,500 £53,500 £50,000
% change year-on-year -1.87% +7.00% +4.17%

Configuration Management
Job Vacancy Trend

Job postings citing Configuration Management as a proportion of all IT jobs advertised.
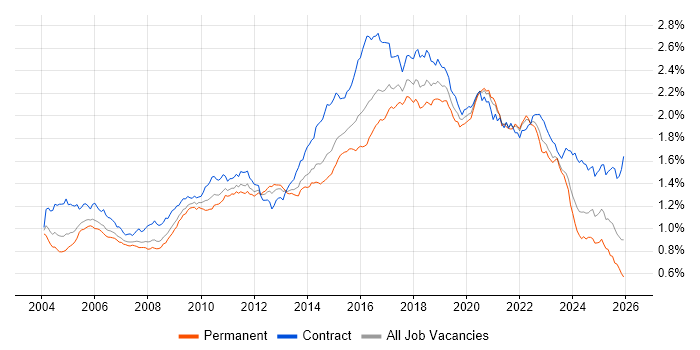
Job vacancy trend for Configuration Management in the UK

Configuration Management
Salary Trend

3-month moving average salary quoted in jobs citing Configuration Management.

Salary trend for Configuration Management in the UK

Configuration Management
Salary Histogram

Salary distribution for jobs citing Configuration Management over the 6 months to 5 December 2023.

Salary histogram for Configuration Management in the UK

Configuration Management
Top 17 Job Locations

The table below looks at the demand and provides a guide to the median salaries quoted in IT jobs citing Configuration Management within the UK over the 6 months to 5 December 2023. The 'Rank Change' column provides an indication of the change in demand within each location based on the same 6 month period last year.

Location Rank Change
on Same Period
Last Year
Matching
Permanent
IT Job Ads
Median Salary
Past 6 Months
Median Salary
% Change
on Same Period
Last Year
Live
Jobs
England -5 809 £62,500 -3.85% 364
UK excluding London +1 559 £53,760 -2.25% 273
Work from Home +38 439 £65,000 -7.14% 287
London -31 287 £75,000 -6.25% 124
South East +15 170 £53,760 -2.25% 76
North of England +41 136 £60,750 +10.45% 53
South West +52 124 £56,000 +1.82% 62
Yorkshire +133 72 £62,500 +8.70% 17
North West +19 61 £50,500 -8.18% 29
Midlands +15 61 £57,500 -11.54% 20
East Midlands +33 35 £57,500 -17.86% 9
Scotland +1 31 £56,250 +32.35% 32
West Midlands +15 26 £57,500 -9.80% 11
East of England +68 16 £53,500 -17.69% 36
Wales +24 16 £48,675 -11.50% 7
Northern Ireland +39 13 £50,000 -23.08% 1
North East +4 3 £50,000 -14.53% 7

Configuration Management
Co-occurring Skills and Capabilities by Category

The follow tables expand on the table above by listing co-occurrences grouped by category. The same employment type, locality and period is covered with up to 20 co-occurrences shown in each of the following categories:

Application Platforms
1 43 (4.63%) SharePoint
2 26 (2.80%) IIS
3 24 (2.59%) Confluence
4 13 (1.40%) Apache
5 8 (0.86%) CMS
6 6 (0.65%) nginx
7 5 (0.54%) Apache Spark
8 4 (0.43%) Tomcat
9 3 (0.32%) Drupal
9 3 (0.32%) OpenStack
9 3 (0.32%) SAS
10 2 (0.22%) JBoss
10 2 (0.22%) WinCC
11 1 (0.11%) Apache Airflow
11 1 (0.11%) Apache Solr
11 1 (0.11%) Apache TomEE
11 1 (0.11%) MS Exchange
11 1 (0.11%) NetWeaver
11 1 (0.11%) Oracle Application Server
11 1 (0.11%) WordPress
Applications
1 37 (3.99%) Microsoft Office
2 5 (0.54%) Microsoft Excel
2 5 (0.54%) Microsoft PowerPoint
2 5 (0.54%) OrCAD
3 3 (0.32%) MS Visio
4 2 (0.22%) Microsoft Project
5 1 (0.11%) CANalyzer
5 1 (0.11%) CATIA
5 1 (0.11%) Simulink
5 1 (0.11%) SOLIDWORKS
Business Applications
1 3 (0.32%) Sparx Enterprise Architect
2 2 (0.22%) Oracle Procure-to-Pay
2 2 (0.22%) Remedy ITSM
3 1 (0.11%) Distributed Ledger
3 1 (0.11%) ENOVIA
3 1 (0.11%) Oracle EBS
3 1 (0.11%) Quorum
3 1 (0.11%) SAP Business One
3 1 (0.11%) SAP IS-U
3 1 (0.11%) Teamcenter
Cloud Services
1 357 (38.47%) AWS
2 273 (29.42%) Azure
3 193 (20.80%) Serverless
4 161 (17.35%) GCP
5 157 (16.92%) OpenShift
6 79 (8.51%) Azure DevOps
7 78 (8.41%) AWS CloudFormation
8 55 (5.93%) Microsoft 365
9 54 (5.82%) Azure Monitor
10 46 (4.96%) Amazon EC2
11 44 (4.74%) AWS Lambda
12 37 (3.99%) IaaS
13 35 (3.77%) Virtual Private Cloud
14 33 (3.56%) GitHub
15 32 (3.45%) PaaS
16 30 (3.23%) Amazon CloudWatch
17 29 (3.13%) Azure AKS
17 29 (3.13%) Datadog
18 27 (2.91%) Amazon S3
19 26 (2.80%) AWS CodeBuild
Communications & Networking
1 71 (7.65%) DNS
2 65 (7.00%) Firewall
3 46 (4.96%) VPN
4 42 (4.53%) DHCP
5 40 (4.31%) TCP/IP
6 35 (3.77%) IPv4
7 27 (2.91%) VLAN
7 27 (2.91%) WAN
8 25 (2.69%) SNMP
9 23 (2.48%) OSPF
10 22 (2.37%) Network Security
11 21 (2.26%) 5G
11 21 (2.26%) Intranet
12 18 (1.94%) SD-WAN
13 16 (1.72%) Internet
14 13 (1.40%) HTTP
14 13 (1.40%) SAN
15 11 (1.19%) LAN
15 11 (1.19%) SSL
16 10 (1.08%) Software-Defined Radio
Database & Business Intelligence
1 42 (4.53%) SQL Server
2 32 (3.45%) Amazon RDS
3 28 (3.02%) DynamoDB
4 25 (2.69%) Amazon Redshift
5 20 (2.16%) Power BI
6 18 (1.94%) Big Data
6 18 (1.94%) NoSQL
7 15 (1.62%) PostgreSQL
8 14 (1.51%) Amazon Athena
9 12 (1.29%) MySQL
10 10 (1.08%) Data Lake
10 10 (1.08%) MongoDB
11 9 (0.97%) Elasticsearch
11 9 (0.97%) Hadoop
11 9 (0.97%) Oracle Database
12 8 (0.86%) Apache Accumulo
12 8 (0.86%) Apache Cassandra
12 8 (0.86%) Relational Database
13 7 (0.75%) Azure SQL Database
14 6 (0.65%) BigQuery
Development Applications
1 185 (19.94%) Jenkins
2 119 (12.82%) Git
3 54 (5.82%) GitLab
4 53 (5.71%) JIRA
5 39 (4.20%) Bitbucket
5 39 (4.20%) CircleCI
6 23 (2.48%) Subversion
7 22 (2.37%) TeamCity
7 22 (2.37%) Visual Studio
8 19 (2.05%) Atlassian Bamboo
9 16 (1.72%) Octopus Deploy
9 16 (1.72%) Selenium
10 15 (1.62%) Maven
10 15 (1.62%) Sonatype Nexus
11 14 (1.51%) Rational DOORS
11 14 (1.51%) Team Foundation Server
12 12 (1.29%) git-flow
13 11 (1.19%) Artifactory
14 10 (1.08%) Cucumber
14 10 (1.08%) Travis CI
General
1 201 (21.66%) Social Skills
2 139 (14.98%) Finance
3 77 (8.30%) Analytical Skills
4 43 (4.63%) Banking
5 40 (4.31%) Aerospace
6 39 (4.20%) Public Sector
7 34 (3.66%) Retail
8 33 (3.56%) Manufacturing
9 29 (3.13%) Inclusion and Diversity
10 27 (2.91%) Presentation Skills
11 26 (2.80%) Telecoms
12 24 (2.59%) Military
13 22 (2.37%) Electronics
14 20 (2.16%) Organisational Skills
15 13 (1.40%) Law
15 13 (1.40%) Marketing
16 10 (1.08%) Legal
16 10 (1.08%) Publishing
17 7 (0.75%) Financial Institution
18 6 (0.65%) Pharmaceutical
Job Titles
1 208 (22.41%) Senior
2 190 (20.47%) DevOps Engineer
3 120 (12.93%) Software Engineer
4 101 (10.88%) Senior Software Engineer
5 82 (8.84%) Analyst
6 73 (7.87%) DV Cleared Software Engineer
7 63 (6.79%) Architect
8 62 (6.68%) Senior DevOps
9 61 (6.57%) Senior DevOps Engineer
10 57 (6.14%) Systems Engineer
11 53 (5.71%) Infrastructure Engineer
12 49 (5.28%) Azure Engineer
13 45 (4.85%) Solutions Architect
14 44 (4.74%) Cloud Engineer
14 44 (4.74%) Lead
15 37 (3.99%) Linux Engineer
16 34 (3.66%) AWS Engineer
17 33 (3.56%) Consultant
17 33 (3.56%) Platform Engineer
18 32 (3.45%) Administrator
Libraries, Frameworks & Software Standards
1 50 (5.39%) .NET
2 49 (5.28%) Elastic Stack
3 39 (4.20%) YAML
4 26 (2.80%) ARM Templates
5 21 (2.26%) .NET Framework
5 21 (2.26%) Kafka
6 20 (2.16%) JSON
7 19 (2.05%) React
8 16 (1.72%) Spring
9 14 (1.51%) SAML
10 13 (1.40%) CSS
10 13 (1.40%) HTML
10 13 (1.40%) XML
11 12 (1.29%) LDAP
12 11 (1.19%) AngularJS
12 11 (1.19%) OAuth
12 11 (1.19%) Spring Boot
13 10 (1.08%) ASP.NET MVC
13 10 (1.08%) Entity Framework
13 10 (1.08%) RabbitMQ
Miscellaneous
1 83 (8.94%) CMDB
1 83 (8.94%) Hybrid Cloud
2 60 (6.47%) Public Cloud
3 36 (3.88%) Data Centre
4 35 (3.77%) Management Information System
5 31 (3.34%) Onboarding
5 31 (3.34%) Self-Motivation
6 30 (3.23%) Private Cloud
7 28 (3.02%) Linux Command Line
8 26 (2.80%) Cloud Native
9 24 (2.59%) Distributed Systems
10 21 (2.26%) Enterprise Software
11 14 (1.51%) Mobile App
12 12 (1.29%) Embedded Systems
13 11 (1.19%) Blog
14 10 (1.08%) Enterprise Cloud
14 10 (1.08%) PKI
14 10 (1.08%) Virtual Team
15 9 (0.97%) FPGA
15 9 (0.97%) VHDL
Operating Systems
1 423 (45.58%) Linux
2 201 (21.66%) Windows
3 80 (8.62%) Unix
4 54 (5.82%) Windows Server
5 39 (4.20%) Ubuntu
6 33 (3.56%) Red Hat Enterprise Linux
7 29 (3.13%) Debian
8 17 (1.83%) VMS
9 16 (1.72%) CentOS
10 14 (1.51%) Solaris
11 12 (1.29%) Windows 10
12 10 (1.08%) Android
13 7 (0.75%) Mac OS
14 5 (0.54%) Apple iOS
15 3 (0.32%) Windows Server 2012
16 1 (0.11%) Embedded Linux
16 1 (0.11%) Rocky
16 1 (0.11%) Windows 7
16 1 (0.11%) Windows Server 2016
16 1 (0.11%) Windows Server 2019
Processes & Methodologies
1 391 (42.13%) DevOps
2 378 (40.73%) CI/CD
3 266 (28.66%) Agile
4 227 (24.46%) Infrastructure as Code
5 188 (20.26%) Software Engineering
6 180 (19.40%) Containerisation
7 156 (16.81%) Microservices
8 139 (14.98%) Problem-Solving
9 136 (14.66%) ITIL
10 118 (12.72%) Design Patterns
11 113 (12.18%) Collaborative Culture
12 102 (10.99%) Loose Coupling
13 84 (9.05%) Actionable Insight
14 82 (8.84%) Task Automation
15 81 (8.73%) DevSecOps
15 81 (8.73%) Service Management
16 80 (8.62%) Project Management
17 79 (8.51%) Continuous Integration
18 75 (8.08%) Computer Science
18 75 (8.08%) Mentoring
Programming Languages
1 430 (46.34%) Python
2 250 (26.94%) Bash
3 225 (24.25%) Java
4 166 (17.89%) PowerShell
5 113 (12.18%) SQL
6 56 (6.03%) Ruby
7 48 (5.17%) C#
7 48 (5.17%) Go
8 47 (5.06%) C++
9 44 (4.74%) JavaScript
10 41 (4.42%) Perl
10 41 (4.42%) Shell Script
11 26 (2.80%) C
12 24 (2.59%) Groovy
13 22 (2.37%) Bicep
14 18 (1.94%) TypeScript
15 7 (0.75%) Ada
16 6 (0.65%) MATLAB
16 6 (0.65%) PHP
17 4 (0.43%) PL/SQL
Qualifications
1 281 (30.28%) Security Cleared
2 128 (13.79%) SC Cleared
3 127 (13.69%) Degree
4 126 (13.58%) DV Cleared
5 40 (4.31%) AWS Certification
6 31 (3.34%) Computer Science Degree
7 25 (2.69%) ITIL Certification
8 23 (2.48%) Microsoft Certification
9 19 (2.05%) Azure Certification
10 18 (1.94%) Master's Degree
11 16 (1.72%) HND
12 15 (1.62%) BPSS Clearance
13 14 (1.51%) AWS Certified DevOps Engineer
14 13 (1.40%) AWS Certified SysOps Administrator
15 11 (1.19%) RHCE
16 10 (1.08%) Chartered Engineer
16 10 (1.08%) GIAC
17 9 (0.97%) Cisco Certification
18 8 (0.86%) HNC
19 6 (0.65%) CISM
Quality Assurance & Compliance
1 21 (2.26%) PMO
2 17 (1.83%) QA
3 14 (1.51%) SLA
4 13 (1.40%) ISO/IEC 27001
5 7 (0.75%) NCSC
6 6 (0.65%) DO-178B
6 6 (0.65%) GDPR
7 5 (0.54%) HMG Security Policy Framework
7 5 (0.54%) IEC 61508
7 5 (0.54%) JSP 440
7 5 (0.54%) RMADS
8 4 (0.43%) Cyber Essentials
8 4 (0.43%) Data Quality
9 3 (0.32%) ISO 26262
10 2 (0.22%) COBIT
10 2 (0.22%) ISO 9001
10 2 (0.22%) ISO/IEC 15288
10 2 (0.22%) PCI DSS
11 1 (0.11%) HAZOP
11 1 (0.11%) IEC 62304
System Software
1 297 (32.00%) Docker
2 79 (8.51%) Active Directory
3 48 (5.17%) VMware Infrastructure
4 42 (4.53%) Virtual Machines
5 14 (1.51%) Firmware
6 10 (1.08%) DFS Replication
7 8 (0.86%) Hyper-V
8 7 (0.75%) KVM
9 6 (0.65%) Ceph
9 6 (0.65%) Varnish
10 5 (0.54%) VMware ESXi
11 4 (0.43%) Oracle RAC
11 4 (0.43%) Slurm Workload Manager
11 4 (0.43%) vSphere
12 3 (0.32%) Shibboleth
12 3 (0.32%) Virtual Desktop
13 2 (0.22%) Embedded Firmware
13 2 (0.22%) Veritas Cluster Server
13 2 (0.22%) Virtual Servers
14 1 (0.11%) VMware NSX
Systems Management
1 258 (27.80%) Kubernetes
2 253 (27.26%) Terraform
3 250 (26.94%) Ansible
4 160 (17.24%) Puppet
5 93 (10.02%) Progress Chef
6 65 (7.00%) Grafana
7 61 (6.57%) Prometheus
8 29 (3.13%) SCOM
9 19 (2.05%) Packer
10 18 (1.94%) Microsoft Intune
11 16 (1.72%) Nagios
11 16 (1.72%) Salt
11 16 (1.72%) SCCM
12 15 (1.62%) Argo
13 11 (1.19%) Istio
13 11 (1.19%) Single Sign-On
14 9 (0.97%) Active Directory Federation Services
15 7 (0.75%) Jamf Pro
15 7 (0.75%) ZABBIX
16 6 (0.65%) Kibana
Vendors
1 167 (18.00%) Microsoft
2 70 (7.54%) ServiceNow
2 70 (7.54%) VMware
3 52 (5.60%) Splunk
4 41 (4.42%) Red Hat
5 39 (4.20%) Oracle
6 28 (3.02%) Dynatrace
7 25 (2.69%) Remedy
8 21 (2.26%) Google
8 21 (2.26%) New Relic
8 21 (2.26%) SaltStack
9 20 (2.16%) Atlassian
10 18 (1.94%) Cisco
11 12 (1.29%) Citrix
12 10 (1.08%) SolarWinds
13 9 (0.97%) EMC
14 8 (0.86%) Snow
15 7 (0.75%) BMC
15 7 (0.75%) Cadence
15 7 (0.75%) SAP