Bash Shell
UK

The table below provides summary statistics for permanent job vacancies requiring Bash skills. It includes a benchmarking guide to the annual salaries offered in vacancies that cited Bash over the 6 months leading up to 12 July 2025, comparing them to the same period in the previous two years.

6 months to
12 Jul 2025
Same period 2024 Same period 2023
Rank 179 222 144
Rank change year-on-year +43 -78 +29
Permanent jobs citing Bash 1,059 1,311 2,103
As % of all permanent jobs advertised in the UK 1.76% 1.27% 2.45%
As % of the Programming Languages category 6.29% 4.02% 6.00%
Number of salaries quoted 419 800 1,252
10th Percentile £44,815 £41,250 £42,874
25th Percentile £52,500 £47,500 £52,500
Median annual salary (50th Percentile) £67,500 £60,000 £70,000
Median % change year-on-year +12.50% -14.29% -
75th Percentile £85,000 £80,000 £87,500
90th Percentile £98,474 £92,500 £112,500
UK excluding London median annual salary £62,000 £57,500 £61,180
% change year-on-year +7.83% -6.01% +5.09%

All Programming Languages
UK

Bash falls under the Programming Languages category. For comparison with the information above, the following table provides summary statistics for all permanent job vacancies requiring coding skills.

Permanent vacancies with a requirement for coding skills 16,841 32,617 35,021
As % of all permanent jobs advertised in the UK 28.03% 31.50% 40.78%
Number of salaries quoted 10,777 23,870 25,423
10th Percentile £36,250 £35,000 £38,750
25th Percentile £47,683 £45,000 £48,750
Median annual salary (50th Percentile) £60,000 £60,000 £65,000
Median % change year-on-year - -7.69% +4.00%
75th Percentile £82,500 £78,750 £85,000
90th Percentile £107,500 £100,000 £107,500
UK excluding London median annual salary £55,000 £55,000 £55,000
% change year-on-year - - +4.76%

Bash
Job Vacancy Trend

Job postings citing Bash as a proportion of all IT jobs advertised.
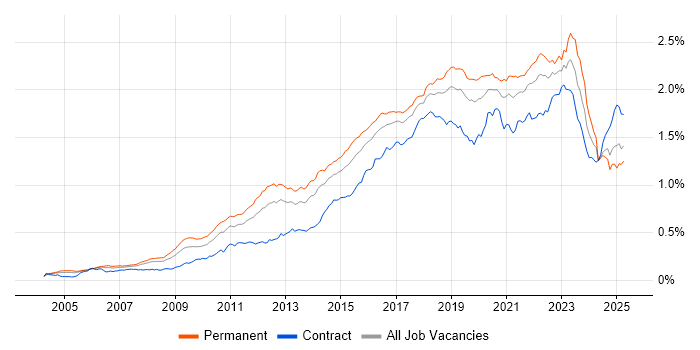
Job vacancy trend for Bash in the UK

Bash
Salary Trend

3-month moving average salary quoted in jobs citing Bash.

Salary trend for Bash in the UK

Bash
Salary Histogram

Salary distribution for jobs citing Bash over the 6 months to 12 July 2025.

Salary histogram for Bash in the UK

Bash
Top 17 Job Locations

The table below looks at the demand and provides a guide to the median salaries quoted in IT jobs citing Bash within the UK over the 6 months to 12 July 2025. The 'Rank Change' column provides an indication of the change in demand within each location based on the same 6 month period last year.

Location Rank Change
on Same Period
Last Year
Matching
Permanent
IT Job Ads
Median Salary
Past 6 Months
Median Salary
% Change
on Same Period
Last Year
Live
Jobs
England +38 1,029 £68,750 +10.00% 475
Work from Home +68 666 £70,000 +12.00% 395
UK excluding London +50 642 £62,000 +7.83% 359
North of England +172 313 £62,500 +12.61% 71
London -2 304 £80,000 +6.67% 161
North West +157 288 £60,000 - 34
South East -13 143 £68,750 +25.00% 97
East of England +45 83 £62,000 +3.33% 67
Midlands +82 54 £57,435 -4.28% 43
South West -48 42 £57,443 +4.44% 48
East Midlands +46 28 £57,500 +15.00% 15
West Midlands +69 25 £55,000 -15.38% 24
Yorkshire +32 20 £63,750 +29.38% 30
Scotland +59 12 £80,000 +33.33% 26
North East +28 5 £47,500 -3.60% 7
Wales +28 2 £57,500 +27.78% 10
Northern Ireland +29 1 £55,000 -21.43% 18

Bash
Co-occurring Skills and Capabilities by Category

The follow tables expand on the table above by listing co-occurrences grouped by category. The same employment type, locality and period is covered with up to 20 co-occurrences shown in each of the following categories:

Application Platforms
1 28 (2.64%) Microsoft Exchange
2 16 (1.51%) Apache Spark
3 12 (1.13%) Apache Airflow
4 10 (0.94%) Confluence
4 10 (0.94%) nginx
4 10 (0.94%) SharePoint
5 5 (0.47%) Apache
5 5 (0.47%) IIS
6 4 (0.38%) Traefik
7 3 (0.28%) SAS
7 3 (0.28%) Tomcat
8 2 (0.19%) CICS
8 2 (0.19%) JBoss
8 2 (0.19%) Oracle SOA Suite
8 2 (0.19%) WebSphere
9 1 (0.094%) CMS
9 1 (0.094%) Office Communications Server
Applications
1 25 (2.36%) Microsoft Excel
2 15 (1.42%) Chatbot
3 10 (0.94%) Microsoft Office
4 1 (0.094%) AutoCAD
4 1 (0.094%) Autodesk Inventor
4 1 (0.094%) SOLIDWORKS
4 1 (0.094%) Weka
Business Applications
1 5 (0.47%) Fidessa
2 2 (0.19%) Refinitiv Enterprise Platform
Cloud Services
1 446 (42.12%) AWS
2 226 (21.34%) Pulumi
3 222 (20.96%) Azure
4 91 (8.59%) GCP
5 54 (5.10%) GitHub
6 50 (4.72%) AWS CloudFormation
7 45 (4.25%) Azure DevOps
8 39 (3.68%) Serverless
9 38 (3.59%) SaaS
10 32 (3.02%) Amazon CloudWatch
10 32 (3.02%) Microsoft 365
11 31 (2.93%) IaaS
12 30 (2.83%) GitHub Actions
13 26 (2.46%) AWS Lambda
14 25 (2.36%) Amazon EKS
15 24 (2.27%) Amazon EC2
16 23 (2.17%) PaaS
17 21 (1.98%) Azure Monitor
18 20 (1.89%) Amazon S3
19 17 (1.61%) Virtual Private Cloud
Communications & Networking
1 370 (34.94%) VPN
2 262 (24.74%) Cisco IOS
3 219 (20.68%) Broadband
4 98 (9.25%) Firewall
5 97 (9.16%) TCP/IP
6 35 (3.31%) DNS
7 21 (1.98%) Network Security
8 17 (1.61%) DHCP
9 16 (1.51%) OSPF
10 15 (1.42%) BGP
11 13 (1.23%) MPLS
11 13 (1.23%) SAN
11 13 (1.23%) VLAN
12 12 (1.13%) LAN
12 12 (1.13%) Multicast
12 12 (1.13%) WAN
13 10 (0.94%) HTTP
13 10 (0.94%) Internet
13 10 (0.94%) iSCSI
14 8 (0.76%) Intrusion Detection
Database & Business Intelligence
1 246 (23.23%) Relational Database
2 231 (21.81%) NoSQL
3 218 (20.59%) RDBMS
4 38 (3.59%) SQL Server
5 32 (3.02%) MySQL
6 31 (2.93%) PostgreSQL
7 22 (2.08%) Amazon RDS
8 18 (1.70%) Data Warehouse
9 14 (1.32%) Big Data
9 14 (1.32%) Power BI
10 11 (1.04%) SQL Server Integration Services
10 11 (1.04%) SQL Server Reporting Services
11 7 (0.66%) Elasticsearch
12 6 (0.57%) Amazon Athena
12 6 (0.57%) Amazon Redshift
12 6 (0.57%) BigQuery
13 5 (0.47%) Metadata
14 4 (0.38%) Amazon Aurora
14 4 (0.38%) Apache Hive
14 4 (0.38%) SQLite
Development Applications
1 216 (20.40%) Jaeger
2 82 (7.74%) Git
3 69 (6.52%) Jenkins
4 65 (6.14%) Cucumber
5 64 (6.04%) Robot Framework
6 56 (5.29%) GitLab
7 29 (2.74%) JIRA
8 15 (1.42%) CircleCI
9 9 (0.85%) Artifactory
9 9 (0.85%) Sonatype Nexus
10 8 (0.76%) Bitbucket
11 7 (0.66%) Burp Suite
11 7 (0.66%) Metasploit
12 5 (0.47%) TeamCity
12 5 (0.47%) WiX
13 4 (0.38%) Visual Studio
14 3 (0.28%) CMake
14 3 (0.28%) JUnit
14 3 (0.28%) Maven
14 3 (0.28%) TestRail
General
1 556 (52.50%) Inclusion and Diversity
2 302 (28.52%) Analytical Skills
3 218 (20.59%) Social Skills
4 146 (13.79%) Finance
5 87 (8.22%) Telecoms
6 75 (7.08%) Banking
7 18 (1.70%) Documentation Skills
8 14 (1.32%) Organisational Skills
9 12 (1.13%) Public Sector
10 10 (0.94%) Manufacturing
11 8 (0.76%) Retail
12 7 (0.66%) Financial Institution
12 7 (0.66%) Law
12 7 (0.66%) Marketing
12 7 (0.66%) Presentation Skills
13 6 (0.57%) Advertising
13 6 (0.57%) Back Office
14 5 (0.47%) Electronics
14 5 (0.47%) Investment Banking
15 4 (0.38%) Spanish Language
Job Titles
1 281 (26.53%) Infrastructure Engineer
2 273 (25.78%) Lead
3 216 (20.40%) Team Leader
4 90 (8.50%) DevOps Engineer
5 86 (8.12%) Senior
6 66 (6.23%) Test Engineer
7 64 (6.04%) Test Automation Engineer
8 51 (4.82%) Platform Engineer
9 48 (4.53%) Administrator
10 44 (4.15%) Linux Engineer
11 43 (4.06%) Systems Administrator
12 39 (3.68%) Analyst
12 39 (3.68%) Linux Administrator
13 36 (3.40%) Linux Systems Administrator
14 35 (3.31%) Azure Engineer
15 31 (2.93%) Cloud Engineer
16 29 (2.74%) Site Reliability Engineer
16 29 (2.74%) Support Engineer
17 27 (2.55%) Linux Support
17 27 (2.55%) Software Engineer
Libraries, Frameworks & Software Standards
1 508 (47.97%) Elastic Stack
2 217 (20.49%) OpenTelemetry
3 25 (2.36%) .NET
4 24 (2.27%) FIX Protocol
5 19 (1.79%) LDAP
6 16 (1.51%) Kafka
7 15 (1.42%) ARM Templates
7 15 (1.42%) REST
8 14 (1.32%) RESTful
9 12 (1.13%) YAML
10 11 (1.04%) Loki
10 11 (1.04%) Pandas
11 9 (0.85%) Node.js
11 9 (0.85%) SOAP
12 8 (0.76%) Jinja
12 8 (0.76%) Middleware
12 8 (0.76%) React
13 7 (0.66%) .NET Framework
13 7 (0.66%) AWS CDK
14 6 (0.57%) HTML
Miscellaneous
1 265 (25.02%) Cyberattack
2 97 (9.16%) Linux Command Line
3 47 (4.44%) Cloud Native
4 26 (2.46%) Hybrid Cloud
5 25 (2.36%) Management Information System
6 22 (2.08%) Data Centre
7 20 (1.89%) Public Cloud
8 16 (1.51%) Security Posture
9 15 (1.42%) Onboarding
10 11 (1.04%) Equities
11 10 (0.94%) Security Operations Centre
11 10 (0.94%) Self-Motivation
12 9 (0.85%) Cyber Threat
12 9 (0.85%) Fixed Income
13 8 (0.76%) Private Cloud
14 7 (0.66%) Client/Server
14 7 (0.66%) Enterprise Cloud
14 7 (0.66%) Hedge funds
14 7 (0.66%) IoT
14 7 (0.66%) Reference Data
Operating Systems
1 806 (76.11%) Linux
2 424 (40.04%) Windows
3 264 (24.93%) Unix
4 262 (24.74%) Android
5 52 (4.91%) Red Hat Enterprise Linux
6 29 (2.74%) Mac OS
7 26 (2.46%) Windows Server
8 24 (2.27%) CentOS
9 19 (1.79%) Ubuntu
10 12 (1.13%) Debian
10 12 (1.13%) Rocky
11 9 (0.85%) SUSE Linux Enterprise Server
12 8 (0.76%) Windows Server 2019
13 6 (0.57%) VMS
14 5 (0.47%) Solaris
14 5 (0.47%) SUSE
15 4 (0.38%) Windows 10
16 3 (0.28%) Kali Linux
17 2 (0.19%) CoreOS
17 2 (0.19%) Windows Server 2016
Processes & Methodologies
1 768 (72.52%) DevOps
2 507 (47.88%) Task Automation
3 445 (42.02%) Problem-Solving
4 368 (34.75%) Infrastructure as Code
5 350 (33.05%) Mentoring
6 338 (31.92%) Platform Engineering
7 329 (31.07%) Containerisation
8 292 (27.57%) Agile
9 290 (27.38%) Infrastructure Engineering
10 278 (26.25%) High Availability
11 269 (25.40%) Line Management
12 268 (25.31%) Mathematics
13 266 (25.12%) Risk Management
14 265 (25.02%) Storage Management
15 238 (22.47%) Continuous Integration
16 231 (21.81%) Cost Optimisation
17 229 (21.62%) Roadmaps
18 226 (21.34%) Resource Management
19 223 (21.06%) Performance Optimisation
20 222 (20.96%) GitOps
Programming Languages
1 974 (91.97%) Python
2 544 (51.37%) PowerShell
3 301 (28.42%) JavaScript
4 265 (25.02%) Java
5 249 (23.51%) Go
6 100 (9.44%) SQL
7 42 (3.97%) Perl
8 29 (2.74%) C++
9 28 (2.64%) C#
10 25 (2.36%) Bicep
10 25 (2.36%) Shell Script
11 17 (1.61%) TypeScript
12 13 (1.23%) C
13 11 (1.04%) Data Analysis Expressions
14 10 (0.94%) Korn
14 10 (0.94%) Ruby
15 9 (0.85%) R
16 8 (0.76%) Kusto Query Language
17 5 (0.47%) Fortran
17 5 (0.47%) PHP
Qualifications
1 241 (22.76%) AWS Certification
2 147 (13.88%) Degree
3 56 (5.29%) Security Cleared
4 35 (3.31%) SC Cleared
5 28 (2.64%) DV Cleared
6 26 (2.46%) Computer Science Degree
7 24 (2.27%) Azure Certification
8 16 (1.51%) Microsoft Certification
9 15 (1.42%) Cisco Certification
10 13 (1.23%) CCNA
10 13 (1.23%) CCNP
10 13 (1.23%) OSCP
11 10 (0.94%) CEH
11 10 (0.94%) CompTIA Security+
12 9 (0.85%) CISSP
13 8 (0.76%) CISM
13 8 (0.76%) Master's Degree
13 8 (0.76%) RHCSA
14 7 (0.66%) RHCE
15 5 (0.47%) PhD
Quality Assurance & Compliance
1 84 (7.93%) QA
2 44 (4.15%) GDPR
3 40 (3.78%) ISO/IEC 27001
4 29 (2.74%) NIST
5 13 (1.23%) HIPAA
6 11 (1.04%) Sarbanes-Oxley
7 10 (0.94%) PCI DSS
8 9 (0.85%) Data Quality
9 8 (0.76%) COBIT
10 5 (0.47%) GRC
11 4 (0.38%) SLA
11 4 (0.38%) SOC 2
12 3 (0.28%) Accessibility
12 3 (0.28%) Cyber Essentials
13 2 (0.19%) Actionable Recommendations
13 2 (0.19%) JTAG
14 1 (0.094%) NCSC
System Software
1 605 (57.13%) Docker
2 272 (25.68%) Hyper-V
3 266 (25.12%) vSphere
4 262 (24.74%) VMware NSX
5 50 (4.72%) Active Directory
6 47 (4.44%) VMware Infrastructure
7 16 (1.51%) VMware ESXi
8 11 (1.04%) Virtual Machines
9 8 (0.76%) Citrix Hypervisor
9 8 (0.76%) NFS
10 6 (0.57%) Postfix
11 5 (0.47%) Firmware
11 5 (0.47%) zsh
12 4 (0.38%) Dovecot
13 3 (0.28%) Apache Flume
13 3 (0.28%) GPFS
13 3 (0.28%) HDFS
13 3 (0.28%) KVM
13 3 (0.28%) Lustre
14 2 (0.19%) Virtual Desktop
Systems Management
1 645 (60.91%) Terraform
2 608 (57.41%) Ansible
3 370 (34.94%) Kubernetes
4 273 (25.78%) Prometheus
5 224 (21.15%) Argo
6 216 (20.40%) Kustomize
7 80 (7.55%) Grafana
8 28 (2.64%) Nagios
9 26 (2.46%) Microsoft Intune
9 26 (2.46%) Puppet
10 17 (1.61%) Progress Chef
10 17 (1.61%) Red Hat Satellite
11 15 (1.42%) QRadar
12 13 (1.23%) Kibana
13 8 (0.76%) HAProxy
13 8 (0.76%) SCCM
14 7 (0.66%) Nmap
15 6 (0.57%) Proxmox
16 5 (0.47%) logstash
16 5 (0.47%) Packer
Vendors
1 308 (29.08%) Splunk
2 271 (25.59%) Cisco
3 263 (24.83%) Juniper
4 262 (24.74%) 3PAR
5 232 (21.91%) Google
6 122 (11.52%) Microsoft
7 70 (6.61%) Red Hat
8 66 (6.23%) VMware
9 25 (2.36%) SolarWinds
10 21 (1.98%) Atlassian
11 17 (1.61%) Apple
11 17 (1.61%) Oracle
12 16 (1.51%) SAP
13 11 (1.04%) Databricks
14 9 (0.85%) Dell
14 9 (0.85%) Palo Alto
15 8 (0.76%) Hitachi
15 8 (0.76%) IBM
15 8 (0.76%) ServiceNow
16 7 (0.66%) F5