Data Protection Act Jobs

Data Protection Act (DPA)
UK

The table below looks at the prevalence of the term Data Protection Act in permanent job vacancies. Included is a benchmarking guide to the salaries offered in vacancies that cited Data Protection Act over the 6 months leading up to 30 April 2025, comparing them to the same period in the previous two years.

6 months to
30 Apr 2025
Same period 2024 Same period 2023
Rank 471 647 485
Rank change year-on-year +176 -162 +118
Permanent jobs citing Data Protection Act 217 241 623
As % of all permanent jobs advertised in the UK 0.42% 0.25% 0.60%
As % of the Miscellaneous category 1.20% 0.69% 1.37%
Number of salaries quoted 132 180 281
10th Percentile £25,480 £27,750 £36,000
25th Percentile £45,750 £37,199 £45,000
Median annual salary (50th Percentile) £60,000 £48,750 £55,000
Median % change year-on-year +23.08% -11.36% -
75th Percentile £85,625 £72,433 £70,000
90th Percentile £106,250 £87,500 £95,000
UK excluding London median annual salary £52,500 £44,345 £52,500
% change year-on-year +18.39% -15.53% +5.00%

All Generic Skills
UK

Data Protection Act falls under the General and Transferable Skills category. For comparison with the information above, the following table provides summary statistics for all permanent job vacancies requiring generic IT skills.

Permanent vacancies with a requirement for generic IT skills 18,032 35,027 45,319
As % of all permanent jobs advertised in the UK 34.57% 35.62% 43.58%
Number of salaries quoted 9,839 23,030 23,975
10th Percentile £31,500 £28,000 £35,271
25th Percentile £42,500 £38,000 £46,350
Median annual salary (50th Percentile) £60,000 £55,000 £65,000
Median % change year-on-year +9.09% -15.38% +4.00%
75th Percentile £80,000 £75,000 £86,250
90th Percentile £110,000 £97,500 £107,500
UK excluding London median annual salary £55,000 £50,000 £55,000
% change year-on-year +10.00% -9.09% +4.76%

Data Protection Act
Job Vacancy Trend

Job postings citing Data Protection Act as a proportion of all IT jobs advertised.
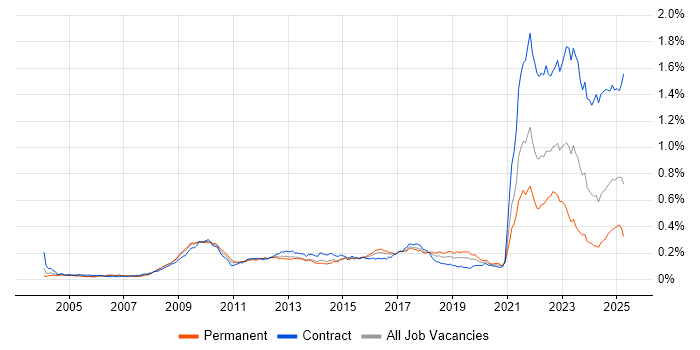
Job vacancy trend for Data Protection Act in the UK

Data Protection Act
Salary Trend

3-month moving average salary quoted in jobs citing Data Protection Act.

Salary trend for Data Protection Act in the UK

Data Protection Act
Salary Histogram

Salary distribution for jobs citing Data Protection Act over the 6 months to 30 April 2025.

Salary histogram for Data Protection Act in the UK

Data Protection Act
Top 15 Job Locations

The table below looks at the demand and provides a guide to the median salaries quoted in IT jobs citing Data Protection Act within the UK over the 6 months to 30 April 2025. The 'Rank Change' column provides an indication of the change in demand within each location based on the same 6 month period last year.

Location Rank Change
on Same Period
Last Year
Matching
Permanent
IT Job Ads
Median Salary
Past 6 Months
Median Salary
% Change
on Same Period
Last Year
Live
Jobs
England +162 208 £60,000 +20.00% 60
UK excluding London +182 125 £52,500 +18.39% 39
London +95 81 £90,000 +24.14% 20
Work from Home +189 63 £62,500 +16.28% 25
North of England +93 51 £36,000 -28.00% 12
North West +58 44 £29,000 -14.71% 6
Midlands +61 34 £50,000 -13.04% 3
West Midlands +56 33 £50,000 -13.04% 2
South East +112 29 £80,384 +163.55% 15
Yorkshire +58 7 £60,000 +20.00% 6
East of England +58 4 £60,000 -14.29% 3
Scotland +128 3 £54,000 +103.77% 3
South West +90 3 £80,000 +77.78% 4
East Midlands +44 1 £28,500 -19.72% 1
Wales +40 1 £55,000 +27.71%

Data Protection Act
Co-occurring Skills and Capabilities by Category

The follow tables expand on the table above by listing co-occurrences grouped by category. The same employment type, locality and period is covered with up to 20 co-occurrences shown in each of the following categories:

Application Platforms
1 6 (2.76%) SharePoint
2 5 (2.30%) Microsoft Exchange
3 2 (0.92%) GemFire
4 1 (0.46%) Apache
4 1 (0.46%) Apache Spark
4 1 (0.46%) Jetty
4 1 (0.46%) OpenStack
4 1 (0.46%) Oracle Workflow
4 1 (0.46%) SAS
4 1 (0.46%) Tomcat
4 1 (0.46%) WordPress
Applications
1 25 (11.52%) Microsoft Excel
2 17 (7.83%) Microsoft Office
3 9 (4.15%) Acrobat
4 1 (0.46%) Sketch
Business Applications
1 6 (2.76%) Oracle EBS
2 5 (2.30%) Dynamics CRM
3 4 (1.84%) Oracle Applications
4 1 (0.46%) Endur
4 1 (0.46%) ION Anvil
4 1 (0.46%) ION MarketView
4 1 (0.46%) Oracle Assets
4 1 (0.46%) Oracle EBS R12
4 1 (0.46%) Oracle Financials
4 1 (0.46%) Oracle General Ledger
4 1 (0.46%) Oracle Internet Expenses
4 1 (0.46%) Oracle iProcurement
4 1 (0.46%) Oracle Payables
4 1 (0.46%) Oracle Procure-to-Pay
4 1 (0.46%) Oracle Receivables
4 1 (0.46%) Raiser’s Edge
Cloud Services
1 46 (21.20%) Azure
2 44 (20.28%) Microsoft 365
3 23 (10.60%) AWS
4 10 (4.61%) GCP
4 10 (4.61%) Power Platform
5 9 (4.15%) Google Workspace
5 9 (4.15%) SaaS
6 7 (3.23%) Azure AI
6 7 (3.23%) Azure DevOps
7 6 (2.76%) Azure AKS
8 5 (2.30%) Dynamics 365
8 5 (2.30%) Entra ID
9 2 (0.92%) Amazon EKS
9 2 (0.92%) Azure Synapse Analytics
9 2 (0.92%) GitHub
9 2 (0.92%) Microsoft Copilot
9 2 (0.92%) OCI
10 1 (0.46%) ChatGPT
10 1 (0.46%) Copilot Studio
10 1 (0.46%) MailChimp
Communications & Networking
1 9 (4.15%) Intranet
2 6 (2.76%) Firewall
3 4 (1.84%) Network Security
4 3 (1.38%) LAN
4 3 (1.38%) VLAN
4 3 (1.38%) VPN
4 3 (1.38%) WAN
4 3 (1.38%) Wi-Fi
5 2 (0.92%) DNS
5 2 (0.92%) Remote Desktop
5 2 (0.92%) Unified Communications
6 1 (0.46%) DHCP
6 1 (0.46%) Internet
6 1 (0.46%) Intrusion Detection
6 1 (0.46%) IPv4
6 1 (0.46%) IPv6
6 1 (0.46%) OpenVPN
6 1 (0.46%) SAN
6 1 (0.46%) SSH
Database & Business Intelligence
1 10 (4.61%) Power BI
2 5 (2.30%) SQL Server
3 3 (1.38%) Azure SQL Database
3 3 (1.38%) MongoDB
3 3 (1.38%) Oracle Database
3 3 (1.38%) Oracle Exadata
3 3 (1.38%) Oracle Reports
3 3 (1.38%) Tableau
4 2 (0.92%) Data Lake
4 2 (0.92%) MySQL
4 2 (0.92%) PostgreSQL
5 1 (0.46%) Apache Hive
5 1 (0.46%) Data Mining
5 1 (0.46%) Data Warehouse
5 1 (0.46%) DTS
5 1 (0.46%) Hadoop
5 1 (0.46%) QlikView
5 1 (0.46%) Redis
5 1 (0.46%) SQL Server Analysis Services
5 1 (0.46%) SQL Server Integration Services
Development Applications
1 9 (4.15%) JIRA
2 2 (0.92%) Cypress.io
2 2 (0.92%) Jenkins
2 2 (0.92%) Sonatype Nexus
3 1 (0.46%) Artifactory
3 1 (0.46%) Bitbucket
3 1 (0.46%) Git
3 1 (0.46%) Jaeger
3 1 (0.46%) JUnit
3 1 (0.46%) Oracle Forms
3 1 (0.46%) Postman
3 1 (0.46%) Selenium
3 1 (0.46%) TeamCity
General
1 95 (43.78%) Social Skills
2 43 (19.82%) Finance
3 31 (14.29%) Legal
4 28 (12.90%) Analytical Skills
5 24 (11.06%) Law
6 18 (8.29%) Retail
7 13 (5.99%) Front Office
8 9 (4.15%) Publishing
9 8 (3.69%) Presentation Skills
10 7 (3.23%) Marketing
11 6 (2.76%) Banking
12 5 (2.30%) Inclusion and Diversity
12 5 (2.30%) Organisational Skills
13 4 (1.84%) Back Office
13 4 (1.84%) Documentation Skills
14 3 (1.38%) Social Housing
15 2 (0.92%) Automotive
15 2 (0.92%) Influencing Skills
15 2 (0.92%) Public Sector
16 1 (0.46%) Advertising
Job Titles
1 37 (17.05%) Senior
2 28 (12.90%) Analyst
3 21 (9.68%) Administrator
3 21 (9.68%) Lead
4 20 (9.22%) Information Manager
5 17 (7.83%) Developer
6 16 (7.37%) IT Administrator
7 14 (6.45%) Governance Manager
7 14 (6.45%) Information Governance Manager
8 12 (5.53%) Architect
8 12 (5.53%) Information Security Manager
8 12 (5.53%) Security Manager
9 11 (5.07%) Support Analyst
10 10 (4.61%) Applications Support
11 9 (4.15%) Compliance Advisor
11 9 (4.15%) Consultant
11 9 (4.15%) Security Advisor
11 9 (4.15%) Senior Developer
11 9 (4.15%) Senior Manager
12 8 (3.69%) Project Manager
Libraries, Frameworks & Software Standards
1 12 (5.53%) Node.js
1 12 (5.53%) React
2 10 (4.61%) Middleware
3 8 (3.69%) .NET
3 8 (3.69%) Kafka
4 6 (2.76%) Oracle Fusion
5 4 (1.84%) Ruby on Rails
6 3 (1.38%) Elastic Stack
6 3 (1.38%) Oracle GoldenGate
7 2 (0.92%) RabbitMQ
7 2 (0.92%) Spring
7 2 (0.92%) Spring Boot
7 2 (0.92%) XML
8 1 (0.46%) JSON
8 1 (0.46%) JSON-LD
8 1 (0.46%) Memcached
8 1 (0.46%) TAPI
8 1 (0.46%) TensorFlow
8 1 (0.46%) Vue
8 1 (0.46%) XSLT
Miscellaneous
1 34 (15.67%) Management Information System
2 23 (10.60%) Social Media
3 17 (7.83%) Freedom of Information Act
4 16 (7.37%) Freedom of Information
5 14 (6.45%) Product Ownership
6 13 (5.99%) Cyber Threat
7 9 (4.15%) e-Learning
8 8 (3.69%) Data Centre
8 8 (3.69%) Derivative
9 7 (3.23%) Self-Motivation
10 5 (2.30%) Legacy Systems
11 4 (1.84%) Cyberattack
11 4 (1.84%) Foreign Exchange (FX)
12 3 (1.38%) Learning Management System
13 2 (0.92%) Algorithms
13 2 (0.92%) Analytical Mindset
13 2 (0.92%) Cloud Native
13 2 (0.92%) Driving Licence
13 2 (0.92%) Renewable Energy
13 2 (0.92%) Video\Live Streaming
Operating Systems
1 30 (13.82%) Windows
2 14 (6.45%) Linux
3 8 (3.69%) Windows Server
4 7 (3.23%) Windows Vista
5 6 (2.76%) Unix
5 6 (2.76%) Windows 10
6 1 (0.46%) Android
6 1 (0.46%) Ubuntu
6 1 (0.46%) Windows Server 2012
6 1 (0.46%) Windows Server 2016
Processes & Methodologies
1 217 (100.00%) Data Protection
2 55 (25.35%) Information Security
3 44 (20.28%) Continuous Improvement
4 43 (19.82%) Problem-Solving
5 38 (17.51%) Agile
5 38 (17.51%) Cybersecurity
6 29 (13.36%) Customer Service
6 29 (13.36%) Stakeholder Management
7 25 (11.52%) Incident Management
8 21 (9.68%) Roadmaps
9 20 (9.22%) DevOps
9 20 (9.22%) Impact Assessments
9 20 (9.22%) Line Management
9 20 (9.22%) Process Improvement
10 19 (8.76%) Risk Management
11 18 (8.29%) Project Management
12 17 (7.83%) Business Continuity
12 17 (7.83%) Information Security Management
12 17 (7.83%) Security Management
13 16 (7.37%) Asset Management
Programming Languages
1 46 (21.20%) SQL
2 21 (9.68%) Python
3 12 (5.53%) C#
4 10 (4.61%) Java
4 10 (4.61%) PowerShell
5 9 (4.15%) JavaScript
6 5 (2.30%) TypeScript
7 4 (1.84%) PL/SQL
7 4 (1.84%) Ruby
8 3 (1.38%) C++
9 2 (0.92%) Go
9 2 (0.92%) Scala
9 2 (0.92%) Shell Script
10 1 (0.46%) Bash
10 1 (0.46%) Groovy
10 1 (0.46%) SHACL
10 1 (0.46%) SPARQL
Qualifications
1 31 (14.29%) Degree
2 25 (11.52%) DBS Check
3 20 (9.22%) CISM
3 20 (9.22%) CISSP
4 13 (5.99%) CISA
5 9 (4.15%) ISO 27001 Lead Implementer
6 8 (3.69%) CRISC
7 6 (2.76%) PMI Certification
7 6 (2.76%) PMP
7 6 (2.76%) PRINCE2 Certification
8 4 (1.84%) Computer Science Degree
8 4 (1.84%) ISEB
9 3 (1.38%) Azure Certification
9 3 (1.38%) BPSS Clearance
9 3 (1.38%) CCNA
9 3 (1.38%) Cisco Certification
9 3 (1.38%) Microsoft Certification
9 3 (1.38%) SC Cleared
9 3 (1.38%) Security Cleared
10 2 (0.92%) GIAC
Quality Assurance & Compliance
1 51 (23.50%) ISO/IEC 27001
2 46 (21.20%) Cyber Essentials
3 44 (20.28%) GDPR
4 18 (8.29%) Cyber Essentials PLUS
5 16 (7.37%) SLA
6 11 (5.07%) ISO/IEC 27002 (supersedes ISO/IEC 17799)
6 11 (5.07%) PCI DSS
7 9 (4.15%) HIPAA
7 9 (4.15%) PERC
8 8 (3.69%) Data Quality
8 8 (3.69%) NIST
9 4 (1.84%) QA
10 3 (1.38%) Accessibility
11 2 (0.92%) COBIT
11 2 (0.92%) NCSC
11 2 (0.92%) PMO
11 2 (0.92%) SOC 2
12 1 (0.46%) DICOM
12 1 (0.46%) HL7
12 1 (0.46%) ISO/IEC 27005
System Software
1 32 (14.75%) Active Directory
2 10 (4.61%) VMware Infrastructure
3 7 (3.23%) Docker
4 3 (1.38%) vSphere
5 1 (0.46%) Hyper-V
5 1 (0.46%) Virtual Machines
Systems Management
1 13 (5.99%) Kubernetes
2 8 (3.69%) Terraform
3 4 (1.84%) Ansible
3 4 (1.84%) Prometheus
4 3 (1.38%) Grafana
4 3 (1.38%) Oracle RMAN
5 2 (0.92%) ITRS Geneos
5 2 (0.92%) Nagios
6 1 (0.46%) Argo
6 1 (0.46%) Control-M
6 1 (0.46%) Karpenter
6 1 (0.46%) Puppet
6 1 (0.46%) SCCM
Vendors
1 63 (29.03%) Microsoft
2 14 (6.45%) VMware
3 12 (5.53%) Google
4 11 (5.07%) Oracle
5 9 (4.15%) Adobe
5 9 (4.15%) OneTrust
6 8 (3.69%) Cisco
6 8 (3.69%) Citrix
7 4 (1.84%) Splunk
8 3 (1.38%) Salesforce
9 2 (0.92%) SolarWinds
9 2 (0.92%) TIBCO
10 1 (0.46%) Facebook
10 1 (0.46%) FXall
10 1 (0.46%) Instagram
10 1 (0.46%) ION Trading
10 1 (0.46%) Refinitiv
10 1 (0.46%) SaltStack
10 1 (0.46%) ServiceNow
10 1 (0.46%) Verint