Release Management
UK

The following table provides summary statistics for permanent job vacancies with a requirement for Release Management skills. Included is a benchmarking guide to the salaries offered in vacancies that have cited Release Management over the 6 months to 28 November 2023 with a comparison to the same period in the previous 2 years.

6 months to
28 Nov 2023
Same period 2022 Same period 2021
Rank 321 355 392
Rank change year-on-year +34 +37 +46
Permanent jobs citing Release Management 509 1,222 1,078
As % of all permanent jobs advertised in the UK 0.94% 0.97% 0.84%
As % of the Processes & Methodologies category 1.00% 1.02% 0.88%
Number of salaries quoted 368 741 759
10th Percentile £42,500 £39,750 £41,250
25th Percentile £52,500 £50,000 £47,500
Median annual salary (50th Percentile) £62,500 £62,500 £64,000
Median % change year-on-year - -2.34% +11.30%
75th Percentile £74,250 £81,250 £78,750
90th Percentile £85,000 £105,000 £93,750
UK excluding London median annual salary £57,500 £55,000 £52,500
% change year-on-year +4.55% +4.76% +12.19%

All Process and Methodology Skills
UK

Release Management is in the Processes and Methodologies category. The following table is for comparison with the above and provides summary statistics for all permanent job vacancies with a requirement for process or methodology skills.

Permanent vacancies with a requirement for process or methodology skills 51,121 120,104 122,523
As % of all permanent jobs advertised in the UK 94.09% 95.72% 95.43%
Number of salaries quoted 36,956 73,203 81,032
10th Percentile £32,500 £34,313 £32,500
25th Percentile £43,750 £45,000 £42,500
Median annual salary (50th Percentile) £60,000 £60,000 £59,000
Median % change year-on-year - +1.69% +7.27%
75th Percentile £80,000 £81,250 £77,500
90th Percentile £98,750 £100,000 £95,000
UK excluding London median annual salary £52,500 £53,000 £50,000
% change year-on-year -0.94% +6.00% +4.17%

Release Management
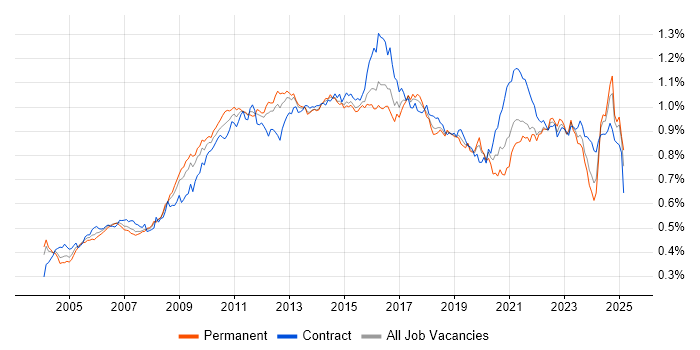
Job Vacancy Trend

Job postings citing Release Management as a proportion of all IT jobs advertised.

Job vacancy trend for Release Management in the UK

Release Management
Salary Trend

3-month moving average salary quoted in jobs citing Release Management.

Salary trend for Release Management in the UK

Release Management
Salary Histogram

Salary distribution for jobs citing Release Management over the 6 months to 28 November 2023.

Salary histogram for Release Management in the UK

Release Management
Top 16 Job Locations

The table below looks at the demand and provides a guide to the median salaries quoted in IT jobs citing Release Management within the UK over the 6 months to 28 November 2023. The 'Rank Change' column provides an indication of the change in demand within each location based on the same 6 month period last year.

Location Rank Change
on Same Period
Last Year
Matching
Permanent
IT Job Ads
Median Salary
Past 6 Months
Median Salary
% Change
on Same Period
Last Year
Live
Jobs
England +39 442 £62,500 -2.14% 154
UK excluding London +44 298 £57,500 +4.55% 90
Work from Home +49 234 £62,500 +2.46% 70
London +34 185 £65,000 -10.53% 71
South East +135 117 £56,525 +2.77% 28
North of England +73 80 £56,250 -0.44% 23
Yorkshire +79 56 £50,000 -20.00% 8
Scotland +38 36 £65,000 +9.20% 3
Midlands +10 32 £47,500 -5.00% 18
West Midlands +3 28 £47,017 -5.97% 16
North West +77 19 £65,000 +18.18% 14
South West +43 17 £60,000 +4.35% 11
East of England +102 11 £38,500 -30.00% 7
North East +31 5 £46,000 -16.36% 1
Wales -18 5 £35,000 -41.67% 2
East Midlands +35 4 £81,000 +24.62% 2

Release Management
Co-occurring Skills and Capabilities by Category

The follow tables expand on the table above by listing co-occurrences grouped by category. The same employment type, locality and period is covered with up to 20 co-occurrences shown in each of the following categories:

Application Platforms
1 16 (3.14%) Confluence
1 16 (3.14%) SharePoint
2 12 (2.36%) IIS
3 8 (1.57%) Oracle Service Bus
3 8 (1.57%) WebLogic
4 7 (1.38%) nginx
5 2 (0.39%) Drupal
5 2 (0.39%) MS Exchange
6 1 (0.20%) Cloud Foundry
6 1 (0.20%) MQSeries
6 1 (0.20%) Mule
Applications
1 47 (9.23%) Microsoft Office
2 19 (3.73%) Microsoft Excel
3 9 (1.77%) MS Visio
4 3 (0.59%) Microsoft PowerPoint
5 2 (0.39%) Microsoft Project
6 1 (0.20%) Oracle Smart View
Business Applications
1 54 (10.61%) Dynamics CRM
2 33 (6.48%) PlanetPress Connect
3 9 (1.77%) Remedy ITSM
4 8 (1.57%) Unit4 Business World
5 4 (0.79%) SAP Oil and Gas
6 2 (0.39%) FLEXCUBE
6 2 (0.39%) NetSuite
7 1 (0.20%) IBM Planning Analytics
7 1 (0.20%) Oracle ERP
7 1 (0.20%) ReMetrica
Cloud Services
1 172 (33.79%) Azure
2 97 (19.06%) Azure DevOps
3 53 (10.41%) Microsoft 365
4 41 (8.06%) Power Platform
5 37 (7.27%) AWS
6 33 (6.48%) Azure Monitor
7 32 (6.29%) PaaS
8 31 (6.09%) Azure Storage
8 31 (6.09%) Dynamics 365
9 29 (5.70%) Entra ID
10 26 (5.11%) Serverless
11 23 (4.52%) Azure Functions
12 20 (3.93%) GitHub
13 18 (3.54%) SaaS
14 17 (3.34%) PowerApps
15 16 (3.14%) Power Automate
16 15 (2.95%) IaaS
17 13 (2.55%) GCP
18 11 (2.16%) Azure Logic Apps
18 11 (2.16%) Cloud Computing
Communications & Networking
1 36 (7.07%) Firewall
2 29 (5.70%) DNS
3 25 (4.91%) DHCP
4 6 (1.18%) VPN
5 5 (0.98%) TCP/IP
6 4 (0.79%) LAN
6 4 (0.79%) Telnet
6 4 (0.79%) WAN
7 3 (0.59%) Network Security
7 3 (0.59%) SAN
8 2 (0.39%) Wireless
9 1 (0.20%) DKIM
9 1 (0.20%) DMARC
9 1 (0.20%) Ethernet
9 1 (0.20%) HTTP
9 1 (0.20%) HTTPS
9 1 (0.20%) NetScaler
9 1 (0.20%) PCoIP
9 1 (0.20%) SSH
Database & Business Intelligence
1 87 (17.09%) SQL Server
2 42 (8.25%) Data Warehouse
3 30 (5.89%) Power BI
3 30 (5.89%) Relational Database
4 25 (4.91%) PostgreSQL
5 22 (4.32%) MySQL
6 20 (3.93%) RDBMS
7 13 (2.55%) Big Data
8 11 (2.16%) Oracle Database
9 10 (1.96%) SQL Server Integration Services
10 9 (1.77%) SQL Server Reporting Services
11 8 (1.57%) Oracle Database 10g
11 8 (1.57%) Oracle Database 11g
11 8 (1.57%) VLDB
12 7 (1.38%) NoSQL
13 6 (1.18%) Amazon Redshift
13 6 (1.18%) Azure SQL Database
14 5 (0.98%) Star Schema
14 5 (0.98%) Tableau
15 4 (0.79%) Redis
Development Applications
1 67 (13.16%) JIRA
2 57 (11.20%) Git
3 36 (7.07%) Selenium
4 29 (5.70%) SQL Server Management Studio (SSMS)
5 27 (5.30%) Jenkins
6 24 (4.72%) Robot Framework
7 19 (3.73%) MSI
8 17 (3.34%) AdminStudio
8 17 (3.34%) InstallShield
9 12 (2.36%) Axure RP
10 9 (1.77%) GitLab
11 8 (1.57%) Cucumber
11 8 (1.57%) SonarQube
11 8 (1.57%) Subversion
12 6 (1.18%) IBM UrbanCode
12 6 (1.18%) Team Foundation Server
13 5 (0.98%) CA Release Automation
13 5 (0.98%) Mocha
13 5 (0.98%) Visual Studio
13 5 (0.98%) Zephyr
General
1 173 (33.99%) Social Skills
2 148 (29.08%) Finance
3 97 (19.06%) Analytical Skills
4 49 (9.63%) Banking
5 28 (5.50%) Inclusion and Diversity
5 28 (5.50%) Retail
6 24 (4.72%) Organisational Skills
7 23 (4.52%) Presentation Skills
8 21 (4.13%) Public Sector
9 18 (3.54%) Games
10 14 (2.75%) Marketing
11 7 (1.38%) Back Office
12 6 (1.18%) Automotive
12 6 (1.18%) Financial Institution
13 5 (0.98%) Law
14 4 (0.79%) Documentation Skills
14 4 (0.79%) Local Government
15 3 (0.59%) Fire and Rescue
15 3 (0.59%) Influencing Skills
15 3 (0.59%) Private Banking
Job Titles
1 142 (27.90%) Analyst
2 83 (16.31%) Developer
3 70 (13.75%) Applications Support
4 68 (13.36%) Senior
4 68 (13.36%) Support Analyst
5 60 (11.79%) Applications Support Analyst
6 55 (10.81%) Lead
7 32 (6.29%) Senior Developer
8 30 (5.89%) Applications Engineer
9 25 (4.91%) DevOps Engineer
9 25 (4.91%) Software Developer
10 24 (4.72%) Solutions Analyst
11 20 (3.93%) Banking Analyst
11 20 (3.93%) Java Developer
12 19 (3.73%) Applications Packager
12 19 (3.73%) Architect
13 14 (2.75%) Active Directory Specialist
14 13 (2.55%) Active Directory Support
14 13 (2.55%) Infrastructure Engineer
14 13 (2.55%) Release Manager
Libraries, Frameworks & Software Standards
1 42 (8.25%) .NET
2 28 (5.50%) Node.js
2 28 (5.50%) RESTful
3 26 (5.11%) AngularJS
4 25 (4.91%) REST
5 24 (4.72%) Web Services
6 23 (4.52%) .NET Core
7 21 (4.13%) React
8 19 (3.73%) ARM Templates
8 19 (3.73%) CSS
9 18 (3.54%) hapi
9 18 (3.54%) HTML
10 14 (2.75%) ASP.NET
10 14 (2.75%) Middleware
10 14 (2.75%) Velocity
11 11 (2.16%) ASP.NET MVC
12 10 (1.96%) Vue
13 8 (1.57%) HTML5
14 7 (1.38%) ASP.NET Core
15 6 (1.18%) ASP.NET Web API
Miscellaneous
1 37 (7.27%) Self-Motivation
2 29 (5.70%) CMDB
3 28 (5.50%) Client/Server
3 28 (5.50%) Management Information System
4 25 (4.91%) Product Ownership
5 23 (4.52%) PKI
6 22 (4.32%) Cloud Native
7 17 (3.34%) Shadow IT
8 14 (2.75%) Hybrid Cloud
9 12 (2.36%) Sports Betting
10 11 (2.16%) Virtual Team
11 10 (1.96%) Public Cloud
12 8 (1.57%) Distributed Systems
12 8 (1.57%) Enterprise Cloud
13 7 (1.38%) Data Structures
13 7 (1.38%) Enterprise Software
14 6 (1.18%) Low-Code
15 4 (0.79%) Data Centre
15 4 (0.79%) iSeries
16 3 (0.59%) Hedge funds
Operating Systems
1 108 (21.22%) Windows
2 47 (9.23%) Linux
3 44 (8.64%) Windows Server
4 26 (5.11%) Red Hat Enterprise Linux
5 21 (4.13%) Windows 10
6 19 (3.73%) Windows 7
7 12 (2.36%) Unix
7 12 (2.36%) Windows Server 2016
7 12 (2.36%) Windows Server 2019
8 8 (1.57%) Solaris
9 2 (0.39%) Android
9 2 (0.39%) Mac OS
10 1 (0.20%) Apple iOS
10 1 (0.20%) CentOS
10 1 (0.20%) Windows Server 2012
Processes & Methodologies
1 232 (45.58%) Agile
2 183 (35.95%) DevOps
3 177 (34.77%) ITIL
4 141 (27.70%) CI/CD
5 115 (22.59%) Service Management
6 90 (17.68%) ITSM
7 77 (15.13%) Problem-Solving
8 74 (14.54%) Change Management
8 74 (14.54%) Scrum
9 65 (12.77%) Project Management
10 62 (12.18%) Analytics
11 60 (11.79%) TDD
12 57 (11.20%) Incident Management
12 57 (11.20%) Test Automation
13 56 (11.00%) Configuration Management
13 56 (11.00%) CRM
14 55 (10.81%) Continuous Improvement
15 47 (9.23%) Roadmaps
16 44 (8.64%) Application Packaging
17 43 (8.45%) Migration
Programming Languages
1 108 (21.22%) PowerShell
2 85 (16.70%) C#
3 81 (15.91%) SQL
4 63 (12.38%) Python
5 58 (11.39%) Java
6 49 (9.63%) VBScript
7 44 (8.64%) VB
8 32 (6.29%) JavaScript
9 19 (3.73%) Bash
10 13 (2.55%) Bicep
11 12 (2.36%) T-SQL
12 10 (1.96%) PL/SQL
13 9 (1.77%) TypeScript
14 6 (1.18%) PHP
14 6 (1.18%) SOQL
15 4 (0.79%) C++
16 3 (0.59%) Apex Code
16 3 (0.59%) Groovy
16 3 (0.59%) Ruby
16 3 (0.59%) Scala
Qualifications
1 125 (24.56%) Security Cleared
2 94 (18.47%) SC Cleared
3 93 (18.27%) Degree
4 47 (9.23%) DV Cleared
5 29 (5.70%) ITIL Foundation Certificate
6 27 (5.30%) Azure Certification
6 27 (5.30%) ITIL Certification
7 10 (1.96%) Computer Science Degree
8 4 (0.79%) AWS Certification
8 4 (0.79%) CISM
8 4 (0.79%) PMI Certification
9 3 (0.59%) CTC Cleared
9 3 (0.59%) ISTQB
10 2 (0.39%) CISSP
10 2 (0.39%) DBS Check
10 2 (0.39%) OCP
10 2 (0.39%) Oracle Certification
10 2 (0.39%) VMware Certified Professional (VCP)
11 1 (0.20%) BPSS Clearance
11 1 (0.20%) PMP
Quality Assurance & Compliance
1 60 (11.79%) QA
2 17 (3.34%) SLA
3 14 (2.75%) Data Quality
4 7 (1.38%) NIST
4 7 (1.38%) PMO
5 6 (1.18%) Cyber Essentials
6 5 (0.98%) COBIT
7 4 (0.79%) Accessibility
7 4 (0.79%) GRC
8 2 (0.39%) Disclosure Scotland
8 2 (0.39%) GAAP
8 2 (0.39%) IFRS
9 1 (0.20%) GDPR
9 1 (0.20%) IEC 62304
9 1 (0.20%) ISO 13485
System Software
1 60 (11.79%) Active Directory
2 49 (9.63%) VMware Infrastructure
3 30 (5.89%) Virtual Desktop
4 27 (5.30%) Virtual Machines
5 19 (3.73%) Docker
6 17 (3.34%) Microsoft App-V
7 8 (1.57%) Oracle RAC
8 3 (0.59%) VMware ESXi
8 3 (0.59%) vSphere
9 2 (0.39%) Firmware
9 2 (0.39%) Hyper-V
10 1 (0.20%) Terminal Services
10 1 (0.20%) VirtualBox
10 1 (0.20%) XenApp
10 1 (0.20%) XenDesktop
Systems Management
1 71 (13.95%) Kubernetes
2 49 (9.63%) SCCM
3 42 (8.25%) WSUS
4 31 (6.09%) Microsoft Intune
5 28 (5.50%) Terraform
6 25 (4.91%) SCOM
7 23 (4.52%) Active Directory Federation Services
8 18 (3.54%) Ansible
9 9 (1.77%) Kibana
9 9 (1.77%) Progress Chef
9 9 (1.77%) Puppet
10 8 (1.57%) Data Guard
10 8 (1.57%) Oracle RMAN
11 6 (1.18%) Nagios
12 5 (0.98%) Prometheus
13 4 (0.79%) Rancher
14 2 (0.39%) Argo
14 2 (0.39%) Control-M
14 2 (0.39%) Grafana
14 2 (0.39%) Red Hat Satellite
Vendors
1 170 (33.40%) Microsoft
2 70 (13.75%) ServiceNow
3 58 (11.39%) VMware
4 48 (9.43%) Oracle
5 27 (5.30%) FNZ
6 20 (3.93%) Salesforce
7 19 (3.73%) Autodesk
8 11 (2.16%) SAP
9 10 (1.96%) Sun
10 9 (1.77%) Remedy
11 8 (1.57%) Dynatrace
12 7 (1.38%) Google
13 6 (1.18%) New Relic
13 6 (1.18%) Splunk
14 5 (0.98%) Adobe
14 5 (0.98%) Citrix
14 5 (0.98%) Databricks
14 5 (0.98%) IBM
14 5 (0.98%) Veracode
15 4 (0.79%) Reuters