XML
UK

The following table provides summary statistics for permanent job vacancies with a requirement for XML skills. Included is a benchmarking guide to the salaries offered in vacancies that have cited XML over the 6 months to 7 December 2023 with a comparison to the same period in the previous 2 years.

6 months to
7 Dec 2023
Same period 2022 Same period 2021
Rank 221 248 196
Rank change year-on-year +27 -52 -34
Permanent jobs citing XML 841 1,827 2,526
As % of all permanent jobs advertised in the UK 1.59% 1.49% 1.97%
As % of the Libraries, Frameworks & Software Standards category 6.03% 4.58% 5.12%
Number of salaries quoted 515 1,234 1,733
10th Percentile £38,850 £37,500 £32,500
25th Percentile £46,250 £47,500 £41,250
Median annual salary (50th Percentile) £60,000 £60,000 £52,500
Median % change year-on-year - +14.29% -4.55%
75th Percentile £75,625 £80,000 £67,500
90th Percentile £88,750 £100,000 £83,750
UK excluding London median annual salary £55,000 £53,000 £47,500
% change year-on-year +3.77% +11.58% -

All Software Libraries and Frameworks
UK

XML is in the Software Libraries and Frameworks category. The following table is for comparison with the above and provides summary statistics for all permanent job vacancies with a requirement for technical specification, industry standards, software libraries and framework skills.

Permanent vacancies with a requirement for technical specification, industry standards, software libraries and framework skills 13,950 39,876 49,341
As % of all permanent jobs advertised in the UK 26.33% 32.46% 38.50%
Number of salaries quoted 10,888 24,229 32,106
10th Percentile £41,250 £40,000 £36,750
25th Percentile £51,250 £50,000 £45,000
Median annual salary (50th Percentile) £65,500 £65,000 £60,000
Median % change year-on-year +0.77% +8.33% +4.35%
75th Percentile £85,000 £86,250 £80,000
90th Percentile £106,289 £105,000 £96,250
UK excluding London median annual salary £57,500 £57,500 £52,500
% change year-on-year - +9.52% +5.00%

XML
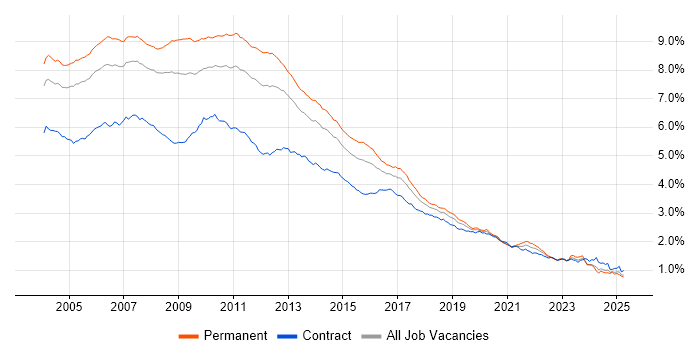
Job Vacancy Trend

Job postings citing XML as a proportion of all IT jobs advertised.

Job vacancy trend for XML in the UK

XML
Salary Trend

3-month moving average salary quoted in jobs citing XML.

Salary trend for XML in the UK

XML
Salary Histogram

Salary distribution for jobs citing XML over the 6 months to 7 December 2023.

Salary histogram for XML in the UK

XML
Top 17 Job Locations

The table below looks at the demand and provides a guide to the median salaries quoted in IT jobs citing XML within the UK over the 6 months to 7 December 2023. The 'Rank Change' column provides an indication of the change in demand within each location based on the same 6 month period last year.

Location Rank Change
on Same Period
Last Year
Matching
Permanent
IT Job Ads
Median Salary
Past 6 Months
Median Salary
% Change
on Same Period
Last Year
Live
Jobs
England +42 727 £60,500 +0.83% 278
UK excluding London +60 557 £55,000 +3.77% 164
Work from Home +35 383 £60,000 +0.80% 169
London +28 241 £70,000 -3.45% 129
South East +78 207 £55,000 -4.35% 54
North of England +76 103 £60,000 +14.29% 40
Midlands +75 85 £52,500 -0.94% 19
North West +113 60 £60,000 +9.09% 23
South West +8 59 £47,500 -5.00% 17
East Midlands +57 49 £47,500 -5.00% 4
Scotland +14 45 £54,659 -8.90% 12
Yorkshire +40 41 £75,000 +42.86% 14
West Midlands +68 36 £53,000 -3.64% 15
East of England +85 24 £40,500 -22.86% 19
Northern Ireland +38 20 £62,500 +16.82% 5
Wales +14 19 £47,500 -18.80% 2
North East +35 2 £46,250 +15.63% 3

XML
Co-occurring Skills and Capabilities by Category

The follow tables expand on the table above by listing co-occurrences grouped by category. The same employment type, locality and period is covered with up to 20 co-occurrences shown in each of the following categories:

Application Platforms
1 90 (10.70%) JBoss
2 88 (10.46%) Red Hat Fuse
3 67 (7.97%) SAS
4 34 (4.04%) IIS
5 29 (3.45%) Confluence
6 27 (3.21%) SharePoint
7 17 (2.02%) Tomcat
8 16 (1.90%) Apache
9 14 (1.66%) WebSphere
10 13 (1.55%) Apache Spark
10 13 (1.55%) OpenStack
11 11 (1.31%) Jetty
12 10 (1.19%) MS Exchange
13 8 (0.95%) Anypoint
13 8 (0.95%) Oracle SOA Suite
14 7 (0.83%) NServiceBus
15 6 (0.71%) CMS
15 6 (0.71%) Mendix
16 5 (0.59%) CICS
16 5 (0.59%) SharePoint Server
Applications
1 18 (2.14%) Microsoft Office
2 15 (1.78%) MS Visio
3 12 (1.43%) Microsoft Excel
4 9 (1.07%) AutoCAD
4 9 (1.07%) PTC Creo
4 9 (1.07%) SOLIDWORKS
5 5 (0.59%) Acrobat
5 5 (0.59%) Microsoft Project
6 4 (0.48%) LibreOffice
7 2 (0.24%) Fireworks
7 2 (0.24%) Photoshop
7 2 (0.24%) RoboHelp
7 2 (0.24%) XMetaL
8 1 (0.12%) Microsoft PowerPoint
8 1 (0.12%) Spreadsheet
8 1 (0.12%) SPSS
Business Applications
1 40 (4.76%) Remedy ITSM
2 20 (2.38%) Elite 3E
3 7 (0.83%) Dynamics CRM
3 7 (0.83%) NetSuite
4 6 (0.71%) Exstream
5 5 (0.59%) Dynamics NAV
5 5 (0.59%) Unit4 Business World
6 3 (0.36%) Infor M3
6 3 (0.36%) Magento
6 3 (0.36%) SAP ERP
7 2 (0.24%) Misys Equation
7 2 (0.24%) SAP S/4HANA
8 1 (0.12%) Adobe Campaign
8 1 (0.12%) Oracle ERP
8 1 (0.12%) Oracle FAH
8 1 (0.12%) Oracle Payables
8 1 (0.12%) Payment Gateway
8 1 (0.12%) Salesforce CRM
8 1 (0.12%) SAP Business One
8 1 (0.12%) SAP Hybris
Cloud Services
1 155 (18.43%) Azure
2 100 (11.89%) SaaS
3 98 (11.65%) AWS
4 58 (6.90%) Azure DevOps
5 55 (6.54%) Power Platform
6 35 (4.16%) GitHub
7 34 (4.04%) Serverless
8 28 (3.33%) PaaS
9 27 (3.21%) GCP
10 25 (2.97%) IaaS
11 18 (2.14%) Dynamics 365
12 17 (2.02%) Azure Logic Apps
12 17 (2.02%) Entra ID
13 15 (1.78%) Azure API Management
14 14 (1.66%) Amazon SQS
14 14 (1.66%) Azure Data Factory
15 13 (1.55%) Microsoft 365
15 13 (1.55%) PowerApps
16 12 (1.43%) AWS CodeCommit
16 12 (1.43%) Azure Service Bus
Communications & Networking
1 31 (3.69%) WAN
2 29 (3.45%) VPN
3 27 (3.21%) SSL
4 25 (2.97%) Internet
4 25 (2.97%) LAN
5 24 (2.85%) HTTP
6 19 (2.26%) DNS
7 14 (1.66%) AMQP
8 11 (1.31%) Firewall
9 10 (1.19%) TCP/IP
10 7 (0.83%) DHCP
11 6 (0.71%) iSCSI
11 6 (0.71%) VLAN
12 5 (0.59%) SAN
13 4 (0.48%) 5G
13 4 (0.48%) FTP
13 4 (0.48%) SD-WAN
13 4 (0.48%) SMTP
14 3 (0.36%) Network Security
14 3 (0.36%) VXLAN
Database & Business Intelligence
1 207 (24.61%) SQL Server
2 72 (8.56%) Metadata
2 72 (8.56%) Relational Database
3 65 (7.73%) Base SAS
4 64 (7.61%) MySQL
5 46 (5.47%) Power BI
6 41 (4.88%) Oracle Database
7 40 (4.76%) PostgreSQL
8 39 (4.64%) SQL Server Integration Services
9 36 (4.28%) NoSQL
10 33 (3.92%) Big Data
11 32 (3.80%) Data Warehouse
12 30 (3.57%) Oracle Reports
13 27 (3.21%) SQL Server Reporting Services
14 24 (2.85%) JasperReports
15 20 (2.38%) Data Lake
15 20 (2.38%) SQLite
16 13 (1.55%) Hadoop
16 13 (1.55%) MongoDB
16 13 (1.55%) Oracle Database 11g
Development Applications
1 94 (11.18%) Git
2 87 (10.34%) IntelliJ
3 71 (8.44%) Jenkins
4 53 (6.30%) JIRA
5 50 (5.95%) Maven
6 44 (5.23%) Selenium
7 35 (4.16%) Subversion
8 34 (4.04%) Visual Studio
9 27 (3.21%) Oracle APEX
10 22 (2.62%) Postman
11 18 (2.14%) JUnit
12 15 (1.78%) Cucumber
12 15 (1.78%) JMeter
13 14 (1.66%) Mockito
13 14 (1.66%) SoapUI
14 13 (1.55%) Bitbucket
15 12 (1.43%) ClearCase
15 12 (1.43%) eggPlant
15 12 (1.43%) GitLab
15 12 (1.43%) The Grinder
General
1 160 (19.02%) Public Sector
2 142 (16.88%) Social Skills
3 127 (15.10%) Finance
4 90 (10.70%) Inclusion and Diversity
5 78 (9.27%) Analytical Skills
6 69 (8.20%) Pharmaceutical
7 50 (5.95%) Law
8 47 (5.59%) Legal
9 45 (5.35%) Banking
10 27 (3.21%) Retail
11 21 (2.50%) Local Government
12 19 (2.26%) Organisational Skills
13 12 (1.43%) Back Office
14 11 (1.31%) Financial Institution
14 11 (1.31%) Retail Banking
15 10 (1.19%) Manufacturing
16 8 (0.95%) Front Office
16 8 (0.95%) Presentation Skills
17 7 (0.83%) Documentation Skills
17 7 (0.83%) Marketing
Job Titles
1 365 (43.40%) Developer
2 268 (31.87%) Senior
3 124 (14.74%) Software Engineer
4 103 (12.25%) Senior Developer
5 77 (9.16%) Senior Software Engineer
6 73 (8.68%) Java Engineer
7 72 (8.56%) Java Software Engineer
8 71 (8.44%) .NET Developer
8 71 (8.44%) Java Developer
9 69 (8.20%) Analyst
10 67 (7.97%) Senior Java Engineer
10 67 (7.97%) Senior Java Software Engineer
11 65 (7.73%) Programmer
12 64 (7.61%) SAS Programmer
12 64 (7.61%) SAS Statistical Programmer
12 64 (7.61%) Statistical Programmer
13 53 (6.30%) Architect
14 52 (6.18%) Software Developer
15 50 (5.95%) Lead
16 37 (4.40%) Consultant
Libraries, Frameworks & Software Standards
1 424 (50.42%) JSON
2 285 (33.89%) Web Services
3 269 (31.99%) HTML
4 264 (31.39%) REST
5 240 (28.54%) SOAP
6 215 (25.56%) CSS
7 201 (23.90%) .NET
8 178 (21.17%) Spring
9 177 (21.05%) AngularJS
10 98 (11.65%) XSD
11 96 (11.41%) Hibernate
12 90 (10.70%) RESTful
13 87 (10.34%) JPA
14 86 (10.23%) ASP.NET
15 78 (9.27%) Java EE
16 60 (7.13%) .NET Framework
16 60 (7.13%) React
17 55 (6.54%) Node.js
18 45 (5.35%) Ajax
19 44 (5.23%) LDAP
Miscellaneous
1 73 (8.68%) Onboarding
2 66 (7.85%) Life Science
3 39 (4.64%) Management Information System
4 38 (4.52%) Enterprise Software
5 31 (3.69%) Self-Motivation
6 25 (2.97%) CMDB
7 24 (2.85%) Legacy Systems
8 21 (2.50%) Public Cloud
9 19 (2.26%) Product Ownership
10 14 (1.66%) Replication
11 13 (1.55%) Data Structures
11 13 (1.55%) Low-Code
12 12 (1.43%) Distributed Systems
13 11 (1.31%) Algorithms
13 11 (1.31%) Online Banking
14 9 (1.07%) Clustering
14 9 (1.07%) Operational Technology
15 7 (0.83%) Hedge funds
15 7 (0.83%) iSeries
16 6 (0.71%) Reference Data
Operating Systems
1 80 (9.51%) Linux
2 75 (8.92%) Windows
3 28 (3.33%) Windows Server
4 25 (2.97%) Unix
5 11 (1.31%) Windows Server 2012
5 11 (1.31%) Windows Server 2016
6 8 (0.95%) Android
6 8 (0.95%) Mac OS
7 7 (0.83%) Apple iOS
8 5 (0.59%) zOS
9 4 (0.48%) Windows Server 2019
10 3 (0.36%) Ubuntu
11 2 (0.24%) Windows 10
12 1 (0.12%) CentOS
Processes & Methodologies
1 325 (38.64%) Agile
2 264 (31.39%) Problem-Solving
3 190 (22.59%) Software Engineering
4 156 (18.55%) Collaborative Working
5 141 (16.77%) Mentoring
6 126 (14.98%) DevOps
7 124 (14.74%) Actionable Insight
8 120 (14.27%) User Experience
9 106 (12.60%) Scrum
10 105 (12.49%) Computer Science
11 101 (12.01%) UX Design
12 100 (11.89%) Front End Development
13 85 (10.11%) Data Design
14 82 (9.75%) Project Management
15 77 (9.16%) Microservices
16 76 (9.04%) Mathematics
17 75 (8.92%) Test Automation
18 72 (8.56%) Full Stack Development
19 70 (8.32%) SDLC
20 69 (8.20%) Statistics
Programming Languages
1 385 (45.78%) SQL
2 288 (34.24%) JavaScript
3 265 (31.51%) Java
4 182 (21.64%) C#
5 128 (15.22%) Python
6 65 (7.73%) SAS Macro
7 59 (7.02%) PowerShell
8 51 (6.06%) T-SQL
9 50 (5.95%) VB
10 47 (5.59%) PL/SQL
11 45 (5.35%) VB.NET
12 42 (4.99%) C++
13 36 (4.28%) Perl
14 34 (4.04%) PHP
15 27 (3.21%) Ruby
16 26 (3.09%) C
17 23 (2.73%) JSX
18 13 (1.55%) Bash
18 13 (1.55%) TypeScript
18 13 (1.55%) XPath
Qualifications
1 207 (24.61%) Security Cleared
2 192 (22.83%) SC Cleared
3 175 (20.81%) Degree
4 31 (3.69%) Numerate Degree
5 27 (3.21%) Computer Science Degree
6 22 (2.62%) AWS Certification
7 21 (2.50%) Azure Certification
8 12 (1.43%) AWS Certified Solutions Architect
9 10 (1.19%) MCSA
9 10 (1.19%) MCSE
9 10 (1.19%) Microsoft Certification
10 7 (0.83%) ISTQB
11 6 (0.71%) ISEB
12 3 (0.36%) ITIL Foundation Certificate
13 2 (0.24%) BPSS Clearance
13 2 (0.24%) Master's Degree
14 1 (0.12%) CTC Cleared
14 1 (0.12%) DV Cleared
14 1 (0.12%) HNC
14 1 (0.12%) OCP
Quality Assurance & Compliance
1 103 (12.25%) QA
2 65 (7.73%) CDISC
3 12 (1.43%) Data Quality
4 9 (1.07%) SLA
4 9 (1.07%) Software Quality Assurance
5 4 (0.48%) HL7
5 4 (0.48%) ISO/IEC 27001
6 3 (0.36%) DICOM
7 2 (0.24%) Government Security Classifications
7 2 (0.24%) NCSC
7 2 (0.24%) PMO
8 1 (0.12%) COREP
8 1 (0.12%) GDPR
8 1 (0.12%) IFRS
8 1 (0.12%) IFRS 17
8 1 (0.12%) IFRS 9
8 1 (0.12%) ISO 15022
8 1 (0.12%) ISO 20022
8 1 (0.12%) ISO 9001
System Software
1 32 (3.80%) Docker
2 24 (2.85%) Active Directory
3 11 (1.31%) Hyper-V
4 8 (0.95%) Virtual Machines
5 5 (0.59%) RACF
5 5 (0.59%) VMware Infrastructure
6 4 (0.48%) KVM
7 3 (0.36%) Ceph
7 3 (0.36%) Time Sharing Option
8 2 (0.24%) ACF2
8 2 (0.24%) IAG
8 2 (0.24%) Virtual Servers
8 2 (0.24%) vSphere
9 1 (0.12%) Citrix Hypervisor
9 1 (0.12%) Embedded Firmware
9 1 (0.12%) Firmware
9 1 (0.12%) QEMU
Systems Management
1 25 (2.97%) Kubernetes
2 23 (2.73%) HP UCMDB
3 21 (2.50%) Ansible
4 19 (2.26%) Terraform
5 12 (1.43%) Active Directory Federation Services
6 10 (1.19%) HP Quality Center
6 10 (1.19%) SCCM
6 10 (1.19%) SCOM
7 7 (0.83%) Single Sign-On
8 6 (0.71%) Control-M
9 5 (0.59%) HP ALM
9 5 (0.59%) Microsoft Clustering
10 3 (0.36%) FortiGate
10 3 (0.36%) MAINVIEW
11 2 (0.24%) HAProxy
11 2 (0.24%) Jamf Pro
11 2 (0.24%) Microsoft Intune
11 2 (0.24%) ZABBIX
12 1 (0.12%) ITRS Geneos
12 1 (0.12%) Progress Chef
Vendors
1 146 (17.36%) Microsoft
2 141 (16.77%) Oracle
3 64 (7.61%) ServiceNow
4 56 (6.66%) HP
5 43 (5.11%) BMC
6 40 (4.76%) Remedy
7 25 (2.97%) Salesforce
8 24 (2.85%) SAP
8 24 (2.85%) Xamarin
9 21 (2.50%) IBM
10 14 (1.66%) Red Hat
11 13 (1.55%) Databricks
11 13 (1.55%) MuleSoft
12 12 (1.43%) MKS
13 11 (1.31%) Atlassian
14 10 (1.19%) OpenText
14 10 (1.19%) TOWER Software
15 9 (1.07%) MathWorks
15 9 (1.07%) PTC
16 8 (0.95%) Adobe