Grafana
UK

The table below provides summary statistics for permanent job vacancies requiring Grafana skills. It includes a benchmarking guide to the annual salaries offered in vacancies that cited Grafana over the 6 months leading up to 23 October 2024, comparing them to the same period in the previous two years.

6 months to
23 Oct 2024
Same period 2023 Same period 2022
Rank 367 459 524
Rank change year-on-year +92 +65 -127
Permanent jobs citing Grafana 510 327 850
As % of all permanent jobs advertised in the UK 0.67% 0.55% 0.60%
As % of the Systems Management category 7.27% 3.65% 3.63%
Number of salaries quoted 189 259 344
10th Percentile £43,911 £46,250 £48,950
25th Percentile £58,938 £56,250 £60,535
Median annual salary (50th Percentile) £74,000 £65,000 £77,500
Median % change year-on-year +13.85% -16.13% +3.33%
75th Percentile £85,000 £85,000 £95,000
90th Percentile £103,000 £100,000 £107,500
UK excluding London median annual salary £67,500 £62,500 £65,000
% change year-on-year +8.00% -3.85% +8.33%

All Systems Management Skills
UK

Grafana falls under the Systems Management category. For comparison with the information above, the following table provides summary statistics for all permanent job vacancies requiring systems management skills.

Permanent vacancies with a requirement for systems management skills 7,013 8,955 23,426
As % of all permanent jobs advertised in the UK 9.27% 15.06% 16.67%
Number of salaries quoted 3,963 6,883 12,170
10th Percentile £37,500 £35,500 £36,500
25th Percentile £48,925 £47,500 £47,500
Median annual salary (50th Percentile) £67,500 £65,000 £67,500
Median % change year-on-year +3.85% -3.70% +3.85%
75th Percentile £86,250 £84,056 £87,500
90th Percentile £102,500 £100,000 £105,000
UK excluding London median annual salary £57,500 £57,500 £55,000
% change year-on-year - +4.55% -

Grafana
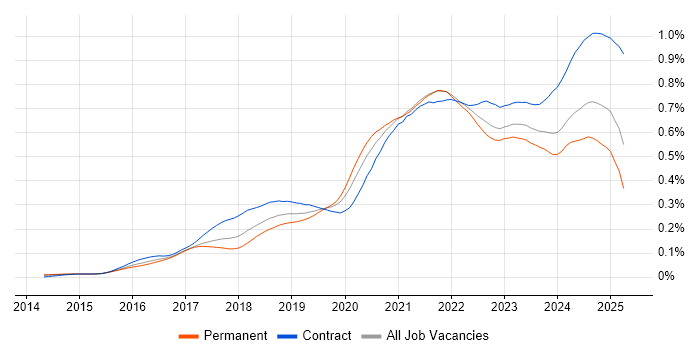
Job Vacancy Trend

Job postings citing Grafana as a proportion of all IT jobs advertised.

Job vacancy trend for Grafana in the UK

Grafana
Salary Trend

3-month moving average salary quoted in jobs citing Grafana.

Salary trend for Grafana in the UK

Grafana
Salary Histogram

Salary distribution for jobs citing Grafana over the 6 months to 23 October 2024.

Salary histogram for Grafana in the UK

Grafana
Top 17 Job Locations

The table below looks at the demand and provides a guide to the median salaries quoted in IT jobs citing Grafana within the UK over the 6 months to 23 October 2024. The 'Rank Change' column provides an indication of the change in demand within each location based on the same 6 month period last year.

Location Rank Change
on Same Period
Last Year
Matching
Permanent
IT Job Ads
Median Salary
Past 6 Months
Median Salary
% Change
on Same Period
Last Year
Live
Jobs
England +76 481 £70,000 +4.09% 99
Work from Home +148 317 £75,000 +15.38% 163
London +113 290 £80,000 +6.67% 48
UK excluding London +14 200 £67,500 +8.00% 51
North of England -13 64 £75,000 +20.00% 12
South West +10 53 £65,000 - 11
South East +4 42 £67,500 -15.63% 10
North East - 39 £65,465 - 2
Midlands -14 25 £65,000 +10.64% 13
North West -24 14 £75,000 +39.53% 7
East Midlands -18 13 £40,750 -32.08% 5
Scotland -4 12 £54,250 +8.50% 2
West Midlands -26 12 £65,000 +18.18% 8
Yorkshire +7 11 £82,500 +32.00% 3
East of England -36 11 £50,000 -41.18% 3
Wales +41 8 £65,000 +13.04%
Northern Ireland +27 1 - -

Grafana
Co-occurring Skills and Capabilities by Category

The follow tables expand on the table above by listing co-occurrences grouped by category. The same employment type, locality and period is covered with up to 20 co-occurrences shown in each of the following categories:

Application Platforms
1 40 (7.84%) nginx
2 23 (4.51%) Confluence
3 20 (3.92%) Apache
4 15 (2.94%) Jupyter
4 15 (2.94%) SharePoint
5 12 (2.35%) Apache Spark
5 12 (2.35%) IIS
5 12 (2.35%) Microsoft Exchange
6 5 (0.98%) Apache Airflow
7 2 (0.39%) JBoss
7 2 (0.39%) Oracle SOA Suite
7 2 (0.39%) Red Hat Fuse
8 1 (0.20%) DataSynapse
8 1 (0.20%) Ethereum
8 1 (0.20%) Solana
Applications
1 2 (0.39%) Microsoft Office
2 1 (0.20%) Microsoft Excel
2 1 (0.20%) Microsoft Project
2 1 (0.20%) Spreadsheet
Business Applications
1 3 (0.59%) Fidessa
2 2 (0.39%) Dynamics CRM
2 2 (0.39%) Endur
3 1 (0.20%) Oracle EBS
Cloud Services
1 143 (28.04%) AWS
2 120 (23.53%) Azure
3 85 (16.67%) Amazon CloudWatch
4 49 (9.61%) GCP
5 32 (6.27%) Azure DevOps
6 29 (5.69%) GitHub
7 24 (4.71%) Datadog
7 24 (4.71%) Serverless
8 23 (4.51%) Microsoft 365
9 21 (4.12%) Amazon S3
10 18 (3.53%) Azure AKS
10 18 (3.53%) OpenShift
11 17 (3.33%) Azure Cosmos DB
12 16 (3.14%) Amazon EKS
12 16 (3.14%) Azure Monitor
12 16 (3.14%) GitHub Actions
13 14 (2.75%) Azure Pipelines
14 12 (2.35%) Azure Service Bus
14 12 (2.35%) Cloudflare
14 12 (2.35%) MinIO
Communications & Networking
1 201 (39.41%) Broadband
2 22 (4.31%) DNS
3 16 (3.14%) Firewall
4 14 (2.75%) DHCP
5 8 (1.57%) TCP/IP
6 6 (1.18%) SNMP
7 5 (0.98%) Modbus
7 5 (0.98%) Wireshark
8 4 (0.78%) MQTT
9 3 (0.59%) FIX Connectivity
9 3 (0.59%) Network Security
9 3 (0.59%) SSL
9 3 (0.59%) tcpdump
9 3 (0.59%) VPN
10 2 (0.39%) NAS
10 2 (0.39%) SAN
10 2 (0.39%) Wireless
11 1 (0.20%) HTTP
11 1 (0.20%) Multicast
11 1 (0.20%) Telnet
Database & Business Intelligence
1 89 (17.45%) MySQL
2 38 (7.45%) PostgreSQL
3 23 (4.51%) Elasticsearch
4 22 (4.31%) Big Data
5 21 (4.12%) Redis
6 20 (3.92%) MongoDB
7 19 (3.73%) SQL Server
8 17 (3.33%) NoSQL
9 12 (2.35%) Azure SQL Database
9 12 (2.35%) Hadoop
9 12 (2.35%) Presto
10 9 (1.76%) InfluxDB
11 6 (1.18%) Amazon RDS
11 6 (1.18%) ClickHouse
11 6 (1.18%) Relational Database
12 4 (0.78%) Amazon Aurora
12 4 (0.78%) DynamoDB
12 4 (0.78%) Parquet
13 3 (0.59%) Apache Cassandra
14 2 (0.39%) Couchbase
Development Applications
1 65 (12.75%) JIRA
2 57 (11.18%) Jenkins
3 53 (10.39%) Git
4 49 (9.61%) GitLab
5 15 (2.94%) TeamCity
6 13 (2.55%) Maven
7 12 (2.35%) Atlassian Bamboo
7 12 (2.35%) Octopus Deploy
8 8 (1.57%) Cucumber
8 8 (1.57%) SonarQube
9 7 (1.37%) Bitbucket
10 5 (0.98%) Appium
10 5 (0.98%) Cypress.io
10 5 (0.98%) IntelliJ
11 4 (0.78%) Visual Studio Code
12 3 (0.59%) Cactus
12 3 (0.59%) GoCD
12 3 (0.59%) JMeter
12 3 (0.59%) JUnit
12 3 (0.59%) ScalaTest
General
1 203 (39.80%) Analytical Skills
2 198 (38.82%) Social Skills
3 88 (17.25%) Inclusion and Diversity
4 66 (12.94%) Finance
5 60 (11.76%) Public Sector
6 21 (4.12%) Law
7 20 (3.92%) Banking
8 14 (2.75%) Games
9 12 (2.35%) Retail
10 7 (1.37%) Marketing
10 7 (1.37%) Publishing
11 6 (1.18%) Manufacturing
12 5 (0.98%) iGaming
13 4 (0.78%) Documentation Skills
13 4 (0.78%) Financial Institution
14 3 (0.59%) Back Office
14 3 (0.59%) Influencing Skills
14 3 (0.59%) Presentation Skills
14 3 (0.59%) Tech for Good
14 3 (0.59%) Telecoms
Job Titles
1 142 (27.84%) Lead
2 123 (24.12%) Team Leader
3 78 (15.29%) Analyst
4 70 (13.73%) Operations Analyst
4 70 (13.73%) Service Analyst
4 70 (13.73%) Service Operations Analyst
5 62 (12.16%) DevOps Engineer
6 52 (10.20%) Senior
7 36 (7.06%) Service Manager
7 36 (7.06%) ServiceNow Manager
8 34 (6.67%) Site Reliability Engineer
9 33 (6.47%) Software Engineer
10 29 (5.69%) Site Engineer
11 26 (5.10%) Developer
12 24 (4.71%) Platform Engineer
13 23 (4.51%) Infrastructure Engineer
14 20 (3.92%) Azure Engineer
15 16 (3.14%) Java Engineer
15 16 (3.14%) Linux Engineer
16 14 (2.75%) Backend Developer
Libraries, Frameworks & Software Standards
1 155 (30.39%) Elastic Stack
2 30 (5.88%) RabbitMQ
3 27 (5.29%) Loki
4 21 (4.12%) .NET
5 19 (3.73%) Keycloak
6 18 (3.53%) Apache NiFi
7 17 (3.33%) GraphQL
7 17 (3.33%) Kafka
7 17 (3.33%) WebSockets
8 16 (3.14%) RESTful
9 15 (2.94%) Spring
10 14 (2.75%) REST
11 13 (2.55%) ActiveMQ
11 13 (2.55%) Flask
11 13 (2.55%) YAML
12 12 (2.35%) ARM Templates
12 12 (2.35%) Django
12 12 (2.35%) FastAPI
12 12 (2.35%) React
13 9 (1.76%) OpenTelemetry
Miscellaneous
1 125 (24.51%) Private Cloud
2 87 (17.06%) Onboarding
3 36 (7.06%) Cloud Native
4 22 (4.31%) Distributed Systems
5 17 (3.33%) Data Centre
6 12 (2.35%) Enterprise Storage
7 10 (1.96%) Hybrid Cloud
8 9 (1.76%) Blog
9 8 (1.57%) Public Cloud
10 7 (1.37%) Clustering
10 7 (1.37%) Distributed Architecture
10 7 (1.37%) FPGA
11 6 (1.18%) IoT
11 6 (1.18%) Management Information System
11 6 (1.18%) Mobile Games
11 6 (1.18%) Online Games
11 6 (1.18%) Replication
12 5 (0.98%) Blockchain
12 5 (0.98%) Product Ownership
12 5 (0.98%) Raspberry Pi
Operating Systems
1 241 (47.25%) Linux
2 56 (10.98%) Windows
3 23 (4.51%) Ubuntu
4 21 (4.12%) Windows Server
5 19 (3.73%) CentOS
6 12 (2.35%) Red Hat Enterprise Linux
7 11 (2.16%) Unix
8 6 (1.18%) Oracle Linux
9 5 (0.98%) Debian
9 5 (0.98%) Solaris
10 3 (0.59%) Alpine Linux
10 3 (0.59%) VMS
11 1 (0.20%) Fedora
11 1 (0.20%) Windows Server 2019
Processes & Methodologies
1 338 (66.27%) DevOps
2 268 (52.55%) Problem-Solving
3 244 (47.84%) CI/CD
4 242 (47.45%) Observability
5 205 (40.20%) Containerisation
6 192 (37.65%) Agile
7 182 (35.69%) Site Reliability Engineering
8 164 (32.16%) Continuous Improvement
9 163 (31.96%) Continuous Integration
10 150 (29.41%) Continuous Deployment
10 150 (29.41%) Mentoring
11 146 (28.63%) Task Automation
12 142 (27.84%) Computer Science
13 140 (27.45%) Configuration Management
14 138 (27.06%) Deployment Automation
15 132 (25.88%) Roadmaps
16 128 (25.10%) Service Delivery
17 124 (24.31%) ITIL
17 124 (24.31%) Validation
18 123 (24.12%) Product Roadmap
Programming Languages
1 250 (49.02%) Python
2 192 (37.65%) Bash
3 151 (29.61%) Shell Script
4 116 (22.75%) SQL
5 55 (10.78%) PowerShell
6 54 (10.59%) Java
7 28 (5.49%) C#
8 20 (3.92%) JavaScript
9 17 (3.33%) Go
9 17 (3.33%) TypeScript
10 13 (2.55%) Bicep
11 12 (2.35%) Perl
12 9 (1.76%) C++
13 6 (1.18%) Ruby
14 5 (0.98%) PHP
15 3 (0.59%) Scala
15 3 (0.59%) VB
16 2 (0.39%) Groovy
17 1 (0.20%) Kotlin
17 1 (0.20%) PL/SQL
Qualifications
1 151 (29.61%) Degree
2 138 (27.06%) Computer Science Degree
3 131 (25.69%) LPIC
4 126 (24.71%) Master's Degree
5 123 (24.12%) RHCSA
6 48 (9.41%) Security Cleared
7 24 (4.71%) DV Cleared
8 18 (3.53%) SC Cleared
9 11 (2.16%) ITIL Certification
9 11 (2.16%) RHCE
10 8 (1.57%) BPSS Clearance
11 6 (1.18%) AWS Certification
12 5 (0.98%) CTC Cleared
13 4 (0.78%) Azure Certification
14 3 (0.59%) AWS Certified DevOps Engineer
14 3 (0.59%) Linux+ Certification
15 1 (0.20%) Cisco Certification
15 1 (0.20%) MBA
15 1 (0.20%) PMI Certification
15 1 (0.20%) PMP
Quality Assurance & Compliance
1 123 (24.12%) NIST
1 123 (24.12%) SOC 2
2 9 (1.76%) QA
3 4 (0.78%) GDPR
3 4 (0.78%) SLA
4 3 (0.59%) Accessibility
5 2 (0.39%) Data Quality
6 1 (0.20%) PMO
System Software
1 255 (50.00%) Docker
2 18 (3.53%) Active Directory
2 18 (3.53%) Virtual Machines
3 10 (1.96%) VMware Infrastructure
4 7 (1.37%) Hyper-V
5 6 (1.18%) Apache ZooKeeper
5 6 (1.18%) Varnish
6 4 (0.78%) Slurm Workload Manager
7 3 (0.59%) KVM
7 3 (0.59%) NFS
7 3 (0.59%) vSphere
8 1 (0.20%) VMware Workstation
Systems Management
1 299 (58.63%) Prometheus
2 214 (41.96%) Ansible
3 159 (31.18%) Kubernetes
4 137 (26.86%) Terraform
5 61 (11.96%) Kibana
6 23 (4.51%) Nagios
7 20 (3.92%) Puppet
8 18 (3.53%) Progress Chef
9 13 (2.55%) HAProxy
10 11 (2.16%) Istio
10 11 (2.16%) WSUS
10 11 (2.16%) ZABBIX
11 8 (1.57%) Rancher
12 5 (0.98%) Argo
12 5 (0.98%) Cacti
13 4 (0.78%) Microsoft Intune
14 3 (0.59%) Opsview
14 3 (0.59%) Packer
15 2 (0.39%) logstash
15 2 (0.39%) Opsgenie
Vendors
1 46 (9.02%) Microsoft
2 45 (8.82%) Dynatrace
2 45 (8.82%) Splunk
3 41 (8.04%) ServiceNow
4 34 (6.67%) VMware
5 19 (3.73%) Google
6 17 (3.33%) Oracle
6 17 (3.33%) Red Hat
7 9 (1.76%) Commvault
8 6 (1.18%) Atlassian
8 6 (1.18%) Salesforce
9 5 (0.98%) Cisco
9 5 (0.98%) ION Trading
9 5 (0.98%) New Relic
9 5 (0.98%) Serena
10 4 (0.78%) Facebook
11 3 (0.59%) SaltStack
11 3 (0.59%) SolarWinds
11 3 (0.59%) Talend
11 3 (0.59%) Trayport