Applications Support Analyst Jobs

Application Support Analyst
UK

The median Application Support Analyst salary in the UK is £45,000 per year according to job vacancies posted during the 6 months to 5 December 2023.

The first table below provides salary benchmarking and summary statistics including a comparison to same period in the previous 2 years.

6 months to
5 Dec 2023
Same period 2022 Same period 2021
Rank 371 589 610
Rank change year-on-year +218 +21 -115
Permanent jobs requiring an Applications Support Analyst 417 578 560
As % of all permanent jobs advertised in the UK 0.78% 0.47% 0.44%
As % of the Job Titles category 0.82% 0.49% 0.46%
Number of salaries quoted 259 489 473
10th Percentile £29,950 £28,205 £26,250
25th Percentile £36,250 £32,500 £32,000
Median annual salary (50th Percentile) £45,000 £43,500 £40,000
Median % change year-on-year +3.45% +8.75% +6.67%
75th Percentile £63,750 £51,250 £58,750
90th Percentile £75,000 £60,250 £68,000
UK excluding London median annual salary £40,000 £40,000 £35,000
% change year-on-year - +14.29% +7.69%

All Permanent IT Job Vacancies
UK

The following table is for comparison with the above and includes summary statistics for all permanent IT job vacancies. Most job vacancies include a discernible job title that can be normalized. As such, the figures in the second row provide an indication of the number of permanent jobs in our overall sample.

Permanent vacancies in the UK with a recognized job title 50,985 118,425 121,174
% of permanent jobs with a recognized job title 95.43% 95.37% 95.14%
Number of salaries quoted 37,346 74,222 83,417
10th Percentile £31,250 £32,750 £32,000
25th Percentile £42,500 £45,000 £42,500
Median annual salary (50th Percentile) £60,000 £60,000 £57,500
Median % change year-on-year - +4.35% +4.55%
75th Percentile £80,000 £81,250 £77,500
90th Percentile £97,500 £98,750 £95,000
UK excluding London median annual salary £52,500 £52,500 £50,000
% change year-on-year - +5.00% +5.26%

Applications Support Analyst
Job Vacancy Trend

Job postings that featured Applications Support Analyst in the job title as a proportion of all IT jobs advertised.
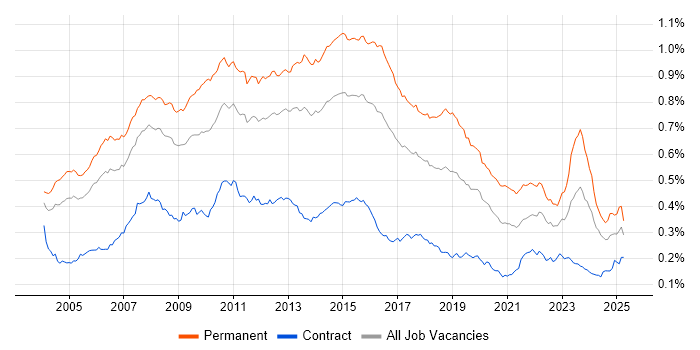
Job vacancy trend for Applications Support Analyst in the UK

Applications Support Analyst
Salary Trend

3-month moving average salary quoted in jobs citing Applications Support Analyst.

Salary trend for Applications Support Analyst in the UK

Applications Support Analyst
Salary Histogram

Salary distribution for jobs citing Applications Support Analyst over the 6 months to 5 December 2023.

Salary histogram for Applications Support Analyst in the UK

Applications Support Analyst
Top 17 Job Locations

The table below looks at the demand and provides a guide to the median salaries quoted in IT jobs citing Applications Support Analyst within the UK over the 6 months to 5 December 2023. The 'Rank Change' column provides an indication of the change in demand within each location based on the same 6 month period last year.

Location Rank Change
on Same Period
Last Year
Matching
Permanent
IT Job Ads
Median Salary
Past 6 Months
Median Salary
% Change
on Same Period
Last Year
Live
Jobs
England +161 297 £43,500 - 101
UK excluding London +185 285 £40,000 - 63
Work from Home +147 179 £54,648 +27.09% 51
London +168 126 £62,500 +26.26% 39
Wales +85 72 - -
South East +124 62 £37,500 - 20
North of England +111 50 £42,500 +13.33% 16
Scotland +71 38 £62,500 +47.06% 4
North West +117 33 £44,250 +10.63% 10
East of England +125 27 £37,500 +7.91% 13
Midlands +107 20 £30,500 -35.79% 6
Yorkshire +76 15 £42,500 +21.44% 4
West Midlands +108 13 £30,500 -35.79% 2
South West +37 10 £35,000 -22.22% 5
East Midlands +37 7 £25,000 -47.37% 4
Northern Ireland +43 6 £58,750 +46.88% 1
North East +42 2 £42,500 +21.43% 2

Applications Support Analyst Skill Set
Top 30 Co-occurring Skills and Capabilities

For the 6 months to 5 December 2023, Applications Support Analyst job roles required the following skills and capabilities in order of popularity. The figures indicate the absolute number co-occurrences and as a proportion of all permanent job ads featuring Applications Support Analyst in the job title.

1 220 (52.76%) ITIL
2 196 (47.00%) SQL
3 167 (40.05%) Problem-Solving
4 154 (36.93%) SQL Server
5 149 (35.73%) Microsoft
6 146 (35.01%) Social Skills
7 140 (33.57%) Oracle
8 139 (33.33%) Service Management
9 138 (33.09%) Unix
10 136 (32.61%) Analytical Skills
11 134 (32.13%) Actionable Insight
12 126 (30.22%) Finance
13 116 (27.82%) SLA
14 114 (27.34%) SC Cleared
14 114 (27.34%) Security Cleared
15 109 (26.14%) Incident Management
16 108 (25.90%) Java
17 101 (24.22%) JIRA
18 93 (22.30%) Windows
19 91 (21.82%) WebLogic
20 88 (21.10%) Impact Assessments
21 84 (20.14%) J2EE
21 84 (20.14%) Information Management
22 83 (19.90%) Spring
22 83 (19.90%) Enterprise Architecture
22 83 (19.90%) Java EE
22 83 (19.90%) Containerisation
22 83 (19.90%) Single Sign-On
22 83 (19.90%) OpenSSO
22 83 (19.90%) Elasticsearch

Applications Support Analyst Skill Set
Co-occurring Skills and Capabilities by Category

The follow tables expand on the table above by listing co-occurrences grouped by category. The same employment type, locality and period is covered with up to 20 co-occurrences shown in each of the following categories:

Application Platforms
1 91 (21.82%) WebLogic
2 34 (8.15%) IIS
3 33 (7.91%) SharePoint
4 14 (3.36%) WebSphere
4 14 (3.36%) WebSphere Application Server
5 8 (1.92%) Oracle Service Bus
6 4 (0.96%) Confluence
7 1 (0.24%) Alfresco
7 1 (0.24%) NetWeaver
Applications
1 19 (4.56%) Microsoft Office
2 17 (4.08%) Microsoft Excel
3 8 (1.92%) MS Visio
4 1 (0.24%) AutoCAD
4 1 (0.24%) ProjectWise
Business Applications
1 45 (10.79%) Dynamics CRM
2 35 (8.39%) PlanetPress Connect
3 12 (2.88%) Fidessa
4 9 (2.16%) iTrent
5 8 (1.92%) Remedy ITSM
6 5 (1.20%) Infor SunSystems
6 5 (1.20%) NetSuite
7 4 (0.96%) Dynamics NAV
8 3 (0.72%) Epicor Tropos
9 2 (0.48%) Dynamics AX
9 2 (0.48%) ION Anvil
10 1 (0.24%) Dynamics GP
10 1 (0.24%) Endur
10 1 (0.24%) Oracle EBS
10 1 (0.24%) Primavera
10 1 (0.24%) SAP ERP
10 1 (0.24%) SAP S/4HANA
10 1 (0.24%) Temenos T24
10 1 (0.24%) thinkFolio
10 1 (0.24%) Workfront
Cloud Services
1 51 (12.23%) Azure
2 33 (7.91%) Power Platform
3 25 (6.00%) Microsoft 365
4 24 (5.76%) Dynamics 365
5 21 (5.04%) Azure DevOps
6 20 (4.80%) AWS
7 10 (2.40%) PowerApps
8 7 (1.68%) Azure Service Bus
9 5 (1.20%) SaaS
9 5 (1.20%) WhatsApp
10 4 (0.96%) OneDrive
11 3 (0.72%) IaaS
11 3 (0.72%) Power Automate
12 2 (0.48%) Azure Data Factory
12 2 (0.48%) ShareGate
13 1 (0.24%) Azure Logic Apps
13 1 (0.24%) Azure Monitor
13 1 (0.24%) Cloud Computing
13 1 (0.24%) iPaaS
13 1 (0.24%) Zapier
Communications & Networking
1 13 (3.12%) Firewall
2 12 (2.88%) DHCP
2 12 (2.88%) DNS
2 12 (2.88%) FIX Connectivity
2 12 (2.88%) TCP/IP
3 5 (1.20%) HTTP
4 3 (0.72%) Network Security
4 3 (0.72%) Software-Defined Networking
5 2 (0.48%) Intranet
6 1 (0.24%) FTP
Database & Business Intelligence
1 154 (36.93%) SQL Server
2 83 (19.90%) Elasticsearch
3 32 (7.67%) Data Warehouse
4 23 (5.52%) Power BI
5 15 (3.60%) BusinessObjects
6 14 (3.36%) BusinessObjects Business Intelligence
6 14 (3.36%) MySQL
7 10 (2.40%) Oracle Database
8 9 (2.16%) PostgreSQL
8 9 (2.16%) RDBMS
8 9 (2.16%) Relational Database
8 9 (2.16%) SQL Server Integration Services
8 9 (2.16%) SQL Server Reporting Services
9 8 (1.92%) Oracle Database 10g
9 8 (1.92%) Oracle Database 11g
9 8 (1.92%) VLDB
10 7 (1.68%) Redis
11 5 (1.20%) SQL Server Analysis Services
12 3 (0.72%) NoSQL
13 2 (0.48%) Crystal Reports
Development Applications
1 101 (24.22%) JIRA
2 29 (6.95%) SQL Server Management Studio (SSMS)
3 26 (6.24%) GitLab
3 26 (6.24%) Sonatype Nexus
4 22 (5.28%) Git
5 14 (3.36%) Oracle APEX
5 14 (3.36%) Visual Studio Code
6 8 (1.92%) Visual Studio
7 7 (1.68%) MSBuild
8 4 (0.96%) Postman
8 4 (0.96%) SoapUI
9 2 (0.48%) Eclipse
10 1 (0.24%) Browser DevTools
General
1 146 (35.01%) Social Skills
2 136 (32.61%) Analytical Skills
3 126 (30.22%) Finance
4 37 (8.87%) Banking
5 22 (5.28%) Front Office
6 21 (5.04%) Law
7 16 (3.84%) Legal
8 10 (2.40%) Back Office
9 7 (1.68%) Investment Banking
9 7 (1.68%) Retail
10 6 (1.44%) Inclusion and Diversity
11 5 (1.20%) Marketing
11 5 (1.20%) Private Banking
12 4 (0.96%) Documentation Skills
12 4 (0.96%) Manufacturing
12 4 (0.96%) Public Sector
13 3 (0.72%) Financial Institution
13 3 (0.72%) Organisational Skills
13 3 (0.72%) Presentation Skills
14 2 (0.48%) Local Government
Libraries, Frameworks & Software Standards
1 84 (20.14%) J2EE
2 83 (19.90%) Java EE
2 83 (19.90%) Spring
3 72 (17.27%) .NET
4 16 (3.84%) FIX Protocol
5 14 (3.36%) ASP.NET
6 13 (3.12%) .NET Framework
7 11 (2.64%) XML
8 10 (2.40%) RESTful
9 8 (1.92%) JSON
9 8 (1.92%) REST
9 8 (1.92%) SOAP
10 7 (1.68%) ASP.NET MVC
10 7 (1.68%) EDI
11 5 (1.20%) .NET Core
12 4 (0.96%) Middleware
13 1 (0.24%) HTML
13 1 (0.24%) ODBC
13 1 (0.24%) SAP Basis
13 1 (0.24%) Web Services
Miscellaneous
1 13 (3.12%) Eurex
1 13 (3.12%) Self-Motivation
2 12 (2.88%) CCTV
3 9 (2.16%) Management Information System
4 5 (1.20%) Foreign Exchange (FX)
4 5 (1.20%) iSeries
5 4 (0.96%) Product Ownership
6 3 (0.72%) Data Protection Act
6 3 (0.72%) Derivative
6 3 (0.72%) Enterprise Software
6 3 (0.72%) EPoS
6 3 (0.72%) Greenfield Project
7 2 (0.48%) AS400
7 2 (0.48%) Driving Licence
7 2 (0.48%) Fixed Income
7 2 (0.48%) Hedge funds
7 2 (0.48%) Linux Command Line
7 2 (0.48%) Mobile App
7 2 (0.48%) Onboarding
7 2 (0.48%) Virtual Team
Operating Systems
1 138 (33.09%) Unix
2 93 (22.30%) Windows
3 38 (9.11%) Linux
4 31 (7.43%) Windows Server
5 26 (6.24%) Android
6 21 (5.04%) Solaris
7 13 (3.12%) CentOS
8 12 (2.88%) Ubuntu
9 5 (1.20%) Windows 10
10 1 (0.24%) Red Hat Enterprise Linux
10 1 (0.24%) SUSE
Processes & Methodologies
1 220 (52.76%) ITIL
2 167 (40.05%) Problem-Solving
3 139 (33.33%) Service Management
4 134 (32.13%) Actionable Insight
5 109 (26.14%) Incident Management
6 88 (21.10%) Impact Assessments
7 84 (20.14%) Information Management
8 83 (19.90%) Containerisation
8 83 (19.90%) Enterprise Architecture
9 73 (17.51%) Customer Service
10 72 (17.27%) ITSM
11 57 (13.67%) Enterprise Search
12 56 (13.43%) Release Management
13 55 (13.19%) CRM
14 47 (11.27%) Service Delivery
15 41 (9.83%) ERP
16 40 (9.59%) Problem Management
17 39 (9.35%) DevOps
18 38 (9.11%) Business Intelligence
19 33 (7.91%) Document Management
Programming Languages
1 196 (47.00%) SQL
2 108 (25.90%) Java
3 68 (16.31%) PowerShell
4 65 (15.59%) Shell Script
5 48 (11.51%) C#
6 27 (6.47%) T-SQL
7 26 (6.24%) PL/SQL
8 20 (4.80%) Python
9 13 (3.12%) JavaScript
10 12 (2.88%) Bash
10 12 (2.88%) Perl
10 12 (2.88%) Ruby
11 2 (0.48%) C
12 1 (0.24%) ABAP
12 1 (0.24%) COBOL
12 1 (0.24%) RPG
12 1 (0.24%) VBA
Qualifications
1 114 (27.34%) SC Cleared
1 114 (27.34%) Security Cleared
2 51 (12.23%) Degree
3 28 (6.71%) ITIL Certification
4 5 (1.20%) Azure Certification
5 4 (0.96%) Computer Science Degree
5 4 (0.96%) Microsoft Certification
6 3 (0.72%) ACCA
6 3 (0.72%) MCSE
7 2 (0.48%) MCP
7 2 (0.48%) PRINCE2 Practitioner
8 1 (0.24%) BPSS Clearance
8 1 (0.24%) EnCE
8 1 (0.24%) IBM Certification
8 1 (0.24%) ITIL Foundation Certificate
Quality Assurance & Compliance
1 116 (27.82%) SLA
2 21 (5.04%) QA
3 4 (0.96%) Accessibility
4 1 (0.24%) GDPR
4 1 (0.24%) IFRS
4 1 (0.24%) IFRS 17
System Software
1 24 (5.76%) Active Directory
2 8 (1.92%) Oracle RAC
3 1 (0.24%) Docker
Systems Management
1 83 (19.90%) OpenSSO
1 83 (19.90%) Single Sign-On
2 26 (6.24%) AirWatch
3 8 (1.92%) Data Guard
3 8 (1.92%) Oracle RMAN
4 3 (0.72%) Grafana
4 3 (0.72%) Kibana
4 3 (0.72%) Kubernetes
4 3 (0.72%) Prometheus
5 2 (0.48%) Control-M
Vendors
1 149 (35.73%) Microsoft
2 140 (33.57%) Oracle
3 66 (15.83%) Remedy
4 34 (8.15%) ServiceNow
5 29 (6.95%) FNZ
6 18 (4.32%) Bloomberg
7 15 (3.60%) ION Trading
8 14 (3.36%) Red Hat
9 13 (3.12%) Reuters
9 13 (3.12%) Trayport
10 12 (2.88%) CQG
10 12 (2.88%) Patsystems
10 12 (2.88%) Sun
11 7 (1.68%) IBM
11 7 (1.68%) SAP
12 5 (1.20%) Cognos
13 4 (0.96%) Aderant
13 4 (0.96%) iManage
13 4 (0.96%) Salesforce
14 3 (0.72%) Epicor