Back Office
UK

The table below looks at the prevalence of the term Back Office in permanent job vacancies. Included is a benchmarking guide to the salaries offered in vacancies that have cited Back Office over the 6 months to 29 November 2023 with a comparison to the same period over the previous 2 years.

6 months to
29 Nov 2023
Same period 2022 Same period 2021
Rank 364 430 444
Rank change year-on-year +66 +14 -81
Permanent jobs citing Back Office 418 947 943
As % of all permanent jobs advertised in the UK 0.77% 0.75% 0.73%
As % of the General category 1.17% 1.10% 1.22%
Number of salaries quoted 322 632 652
10th Percentile £41,250 £36,325 £32,252
25th Percentile £53,750 £46,250 £41,250
Median annual salary (50th Percentile) £75,000 £70,000 £65,750
Median % change year-on-year +7.14% +6.46% -12.33%
75th Percentile £90,000 £86,250 £87,500
90th Percentile £114,750 £95,900 £110,000
UK excluding London median annual salary £60,000 £50,000 £42,750
% change year-on-year +20.00% +16.96% +9.62%

All General Skills
UK

Back Office is in the General Skills category. The following table is for comparison with the above and provides summary statistics for all permanent job vacancies with a requirement for common skills.

Permanent vacancies with a requirement for common skills 35,601 86,161 77,362
As % of all permanent jobs advertised in the UK 65.80% 68.47% 59.94%
Number of salaries quoted 24,969 49,279 47,539
10th Percentile £30,750 £32,500 £31,500
25th Percentile £42,500 £45,000 £42,000
Median annual salary (50th Percentile) £60,000 £60,000 £57,500
Median % change year-on-year - +4.35% +4.55%
75th Percentile £80,000 £82,500 £78,750
90th Percentile £100,000 £100,000 £97,500
UK excluding London median annual salary £50,000 £52,500 £49,000
% change year-on-year -4.76% +7.14% +3.16%

Back Office
Job Vacancy Trend

Job postings citing Back Office as a proportion of all IT jobs advertised.
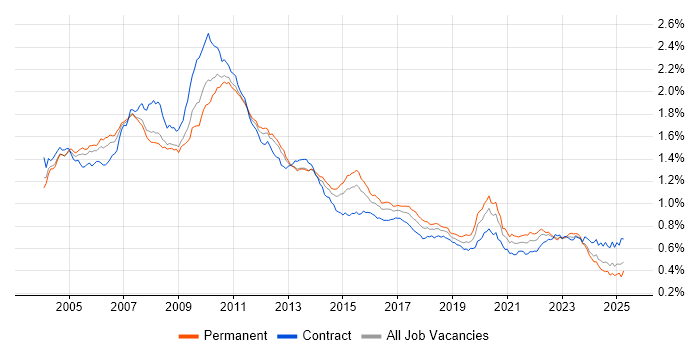
Job vacancy trend for Back Office in the UK

Back Office
Salary Trend

3-month moving average salary quoted in jobs citing Back Office.

Salary trend for Back Office in the UK

Back Office
Salary Histogram

Salary distribution for jobs citing Back Office over the 6 months to 29 November 2023.

Salary histogram for Back Office in the UK

Back Office
Top 16 Job Locations

The table below looks at the demand and provides a guide to the median salaries quoted in IT jobs citing Back Office within the UK over the 6 months to 29 November 2023. The 'Rank Change' column provides an indication of the change in demand within each location based on the same 6 month period last year.

Location Rank Change
on Same Period
Last Year
Matching
Permanent
IT Job Ads
Median Salary
Past 6 Months
Median Salary
% Change
on Same Period
Last Year
Live
Jobs
England +97 390 £75,000 +20.00% 274
London +124 237 £82,500 +13.79% 144
UK excluding London +69 174 £60,000 +20.00% 154
Work from Home 0 155 £77,500 +10.71% 83
North of England +139 90 £60,000 +26.32% 44
Yorkshire +103 65 £47,500 - 12
South East +78 30 £63,750 +15.91% 37
North West +107 23 £62,000 +15.35% 25
Scotland +58 21 £50,000 -13.04% 15
Midlands +89 19 £60,000 +17.92% 29
West Midlands +80 10 £70,000 +37.57% 18
East Midlands +47 9 £57,500 +1.77% 11
East of England +102 6 £36,859 +47.43% 9
South West +23 5 £50,000 +2.56% 20
Wales +5 3 £78,500 +49.52% 4
North East +41 2 £46,875 +7.14% 8

Back Office
Co-occurring Skills and Capabilities by Category

The follow tables expand on the table above by listing co-occurrences grouped by category. The same employment type, locality and period is covered with up to 20 co-occurrences shown in each of the following categories:

Application Platforms
1 7 (1.67%) IIS
2 4 (0.96%) Confluence
3 3 (0.72%) MS Exchange
3 3 (0.72%) Skype for Business
4 2 (0.48%) Exchange Server 2010
4 2 (0.48%) JBoss
4 2 (0.48%) Oracle SOA Suite
4 2 (0.48%) SharePoint
Applications
1 15 (3.59%) Microsoft Office
2 14 (3.35%) Microsoft Excel
3 8 (1.91%) Microsoft PowerPoint
4 6 (1.44%) Microsoft Project
5 1 (0.24%) MS Visio
5 1 (0.24%) Oracle Smart View
5 1 (0.24%) Spreadsheet
Business Applications
1 43 (10.29%) Oracle ERP
2 19 (4.55%) SAP S/4HANA
3 8 (1.91%) Dynamics CRM
3 8 (1.91%) Endur
4 7 (1.67%) Oracle EBS
4 7 (1.67%) Oracle EBS R12
5 6 (1.44%) Aladdin
6 5 (1.20%) Bloomberg AIM
6 5 (1.20%) Dynamics GP
6 5 (1.20%) OpenLink RightAngle
6 5 (1.20%) SimCorp Dimension
7 4 (0.96%) Fidessa
7 4 (0.96%) Oracle Financials
7 4 (0.96%) Oracle Receivables
7 4 (0.96%) SAP Oil and Gas
8 3 (0.72%) ION Anvil
8 3 (0.72%) NetSuite
9 2 (0.48%) ION MarketView
10 1 (0.24%) Bloomberg TOMS
10 1 (0.24%) Remedy ITSM
Cloud Services
1 69 (16.51%) Azure
2 49 (11.72%) AWS
3 39 (9.33%) SaaS
4 30 (7.18%) Microsoft 365
5 14 (3.35%) Azure DevOps
6 12 (2.87%) GCP
7 11 (2.63%) Entra ID
8 10 (2.39%) Dynamics 365
9 9 (2.15%) Power Platform
10 6 (1.44%) IaaS
11 5 (1.20%) Azure Data Factory
11 5 (1.20%) Azure Logic Apps
11 5 (1.20%) PaaS
12 4 (0.96%) Azure Monitor
12 4 (0.96%) Azure Storage
12 4 (0.96%) PowerApps
12 4 (0.96%) WhatsApp
13 2 (0.48%) Boomi
13 2 (0.48%) SuccessFactors
14 1 (0.24%) Snowflake
Communications & Networking
1 18 (4.31%) Firewall
2 14 (3.35%) Wi-Fi
3 13 (3.11%) DHCP
3 13 (3.11%) DNS
4 9 (2.15%) Internet
5 6 (1.44%) SAN
5 6 (1.44%) TCP/IP
6 5 (1.20%) LAN
6 5 (1.20%) Network Security
6 5 (1.20%) Remote Desktop
6 5 (1.20%) VPN
6 5 (1.20%) WAN
6 5 (1.20%) Wireshark
7 4 (0.96%) Intrusion Detection
7 4 (0.96%) Wireless
8 3 (0.72%) 3GPP
8 3 (0.72%) 5G
8 3 (0.72%) 5G NR
8 3 (0.72%) LTE
8 3 (0.72%) MIMO
Database & Business Intelligence
1 45 (10.77%) Oracle Reports
2 39 (9.33%) SQL Server
3 10 (2.39%) MongoDB
4 9 (2.15%) Elasticsearch
5 7 (1.67%) MySQL
5 7 (1.67%) Relational Database
6 6 (1.44%) Power BI
6 6 (1.44%) SQL Server Integration Services
6 6 (1.44%) SQL Server Reporting Services
7 5 (1.20%) Data Warehouse
7 5 (1.20%) RDBMS
8 4 (0.96%) Amazon RDS
8 4 (0.96%) GIS
8 4 (0.96%) NoSQL
9 2 (0.48%) Oracle Database
9 2 (0.48%) SAP HANA
9 2 (0.48%) SQL Server Analysis Services
10 1 (0.24%) BusinessObjects
10 1 (0.24%) Microsoft Analysis Services
10 1 (0.24%) SAP BW
Development Applications
1 12 (2.87%) Jenkins
1 12 (2.87%) JIRA
1 12 (2.87%) Maven
2 9 (2.15%) Git
3 5 (1.20%) NUnit
4 3 (0.72%) Visual Studio
5 2 (0.48%) Selenium
5 2 (0.48%) Visual Studio Code
6 1 (0.24%) Bitbucket
6 1 (0.24%) MSTest
6 1 (0.24%) Octopus Deploy
6 1 (0.24%) SoapUI
6 1 (0.24%) SpecFlow
6 1 (0.24%) TestRail
General
1 250 (59.81%) Finance
2 92 (22.01%) Social Skills
3 65 (15.55%) Front Office
4 52 (12.44%) Banking
5 31 (7.42%) Retail
6 25 (5.98%) Analytical Skills
6 25 (5.98%) Billing
7 20 (4.78%) Public Sector
8 19 (4.55%) Legal
9 12 (2.87%) Financial Institution
9 12 (2.87%) Inclusion and Diversity
9 12 (2.87%) Presentation Skills
10 10 (2.39%) Marketing
11 9 (2.15%) Investment Banking
11 9 (2.15%) Law
12 7 (1.67%) Documentation Skills
13 6 (1.44%) Influencing Skills
13 6 (1.44%) Organisational Skills
13 6 (1.44%) Publishing
13 6 (1.44%) Telecoms
Job Titles
1 96 (22.97%) Senior
2 94 (22.49%) Analyst
3 55 (13.16%) Business Analyst
4 48 (11.48%) Senior Manager
5 44 (10.53%) Developer
6 42 (10.05%) Enterprise Architecture Manager
6 42 (10.05%) Senior Strategy Manager
6 42 (10.05%) Strategy Manager
7 33 (7.89%) Lead
8 28 (6.70%) Applications Support
9 24 (5.74%) Project Manager
10 21 (5.02%) Consultant
10 21 (5.02%) IT Manager
11 19 (4.55%) Support Engineer
12 17 (4.07%) Support Analyst
13 15 (3.59%) Technical Analyst
14 14 (3.35%) Infrastructure Engineer
14 14 (3.35%) Java Developer
15 13 (3.11%) C# Developer
15 13 (3.11%) Senior Analyst
Libraries, Frameworks & Software Standards
1 42 (10.05%) Oracle Fusion
2 32 (7.66%) .NET
3 28 (6.70%) Middleware
4 22 (5.26%) AngularJS
5 18 (4.31%) FIX Protocol
6 17 (4.07%) HTML
7 16 (3.83%) ASP.NET
7 16 (3.83%) CSS
8 14 (3.35%) JPA
8 14 (3.35%) RESTful
8 14 (3.35%) Spring
8 14 (3.35%) XML
9 13 (3.11%) Hibernate
10 12 (2.87%) Apache Camel
10 12 (2.87%) Spring Boot
11 8 (1.91%) CSS3
12 7 (1.67%) jQuery
12 7 (1.67%) React
13 6 (1.44%) .NET Framework
13 6 (1.44%) FpML
Miscellaneous
1 34 (8.13%) Reference Data
2 26 (6.22%) Fixed Income
3 23 (5.50%) Derivative
3 23 (5.50%) Hedge funds
4 19 (4.55%) Product Ownership
5 18 (4.31%) Self-Motivation
6 16 (3.83%) Public Cloud
7 14 (3.35%) Data Protection Act
7 14 (3.35%) Onboarding
8 13 (3.11%) Data Centre
8 13 (3.11%) Equities
9 12 (2.87%) Cloud Native
9 12 (2.87%) EPoS
9 12 (2.87%) Foreign Exchange (FX)
9 12 (2.87%) Management Information System
10 11 (2.63%) Blockchain
10 11 (2.63%) Culture of Ownership
10 11 (2.63%) Enterprise Software
10 11 (2.63%) Hybrid Cloud
11 8 (1.91%) SWIFT Messaging Network
Operating Systems
1 52 (12.44%) Windows
2 29 (6.94%) Linux
3 20 (4.78%) Windows Server
4 8 (1.91%) Unix
5 7 (1.67%) Windows 10
5 7 (1.67%) Windows Server 2016
6 4 (0.96%) Windows Server 2012
6 4 (0.96%) Windows Server 2019
7 3 (0.72%) Windows 7
7 3 (0.72%) Windows Server 2008
8 2 (0.48%) HPUX
9 1 (0.24%) Android
9 1 (0.24%) Apple iOS
9 1 (0.24%) Solaris
9 1 (0.24%) Ubuntu
9 1 (0.24%) VMS
Processes & Methodologies
1 99 (23.68%) Agile
2 83 (19.86%) ITIL
3 65 (15.55%) ERP
4 63 (15.07%) Problem-Solving
5 59 (14.11%) People Management
6 51 (12.20%) Stakeholder Management
7 47 (11.24%) Roadmaps
8 42 (10.05%) Data Privacy
8 42 (10.05%) Lean Six Sigma
8 42 (10.05%) Six Sigma
9 38 (9.09%) DevOps
9 38 (9.09%) Service Delivery
9 38 (9.09%) Waterfall
10 34 (8.13%) Migration
10 34 (8.13%) Project Management
11 32 (7.66%) Asset Management
12 30 (7.18%) Analytics
13 29 (6.94%) Customer Service
13 29 (6.94%) Mentoring
13 29 (6.94%) Product Roadmap
Programming Languages
1 92 (22.01%) SQL
2 44 (10.53%) C#
3 34 (8.13%) JavaScript
4 29 (6.94%) Python
5 28 (6.70%) PowerShell
6 26 (6.22%) Java
7 9 (2.15%) TypeScript
8 6 (1.44%) Perl
9 5 (1.20%) T-SQL
9 5 (1.20%) VB
9 5 (1.20%) VB.NET
10 4 (0.96%) PHP
10 4 (0.96%) VBA
11 3 (0.72%) Bash
11 3 (0.72%) C
11 3 (0.72%) C++
12 1 (0.24%) Kotlin
12 1 (0.24%) PL/SQL
Qualifications
1 81 (19.38%) Degree
2 15 (3.59%) Computer Science Degree
3 9 (2.15%) BPSS Clearance
4 7 (1.67%) Microsoft Certification
5 6 (1.44%) ITIL Certification
5 6 (1.44%) Master's Degree
6 5 (1.20%) Security Cleared
7 4 (0.96%) DV Cleared
7 4 (0.96%) PMI Certification
8 3 (0.72%) PhD
8 3 (0.72%) SC Cleared
9 2 (0.48%) Cisco Certification
9 2 (0.48%) ISEB
10 1 (0.24%) APMP
10 1 (0.24%) CBAP
10 1 (0.24%) CCNA
10 1 (0.24%) CCNP
10 1 (0.24%) Dell Certification
10 1 (0.24%) IIBA
10 1 (0.24%) PMP
Quality Assurance & Compliance
1 46 (11.00%) GDPR
2 44 (10.53%) Sarbanes-Oxley
3 16 (3.83%) QA
4 9 (2.15%) PMO
4 9 (2.15%) SLA
5 8 (1.91%) ISO/IEC 27001
6 5 (1.20%) Data Quality
7 3 (0.72%) ISO/IEC 20000
7 3 (0.72%) NCSC
7 3 (0.72%) NIST
8 2 (0.48%) MiFID
9 1 (0.24%) COBIT
9 1 (0.24%) Cyber Essentials
9 1 (0.24%) EMIR
9 1 (0.24%) GRC
System Software
1 28 (6.70%) Active Directory
2 16 (3.83%) VMware Infrastructure
3 6 (1.44%) Virtual Servers
4 3 (0.72%) Docker
4 3 (0.72%) KVM
5 2 (0.48%) Hyper-V
6 1 (0.24%) Forefront TMG
6 1 (0.24%) Terminal Services
6 1 (0.24%) VMware Workstation
6 1 (0.24%) vSphere
6 1 (0.24%) XenApp
Systems Management
1 16 (3.83%) SCCM
2 10 (2.39%) SCOM
3 4 (0.96%) Microsoft Intune
4 3 (0.72%) EMC NetWorker
5 2 (0.48%) Control-M
5 2 (0.48%) Kubernetes
6 1 (0.24%) Cisco Prime
6 1 (0.24%) Forefront Identity Manager
6 1 (0.24%) Grafana
6 1 (0.24%) Microsoft Clustering
6 1 (0.24%) MOM
6 1 (0.24%) Nagios
6 1 (0.24%) Single Sign-On
6 1 (0.24%) WSUS
Vendors
1 86 (20.57%) Microsoft
2 72 (17.22%) Oracle
3 29 (6.94%) SAP
4 26 (6.22%) Cisco
5 22 (5.26%) Bloomberg
6 20 (4.78%) VMware
7 12 (2.87%) Charles River
8 9 (2.15%) Citrix
8 9 (2.15%) ServiceNow
9 8 (1.91%) Sybase
10 7 (1.67%) OpenLink
11 5 (1.20%) ION Trading
11 5 (1.20%) Meraki
11 5 (1.20%) Salesforce
11 5 (1.20%) SimCorp
11 5 (1.20%) TIBCO
12 4 (0.96%) Calypso
12 4 (0.96%) Dell
12 4 (0.96%) Murex
13 3 (0.72%) Blue Prism