Unit Testing Jobs

Unit Testing
UK

The table below provides summary statistics for permanent job vacancies requiring Unit Testing skills. It includes a benchmarking guide to the annual salaries offered in vacancies that cited Unit Testing over the 6 months leading up to 26 October 2024, comparing them to the same period in the previous two years.

6 months to
26 Oct 2024
Same period 2023 Same period 2022
Rank 257 174 126
Rank change year-on-year -83 -48 -3
Permanent jobs citing Unit Testing 800 1,225 4,191
As % of all permanent jobs advertised in the UK 1.05% 2.09% 2.97%
As % of the Processes & Methodologies category 1.25% 2.21% 3.09%
Number of salaries quoted 352 730 1,639
10th Percentile £42,500 £45,000 £42,500
25th Percentile £52,500 £48,250 £50,000
Median annual salary (50th Percentile) £65,000 £60,000 £65,000
Median % change year-on-year +8.33% -7.69% +13.04%
75th Percentile £80,000 £71,250 £82,500
90th Percentile £97,250 £90,000 £108,750
UK excluding London median annual salary £60,000 £55,000 £57,500
% change year-on-year +9.09% -4.35% +12.75%

All Process and Methodology Skills
UK

Unit Testing falls under the Processes and Methodologies category. For comparison with the information above, the following table provides summary statistics for all permanent job vacancies requiring process or methodology skills.

Permanent vacancies with a requirement for process or methodology skills 63,908 55,391 135,614
As % of all permanent jobs advertised in the UK 84.07% 94.35% 96.13%
Number of salaries quoted 30,608 39,736 76,629
10th Percentile £34,000 £32,500 £34,000
25th Percentile £45,000 £44,497 £45,000
Median annual salary (50th Percentile) £60,000 £60,000 £60,000
Median % change year-on-year - - +4.35%
75th Percentile £77,500 £80,000 £81,000
90th Percentile £97,250 £97,500 £98,750
UK excluding London median annual salary £54,125 £52,500 £52,500
% change year-on-year +3.10% - +5.00%

Unit Testing
Job Vacancy Trend

Job postings citing Unit Testing as a proportion of all IT jobs advertised.
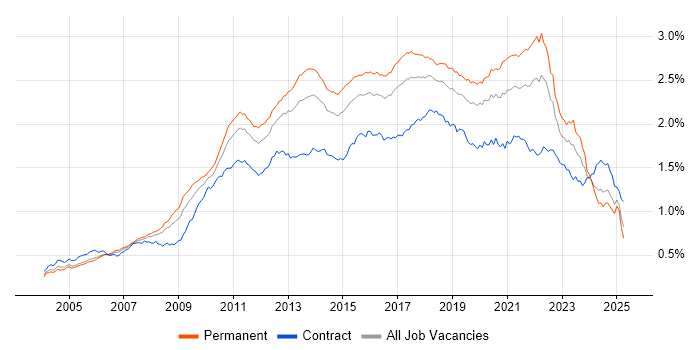
Job vacancy trend for Unit Testing in the UK

Unit Testing
Salary Trend

3-month moving average salary quoted in jobs citing Unit Testing.

Salary trend for Unit Testing in the UK

Unit Testing
Salary Histogram

Salary distribution for jobs citing Unit Testing over the 6 months to 26 October 2024.

Salary histogram for Unit Testing in the UK

Unit Testing
Top 17 Job Locations

The table below looks at the demand and provides a guide to the median salaries quoted in IT jobs citing Unit Testing within the UK over the 6 months to 26 October 2024. The 'Rank Change' column provides an indication of the change in demand within each location based on the same 6 month period last year.

Location Rank Change
on Same Period
Last Year
Matching
Permanent
IT Job Ads
Median Salary
Past 6 Months
Median Salary
% Change
on Same Period
Last Year
Live
Jobs
England -82 750 £65,000 +8.33% 188
UK excluding London -121 487 £60,000 +9.09% 131
Work from Home -153 288 £64,488 +9.30% 223
London -15 278 £75,000 +15.38% 69
North of England -37 174 £54,000 +2.86% 47
North West -19 127 £62,500 +20.19% 32
South East -102 107 £58,750 -2.08% 19
Midlands -62 87 £60,000 +3.45% 14
South West -51 54 £48,918 -14.18% 24
West Midlands -34 43 £65,000 +30.00% 8
East Midlands -54 43 £50,000 -16.67% 6
Scotland -39 31 £66,250 +20.45% 7
Yorkshire -36 29 £47,500 -15.56% 7
East of England -39 28 £70,000 +7.69% 12
North East -19 18 £45,000 +45.16% 8
Northern Ireland -3 8 £60,000 +20.00% 5
Wales +5 3 £66,250 +35.06% 6

Unit Testing
Co-occurring Skills and Capabilities by Category

The follow tables expand on the table above by listing co-occurrences grouped by category. The same employment type, locality and period is covered with up to 20 co-occurrences shown in each of the following categories:

Application Platforms
1 33 (4.13%) Confluence
2 16 (2.00%) Apache
2 16 (2.00%) CMS
3 12 (1.50%) Apache Spark
4 8 (1.00%) CICS
5 7 (0.88%) SharePoint
6 6 (0.75%) IIS
7 5 (0.63%) Microsoft Exchange
8 4 (0.50%) Appian
8 4 (0.50%) Cloud Foundry
9 3 (0.38%) Camunda
10 2 (0.25%) Drupal
10 2 (0.25%) nginx
10 2 (0.25%) Sitecore CMS
10 2 (0.25%) Tomcat
11 1 (0.13%) DataSynapse
11 1 (0.13%) FileNet
11 1 (0.13%) JBoss
11 1 (0.13%) Oracle SOA Suite
Applications
1 14 (1.75%) Simulink
2 8 (1.00%) Stateflow
3 7 (0.88%) OrCAD
4 6 (0.75%) Spreadsheet
5 5 (0.63%) Microsoft Office
5 5 (0.63%) Photoshop
6 4 (0.50%) Adobe XD
6 4 (0.50%) CANalyzer
6 4 (0.50%) Microsoft Excel
6 4 (0.50%) MS Visio
7 2 (0.25%) Microsoft PowerPoint
7 2 (0.25%) Trello
8 1 (0.13%) Microsoft Project
8 1 (0.13%) Windchill
Business Applications
1 12 (1.50%) SDL Web 8
2 11 (1.38%) Dynamics CRM
3 5 (0.63%) SAP S/4HANA
4 3 (0.38%) Oracle EBS
4 3 (0.38%) SAP CO
4 3 (0.38%) SAP FI
4 3 (0.38%) SAP FI/CO
5 2 (0.25%) BPCS
5 2 (0.25%) SAP ERP
5 2 (0.25%) SAP PS
5 2 (0.25%) Shopify
6 1 (0.13%) Maximo
6 1 (0.13%) NEC Housing
6 1 (0.13%) Temenos T24
Cloud Services
1 272 (34.00%) Azure
2 268 (33.50%) AWS
3 73 (9.13%) Serverless
4 70 (8.75%) Azure DevOps
5 67 (8.38%) GCP
6 63 (7.88%) Amazon Kinesis
7 61 (7.63%) SaaS
8 50 (6.25%) AWS Lambda
9 38 (4.75%) Azure Functions
9 38 (4.75%) Power Platform
10 33 (4.13%) Dynamics 365
11 31 (3.88%) PowerApps
12 25 (3.13%) GitHub
13 20 (2.50%) Amazon EKS
14 18 (2.25%) Power Automate
15 15 (1.88%) Azure Cosmos DB
15 15 (1.88%) Azure Data Factory
15 15 (1.88%) Figma
16 14 (1.75%) Microsoft 365
17 13 (1.63%) Amazon EC2
Communications & Networking
1 30 (3.75%) HTTP
2 8 (1.00%) Ethernet
3 5 (0.63%) Bluetooth
3 5 (0.63%) DNS
3 5 (0.63%) Firewall
3 5 (0.63%) IPv6
3 5 (0.63%) Modbus
3 5 (0.63%) Reverse Proxy
3 5 (0.63%) RS-485
4 4 (0.50%) TCP/IP
5 3 (0.38%) 4G
5 3 (0.38%) 5G
5 3 (0.38%) Internet
5 3 (0.38%) LoRaWAN
5 3 (0.38%) MQTT
5 3 (0.38%) Network Security
5 3 (0.38%) RS-232
5 3 (0.38%) Wireless
6 2 (0.25%) RS-422
6 2 (0.25%) SNMP
Database & Business Intelligence
1 134 (16.75%) NoSQL
2 133 (16.63%) SQL Server
3 116 (14.50%) PostgreSQL
4 68 (8.50%) DynamoDB
5 60 (7.50%) Redis
6 59 (7.38%) Amazon Aurora
7 40 (5.00%) Relational Database
8 32 (4.00%) MongoDB
9 30 (3.75%) MySQL
10 25 (3.13%) Elasticsearch
11 14 (1.75%) Data Warehouse
12 13 (1.63%) Amazon RDS
12 13 (1.63%) Big Data
12 13 (1.63%) Power BI
13 12 (1.50%) Data Lake
14 9 (1.13%) SQL Server Integration Services
15 8 (1.00%) Azure SQL Database
16 7 (0.88%) Looker
16 7 (0.88%) SQLite
17 6 (0.75%) SQL Server Reporting Services
Development Applications
1 161 (20.13%) Git
2 82 (10.25%) Jenkins
3 64 (8.00%) JIRA
4 51 (6.38%) Gatling
5 43 (5.38%) Visual Studio
6 42 (5.25%) JUnit
7 40 (5.00%) GitLab
8 35 (4.38%) Maven
9 30 (3.75%) Gradle
9 30 (3.75%) Mockito
10 26 (3.25%) Sonatype Nexus
11 23 (2.88%) Moq
12 20 (2.50%) MSTest
13 18 (2.25%) JMeter
13 18 (2.25%) NUnit
14 17 (2.13%) Cypress.io
15 16 (2.00%) Cucumber
16 15 (1.88%) Octopus Deploy
17 13 (1.63%) LabVIEW
17 13 (1.63%) SonarQube
General
1 238 (29.75%) Social Skills
2 123 (15.38%) Finance
3 66 (8.25%) Electronics
4 50 (6.25%) Analytical Skills
5 47 (5.88%) Marketing
6 41 (5.13%) Billing
7 36 (4.50%) Public Sector
8 31 (3.88%) Retail
9 30 (3.75%) Manufacturing
10 29 (3.63%) Automotive
11 26 (3.25%) Inclusion and Diversity
12 18 (2.25%) Telecoms
13 17 (2.13%) Law
13 17 (2.13%) Tech for Good
14 15 (1.88%) Front Office
15 12 (1.50%) Banking
16 11 (1.38%) Games
17 10 (1.25%) Military
18 8 (1.00%) Publishing
19 7 (0.88%) Aerospace
Job Titles
1 393 (49.13%) Developer
2 279 (34.88%) Senior
3 237 (29.63%) Software Engineer
4 151 (18.88%) Senior Developer
5 92 (11.50%) C# Developer
6 88 (11.00%) .NET Developer
7 81 (10.13%) Lead
8 74 (9.25%) Senior Software Engineer
9 49 (6.13%) C# .NET Developer
10 47 (5.88%) Software Developer
11 41 (5.13%) Java Developer
12 40 (5.00%) Full-Stack Developer
13 36 (4.50%) Senior .NET Developer
14 30 (3.75%) Lead Software Engineer
14 30 (3.75%) Senior C# Developer
15 28 (3.50%) Azure Developer
16 23 (2.88%) SQL Developer
17 21 (2.63%) Architect
18 20 (2.50%) Angular Developer
19 19 (2.38%) C# Software Engineer
Libraries, Frameworks & Software Standards
1 287 (35.88%) .NET
2 137 (17.13%) RESTful
3 132 (16.50%) REST
4 129 (16.13%) React
5 126 (15.75%) AngularJS
6 125 (15.63%) .NET Core
7 123 (15.38%) HTML
8 121 (15.13%) Web Services
9 106 (13.25%) CSS
10 91 (11.38%) GraphQL
11 89 (11.13%) ASP.NET
12 76 (9.50%) .NET Framework
13 72 (9.00%) Kafka
14 58 (7.25%) Entity Framework
14 58 (7.25%) Spring
15 54 (6.75%) ASP.NET Web API
15 54 (6.75%) http4s
15 54 (6.75%) Scalaz
16 47 (5.88%) RabbitMQ
17 46 (5.75%) Blazor
Miscellaneous
1 81 (10.13%) Distributed Systems
2 60 (7.50%) Blog
2 60 (7.50%) Media Streaming
3 38 (4.75%) Greenfield Project
4 36 (4.50%) Product Ownership
4 36 (4.50%) Self-Motivation
5 32 (4.00%) Mobile App
6 18 (2.25%) Algorithms
6 18 (2.25%) Management Information System
7 16 (2.00%) Hedge funds
8 14 (1.75%) Distributed Architecture
9 13 (1.63%) Enterprise Software
9 13 (1.63%) Legacy Systems
10 12 (1.50%) Legacy Code
11 10 (1.25%) Acoustics
12 9 (1.13%) IoT
13 8 (1.00%) Cloud Native
13 8 (1.00%) Mainframe
13 8 (1.00%) PMI
13 8 (1.00%) Virtual Team
Operating Systems
1 58 (7.25%) Linux
2 33 (4.13%) Android
3 32 (4.00%) Windows
4 21 (2.63%) Apple iOS
5 18 (2.25%) Embedded Linux
6 6 (0.75%) Unix
7 5 (0.63%) FreeRTOS
8 1 (0.13%) Robot Operating System
8 1 (0.13%) Windows 10
Processes & Methodologies
1 442 (55.25%) Agile
2 283 (35.38%) Software Engineering
3 282 (35.25%) DevOps
4 203 (25.38%) TDD
5 196 (24.50%) Microservices
6 179 (22.38%) CI/CD
7 150 (18.75%) Problem-Solving
8 144 (18.00%) Continuous Integration
9 132 (16.50%) Mentoring
10 131 (16.38%) Integration Testing
11 122 (15.25%) Design Patterns
12 119 (14.88%) Computer Science
13 118 (14.75%) Test Automation
14 109 (13.63%) OO
15 98 (12.25%) Scrum
16 91 (11.38%) Full-Stack Development
17 77 (9.63%) MVC
17 77 (9.63%) Open Source
18 75 (9.38%) Code Quality
18 75 (9.38%) SOLID
Programming Languages
1 338 (42.25%) C#
2 219 (27.38%) SQL
3 199 (24.88%) JavaScript
4 194 (24.25%) Java
5 135 (16.88%) Python
6 113 (14.13%) TypeScript
7 84 (10.50%) C++
8 64 (8.00%) Scala
9 31 (3.88%) Go
10 28 (3.50%) C
10 28 (3.50%) MATLAB
11 27 (3.38%) PHP
12 23 (2.88%) Kotlin
13 22 (2.75%) T-SQL
14 13 (1.63%) Fortran
14 13 (1.63%) VB.NET
15 11 (1.38%) Assembly Language
16 9 (1.13%) Shell Script
17 8 (1.00%) COBOL
17 8 (1.00%) JCL
Qualifications
1 210 (26.25%) Degree
2 78 (9.75%) Computer Science Degree
3 60 (7.50%) Security Cleared
4 39 (4.88%) SC Cleared
5 29 (3.63%) Master's Degree
6 17 (2.13%) DBS Check
6 17 (2.13%) DV Cleared
7 14 (1.75%) Numerate Degree
8 9 (1.13%) Microsoft Certification
9 8 (1.00%) PMI Certification
10 7 (0.88%) HND
11 4 (0.50%) SnowPro
11 4 (0.50%) Tableau Certification
12 3 (0.38%) AWS Certification
12 3 (0.38%) AWS Certified Solutions Architect
12 3 (0.38%) Chartered Engineer
12 3 (0.38%) TOGAF Certification
13 2 (0.25%) BPSS Clearance
14 1 (0.13%) Azure Certification
14 1 (0.13%) PhD
Quality Assurance & Compliance
1 102 (12.75%) QA
2 21 (2.63%) Accessibility
3 19 (2.38%) HL7
4 16 (2.00%) MiFID
5 13 (1.63%) AUTOSAR
5 13 (1.63%) ISO 26262
5 13 (1.63%) ISO 9001
6 10 (1.25%) Def Stans
6 10 (1.25%) IEC 61508
7 8 (1.00%) ISO/IEC 27001
7 8 (1.00%) NCSC
7 8 (1.00%) TickIT
8 5 (0.63%) GDPR
8 5 (0.63%) MISRA
8 5 (0.63%) MISRA C
8 5 (0.63%) PCI DSS
9 3 (0.38%) Data Quality
9 3 (0.38%) HIPAA
9 3 (0.38%) IEC 62304
9 3 (0.38%) Sarbanes-Oxley
System Software
1 116 (14.50%) Docker
2 12 (1.50%) Active Directory
3 11 (1.38%) Firmware
4 8 (1.00%) Embedded Firmware
5 1 (0.13%) Slurm Workload Manager
Systems Management
1 95 (11.88%) Kubernetes
2 87 (10.88%) Terraform
3 26 (3.25%) Ansible
4 24 (3.00%) Packer
5 17 (2.13%) Consul
6 4 (0.50%) Kibana
7 2 (0.25%) Active Directory Federation Services
7 2 (0.25%) Grafana
7 2 (0.25%) Kustomize
7 2 (0.25%) Podman
7 2 (0.25%) Puppet
8 1 (0.13%) Netcool
8 1 (0.13%) Prometheus
Vendors
1 97 (12.13%) Microsoft
2 29 (3.63%) Google
2 29 (3.63%) SAP
3 22 (2.75%) Oracle
4 20 (2.50%) Atlassian
5 14 (1.75%) Xamarin
6 11 (1.38%) Databricks
7 8 (1.00%) Adobe
7 8 (1.00%) IBM
8 7 (0.88%) Trayport
9 6 (0.75%) AppDynamics
9 6 (0.75%) Salesforce
10 5 (0.63%) Cognizant
11 4 (0.50%) EMC
11 4 (0.50%) Optimizely
12 3 (0.38%) Freescale
12 3 (0.38%) Red Hat
12 3 (0.38%) Siemens
12 3 (0.38%) SnapLogic
12 3 (0.38%) Sybase