Citrix XenApp
UK

The following table provides summary statistics for permanent job vacancies with a requirement for XenApp skills. Included is a benchmarking guide to the salaries offered in vacancies that have cited XenApp over the 6 months to 29 November 2023 with a comparison to the same period in the previous 2 years.

6 months to
29 Nov 2023
Same period 2022 Same period 2021
Rank 560 927 804
Rank change year-on-year +367 -123 -258
Permanent jobs citing XenApp 173 163 298
As % of all permanent jobs advertised in the UK 0.32% 0.13% 0.23%
As % of the System Software category 1.91% 0.85% 1.31%
Number of salaries quoted 77 142 247
10th Percentile £26,250 £31,375 £28,000
25th Percentile £32,500 £38,500 £36,250
Median annual salary (50th Percentile) £37,500 £45,000 £42,500
Median % change year-on-year -16.67% +5.88% -
75th Percentile £58,750 £55,000 £54,375
90th Percentile £67,500 £62,375 £62,500
UK excluding London median annual salary £36,000 £44,000 £40,000
% change year-on-year -18.18% +10.00% +2.56%

All System Software Skills
UK

XenApp is in the System Software category. The following table is for comparison with the above and provides summary statistics for all permanent job vacancies with a requirement for system software skills.

Permanent vacancies with a requirement for system software skills 9,044 19,198 22,827
As % of all permanent jobs advertised in the UK 16.72% 15.26% 17.69%
Number of salaries quoted 7,183 12,804 15,878
10th Percentile £28,850 £29,059 £28,250
25th Percentile £37,000 £38,094 £38,750
Median annual salary (50th Percentile) £55,000 £55,000 £55,000
75th Percentile £73,750 £77,715 £77,500
90th Percentile £90,000 £95,000 £95,000
UK excluding London median annual salary £47,557 £50,000 £47,500
% change year-on-year -4.89% +5.26% +5.56%

XenApp
Job Vacancy Trend

Job postings citing XenApp as a proportion of all IT jobs advertised.
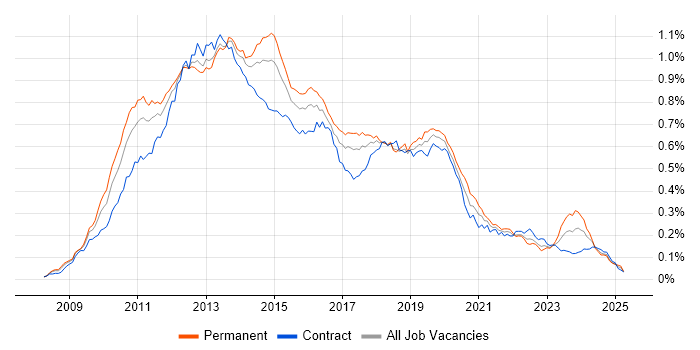
Job vacancy trend for XenApp in the UK

XenApp
Salary Trend

3-month moving average salary quoted in jobs citing XenApp.

Salary trend for XenApp in the UK

XenApp
Salary Histogram

Salary distribution for jobs citing XenApp over the 6 months to 29 November 2023.

Salary histogram for XenApp in the UK

XenApp
Top 13 Job Locations

The table below looks at the demand and provides a guide to the median salaries quoted in IT jobs citing XenApp within the UK over the 6 months to 29 November 2023. The 'Rank Change' column provides an indication of the change in demand within each location based on the same 6 month period last year.

Location Rank Change
on Same Period
Last Year
Matching
Permanent
IT Job Ads
Median Salary
Past 6 Months
Median Salary
% Change
on Same Period
Last Year
Live
Jobs
England +332 170 £38,750 -13.89% 24
London +339 114 £57,500 +4.55% 7
UK excluding London +180 57 £36,000 -18.18% 19
North of England +137 28 £34,750 -16.27% 4
Work from Home +218 20 £42,125 -11.32% 6
South East +141 18 £38,000 -15.56% 8
North West +114 17 £27,500 -38.89% 1
Midlands +115 11 £40,000 -11.11% 4
West Midlands +107 11 £40,000 -11.11% 4
Yorkshire +96 11 £37,000 -9.76% 1
South West +68 6 £36,000 +26.32%
East of England +98 1 £55,000 +37.50% 2
Scotland +57 1 £50,000 -20.00% 1

XenApp
Co-occurring Skills and Capabilities by Category

The follow tables expand on the table above by listing co-occurrences grouped by category. The same employment type, locality and period is covered with up to 20 co-occurrences shown in each of the following categories:

Application Platforms
1 102 (58.96%) MS Exchange
2 8 (4.62%) SharePoint
3 5 (2.89%) Skype for Business
4 2 (1.16%) SharePoint 2010
4 2 (1.16%) SharePoint 2013
Applications
1 9 (5.20%) Microsoft Office
2 1 (0.58%) Microsoft Excel
Business Applications
1 3 (1.73%) Remedy ITSM
Cloud Services
1 139 (80.35%) Microsoft 365
2 37 (21.39%) Azure
3 18 (10.40%) AWS
4 9 (5.20%) Entra ID
5 8 (4.62%) IaaS
6 7 (4.05%) Mimecast
7 5 (2.89%) GCP
8 4 (2.31%) Azure Sentinel
8 4 (2.31%) Rubrik
9 3 (1.73%) PaaS
9 3 (1.73%) SaaS
10 2 (1.16%) Tessian
11 1 (0.58%) Cloud Computing
11 1 (0.58%) WhatsApp
Communications & Networking
1 100 (57.80%) WAN
2 94 (54.34%) Wireless
3 90 (52.02%) Cisco IOS
4 86 (49.71%) SD-WAN
4 86 (49.71%) WebEx
5 29 (16.76%) DHCP
6 23 (13.29%) TCP/IP
7 22 (12.72%) DNS
8 20 (11.56%) Firewall
9 16 (9.25%) NetScaler
10 12 (6.94%) LAN
11 7 (4.05%) VPN
12 6 (3.47%) Remote Desktop
12 6 (3.47%) SAN
13 5 (2.89%) VLAN
14 4 (2.31%) Skype
14 4 (2.31%) SSL
15 3 (1.73%) Internet
16 1 (0.58%) Wi-Fi
16 1 (0.58%) WLAN
Database & Business Intelligence
1 7 (4.05%) SQL Server
2 1 (0.58%) Amazon RDS
2 1 (0.58%) Oracle Database
2 1 (0.58%) Oracle Reports
General
1 108 (62.43%) Social Skills
2 15 (8.67%) Law
3 14 (8.09%) Legal
4 11 (6.36%) Telecoms
5 10 (5.78%) Finance
6 8 (4.62%) Analytical Skills
6 8 (4.62%) Retail
7 6 (3.47%) Organisational Skills
8 4 (2.31%) Inclusion and Diversity
8 4 (2.31%) Publishing
9 1 (0.58%) Back Office
Job Titles
1 91 (52.60%) IT Support
2 88 (50.87%) Support Specialist
3 86 (49.71%) IT Support Specialist
4 33 (19.08%) Support Engineer
5 19 (10.98%) Infrastructure Engineer
6 18 (10.40%) Citrix Engineer
7 17 (9.83%) 2nd Line Support
8 14 (8.09%) 2nd Line Engineer
8 14 (8.09%) Senior
9 13 (7.51%) Desktop Engineer
9 13 (7.51%) Desktop Support
9 13 (7.51%) Desktop Support Engineer
10 12 (6.94%) 2nd Line Support Engineer
11 11 (6.36%) Senior Citrix Engineer
12 7 (4.05%) 3rd Line Engineer
12 7 (4.05%) 3rd Line Support
12 7 (4.05%) Analyst
12 7 (4.05%) Senior Infrastructure Engineer
12 7 (4.05%) Senior VMware Engineer
12 7 (4.05%) VMware Engineer
Libraries, Frameworks & Software Standards
1 11 (6.36%) MFC
2 1 (0.58%) HTML
2 1 (0.58%) HTML5
Miscellaneous
1 86 (49.71%) Wiki
2 75 (43.35%) Video Conferencing
3 5 (2.89%) Data Centre
4 4 (2.31%) Clustering
5 3 (1.73%) Management Information System
5 3 (1.73%) Onboarding
6 2 (1.16%) Enterprise Software
6 2 (1.16%) Replication
6 2 (1.16%) Self-Motivation
7 1 (0.58%) CCTV
7 1 (0.58%) PKI
7 1 (0.58%) Virtual Team
Operating Systems
1 149 (86.13%) Windows
2 109 (63.01%) Windows 10
3 93 (53.76%) Android
4 36 (20.81%) Windows Server
5 12 (6.94%) Windows Server 2016
6 10 (5.78%) Windows Server 2019
7 7 (4.05%) Windows Server 2012
8 6 (3.47%) Linux
9 5 (2.89%) Windows 7
9 5 (2.89%) Windows 8
10 4 (2.31%) Apple iOS
11 1 (0.58%) Solaris
Processes & Methodologies
1 92 (53.18%) Mobile Device Management
2 87 (50.29%) Computer Science
3 86 (49.71%) BCP
3 86 (49.71%) Business Continuity
3 86 (49.71%) Business Continuity Planning
3 86 (49.71%) Contract Negotiation
4 75 (43.35%) Application Virtualisation
5 28 (16.18%) ITIL
6 22 (12.72%) Infrastructure Engineering
7 16 (9.25%) Disaster Recovery
8 14 (8.09%) Migration
9 11 (6.36%) Case Management
10 10 (5.78%) Problem-Solving
11 9 (5.20%) Customer Service
11 9 (5.20%) ITSM
12 7 (4.05%) Continuous Improvement
12 7 (4.05%) Problem Management
12 7 (4.05%) Root Cause Analysis
13 6 (3.47%) Project Planning
13 6 (3.47%) Task Automation
Programming Languages
1 8 (4.62%) SQL
2 7 (4.05%) PowerShell
3 1 (0.58%) VB
Qualifications
1 92 (53.18%) Degree
2 89 (51.45%) Master's Degree
3 86 (49.71%) Computer Science Degree
4 7 (4.05%) CCA
4 7 (4.05%) Citrix Certification
4 7 (4.05%) Security Cleared
5 5 (2.89%) Azure Certification
6 4 (2.31%) DV Cleared
6 4 (2.31%) MCSE
6 4 (2.31%) Microsoft Certification
7 3 (1.73%) CESG Certified Professional
8 2 (1.16%) CEH
8 2 (1.16%) CISM
8 2 (1.16%) CISSP
8 2 (1.16%) ISACA
8 2 (1.16%) MCITP
8 2 (1.16%) SC Cleared
9 1 (0.58%) Cisco Certification
9 1 (0.58%) Network+ Certification
9 1 (0.58%) VMware Certified Professional (VCP)
Quality Assurance & Compliance
1 18 (10.40%) SLA
System Software
1 148 (85.55%) Active Directory
2 120 (69.36%) XenDesktop
3 92 (53.18%) VMware ESXi
4 91 (52.60%) Microsoft App-V
5 43 (24.86%) VMware Infrastructure
6 33 (19.08%) Hyper-V
7 13 (7.51%) vSphere
8 5 (2.89%) VirtualBox
9 4 (2.31%) Terminal Services
9 4 (2.31%) Virtual Desktop
10 3 (1.73%) Citrix Hypervisor
11 2 (1.16%) Microsoft Virtual Server
11 2 (1.16%) Virtual Servers
12 1 (0.58%) Forefront TMG
12 1 (0.58%) Virtual Machines
12 1 (0.58%) VMware Workstation
Systems Management
1 108 (62.43%) SCCM
2 75 (43.35%) AirWatch
3 12 (6.94%) Microsoft Intune
4 11 (6.36%) PaperCut
5 6 (3.47%) SCOM
6 5 (2.89%) EdgeSight
7 4 (2.31%) Failover Clustering
7 4 (2.31%) Microsoft Clustering
8 1 (0.58%) Ansible
8 1 (0.58%) Forefront Identity Manager
8 1 (0.58%) MOM
8 1 (0.58%) Progress Chef
8 1 (0.58%) Puppet
8 1 (0.58%) Terraform
8 1 (0.58%) vCenter Server
8 1 (0.58%) WSUS
Vendors
1 173 (100.00%) Citrix
2 157 (90.75%) Microsoft
3 98 (56.65%) Cisco
4 50 (28.90%) VMware
5 13 (7.51%) HP
6 12 (6.94%) Ivanti
7 11 (6.36%) Apple
7 11 (6.36%) Bloomberg
7 11 (6.36%) Mitel
8 6 (3.47%) Dell
8 6 (3.47%) Fortinet
8 6 (3.47%) SonicWALL
9 5 (2.89%) Google
9 5 (2.89%) Palo Alto
9 5 (2.89%) Symantec
10 4 (2.31%) Aruba
10 4 (2.31%) Draytek
10 4 (2.31%) Zerto
11 3 (1.73%) NetApp
11 3 (1.73%) Remedy