Mobile Device Management Jobs

Mobile Device Management
UK

The following table provides summary statistics for permanent job vacancies with a requirement for Mobile Device Management skills. Included is a benchmarking guide to the salaries offered in vacancies that have cited Mobile Device Management over the 6 months to 29 November 2023 with a comparison to the same period in the previous 2 years.

6 months to
29 Nov 2023
Same period 2022 Same period 2021
Rank 452 678 768
Rank change year-on-year +226 +90 -142
Permanent jobs citing Mobile Device Management 294 440 342
As % of all permanent jobs advertised in the UK 0.54% 0.35% 0.26%
As % of the Processes & Methodologies category 0.58% 0.37% 0.28%
Number of salaries quoted 179 292 261
10th Percentile £27,900 £25,428 £23,750
25th Percentile £34,625 £29,250 £27,000
Median annual salary (50th Percentile) £40,000 £37,500 £37,500
Median % change year-on-year +6.67% - -1.32%
75th Percentile £58,125 £52,500 £53,750
90th Percentile £69,250 £72,500 £73,750
UK excluding London median annual salary £38,500 £32,750 £32,500
% change year-on-year +17.56% +0.77% -

All Process and Methodology Skills
UK

Mobile Device Management is in the Processes and Methodologies category. The following table is for comparison with the above and provides summary statistics for all permanent job vacancies with a requirement for process or methodology skills.

Permanent vacancies with a requirement for process or methodology skills 50,908 120,439 123,182
As % of all permanent jobs advertised in the UK 94.09% 95.71% 95.44%
Number of salaries quoted 36,868 73,620 81,568
10th Percentile £32,500 £34,459 £32,500
25th Percentile £43,750 £45,000 £42,500
Median annual salary (50th Percentile) £60,000 £60,000 £59,045
Median % change year-on-year - +1.62% +7.35%
75th Percentile £80,000 £81,250 £77,500
90th Percentile £98,825 £100,000 £95,000
UK excluding London median annual salary £52,500 £53,000 £50,000
% change year-on-year -0.94% +6.00% +3.63%

Mobile Device Management
Job Vacancy Trend

Job postings citing Mobile Device Management as a proportion of all IT jobs advertised.
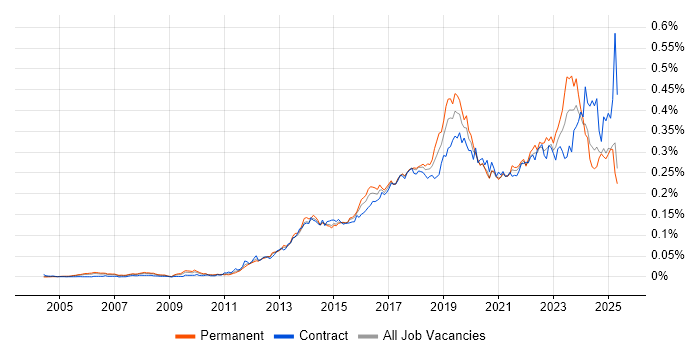
Job vacancy trend for Mobile Device Management in the UK

Mobile Device Management
Salary Trend

3-month moving average salary quoted in jobs citing Mobile Device Management.

Salary trend for Mobile Device Management in the UK

Mobile Device Management
Salary Histogram

Salary distribution for jobs citing Mobile Device Management over the 6 months to 29 November 2023.

Salary histogram for Mobile Device Management in the UK

Mobile Device Management
Top 17 Job Locations

The table below looks at the demand and provides a guide to the median salaries quoted in IT jobs citing Mobile Device Management within the UK over the 6 months to 29 November 2023. The 'Rank Change' column provides an indication of the change in demand within each location based on the same 6 month period last year.

Location Rank Change
on Same Period
Last Year
Matching
Permanent
IT Job Ads
Median Salary
Past 6 Months
Median Salary
% Change
on Same Period
Last Year
Live
Jobs
England +220 280 £40,210 +7.23% 84
London +309 168 £51,500 +27.13% 36
UK excluding London +66 122 £38,500 +17.56% 61
Work from Home +136 61 £41,235 +3.09% 38
South East +113 44 £39,000 +5.41% 27
Midlands +82 19 £55,000 +34.47% 9
North of England +108 17 £38,500 +37.50% 8
South West +23 16 £36,000 +22.03% 8
West Midlands +89 13 £55,000 +28.06% 5
East of England +117 12 £31,250 -16.67% 2
North West +94 8 £38,500 +40.00% 4
Yorkshire +84 8 £41,235 +30.90% 3
Scotland +27 7 £23,000 -34.29% 5
East Midlands +31 6 £31,250 -3.10% 4
Wales - 6 £45,799 - 2
North East +43 1 £22,000 -6.38% 1
Northern Ireland - 1 £25,000 -

Mobile Device Management
Co-occurring Skills and Capabilities by Category

The follow tables expand on the table above by listing co-occurrences grouped by category. The same employment type, locality and period is covered with up to 20 co-occurrences shown in each of the following categories:

Application Platforms
1 113 (38.44%) MS Exchange
2 57 (19.39%) SharePoint
3 3 (1.02%) Skype for Business
4 2 (0.68%) Exchange Server 2003
4 2 (0.68%) SharePoint 2010
4 2 (0.68%) SharePoint 2013
5 1 (0.34%) Site Server
Applications
1 47 (15.99%) Microsoft Office
2 1 (0.34%) Acrobat
2 1 (0.34%) Microsoft Project
2 1 (0.34%) MS Visio
Business Applications
1 12 (4.08%) Salesforce CRM
2 3 (1.02%) Remedy ITSM
3 2 (0.68%) Elite 3E
4 1 (0.34%) Fidessa
Cloud Services
1 228 (77.55%) Microsoft 365
2 98 (33.33%) Azure
3 44 (14.97%) Entra ID
4 13 (4.42%) OneDrive
5 12 (4.08%) AWS
6 5 (1.70%) Azure DevOps
6 5 (1.70%) GCP
7 4 (1.36%) IaaS
7 4 (1.36%) WhatsApp
8 3 (1.02%) SaaS
9 2 (0.68%) Amazon EC2
9 2 (0.68%) Azure Monitor
9 2 (0.68%) PaaS
10 1 (0.34%) Cloud Computing
10 1 (0.34%) Google Workspace
10 1 (0.34%) Mimecast
10 1 (0.34%) Serverless
Communications & Networking
1 104 (35.37%) WAN
2 91 (30.95%) Wireless
3 88 (29.93%) WebEx
4 87 (29.59%) Cisco IOS
4 87 (29.59%) SD-WAN
5 43 (14.63%) Firewall
6 26 (8.84%) DNS
7 20 (6.80%) DHCP
8 19 (6.46%) TCP/IP
9 18 (6.12%) LAN
9 18 (6.12%) VPN
10 15 (5.10%) Wi-Fi
11 12 (4.08%) IP Telephony
12 10 (3.40%) Internet
13 9 (3.06%) VLAN
14 6 (2.04%) Remote Desktop
14 6 (2.04%) VoIP
15 4 (1.36%) Unified Communications
16 3 (1.02%) Network Security
17 2 (0.68%) Ethernet
Database & Business Intelligence
1 6 (2.04%) SQL Server
General
1 130 (44.22%) Social Skills
2 29 (9.86%) Finance
3 13 (4.42%) Analytical Skills
4 12 (4.08%) Law
5 11 (3.74%) Retail
6 10 (3.40%) Inclusion and Diversity
6 10 (3.40%) Public Sector
7 9 (3.06%) Legal
8 5 (1.70%) Organisational Skills
8 5 (1.70%) Tech for Good
8 5 (1.70%) Telecoms
9 4 (1.36%) Documentation Skills
10 3 (1.02%) Local Government
10 3 (1.02%) Manufacturing
10 3 (1.02%) Police
11 2 (0.68%) Pharmaceutical
12 1 (0.34%) Advertising
12 1 (0.34%) Back Office
12 1 (0.34%) Financial Institution
12 1 (0.34%) Games
Job Titles
1 124 (42.18%) IT Support
2 92 (31.29%) IT Support Specialist
2 92 (31.29%) Support Specialist
3 50 (17.01%) Analyst
4 49 (16.67%) Support Engineer
5 36 (12.24%) Senior
6 26 (8.84%) Infrastructure Engineer
7 24 (8.16%) Support Analyst
8 22 (7.48%) 2nd Line Support
8 22 (7.48%) IT Analyst
9 21 (7.14%) IT Engineer
10 20 (6.80%) Service Analyst
11 19 (6.46%) Service Desk Analyst
12 16 (5.44%) IT Support Analyst
13 15 (5.10%) IT Support Engineer
14 14 (4.76%) Desktop Support
14 14 (4.76%) Senior Systems Engineer
14 14 (4.76%) Systems Engineer
15 12 (4.08%) Infrastructure Support
16 11 (3.74%) 3rd Line Support
Libraries, Frameworks & Software Standards
1 7 (2.38%) Web Services
2 6 (2.04%) .NET
2 6 (2.04%) .NET Framework
2 6 (2.04%) ASP.NET
2 6 (2.04%) ASP.NET Web API
2 6 (2.04%) CSS
2 6 (2.04%) Entity Framework
2 6 (2.04%) HTML
2 6 (2.04%) JSON
2 6 (2.04%) RESTful
3 4 (1.36%) React
4 2 (0.68%) .NET Core
4 2 (0.68%) ASP.NET Core
4 2 (0.68%) SAML
5 1 (0.34%) FIX Protocol
5 1 (0.34%) iOS SDK
5 1 (0.34%) LDAP
5 1 (0.34%) OAuth
5 1 (0.34%) OAuth2
Miscellaneous
1 93 (31.63%) Video Conferencing
2 86 (29.25%) Wiki
3 18 (6.12%) Management Information System
4 15 (5.10%) Blackberry
4 15 (5.10%) Self-Motivation
4 15 (5.10%) Virtual Team
5 12 (4.08%) Data Centre
5 12 (4.08%) Smartphone
6 7 (2.38%) Replication
7 6 (2.04%) Driving Licence
7 6 (2.04%) Fibre Optics
7 6 (2.04%) iPhone
8 4 (1.36%) iPad
9 3 (1.02%) Onboarding
10 2 (0.68%) Fat Client
10 2 (0.68%) FMCG
10 2 (0.68%) Mobile App
10 2 (0.68%) NHS
10 2 (0.68%) Thin Client
11 1 (0.34%) Video\Live Streaming
Operating Systems
1 241 (81.97%) Windows
2 140 (47.62%) Windows 10
3 131 (44.56%) Android
4 66 (22.45%) Windows Server
5 52 (17.69%) Apple iOS
6 12 (4.08%) Windows Server 2012
7 8 (2.72%) Linux
7 8 (2.72%) Mac OS
8 7 (2.38%) Windows 8
9 5 (1.70%) Windows 7
9 5 (1.70%) Windows Server 2016
10 4 (1.36%) Mac OS X
10 4 (1.36%) Windows Server 2019
11 2 (0.68%) Windows 2000 Server
12 1 (0.34%) VMS
Processes & Methodologies
1 104 (35.37%) Business Continuity
2 97 (32.99%) Computer Science
3 86 (29.25%) BCP
3 86 (29.25%) Business Continuity Planning
3 86 (29.25%) Contract Negotiation
4 75 (25.51%) Application Virtualisation
5 47 (15.99%) ITIL
6 45 (15.31%) Problem-Solving
7 30 (10.20%) Infrastructure Engineering
8 29 (9.86%) Cybersecurity
9 26 (8.84%) Customer Service
10 25 (8.50%) Continuous Improvement
11 18 (6.12%) ITSM
11 18 (6.12%) Problem Management
11 18 (6.12%) Project Management
12 15 (5.10%) CRM
13 14 (4.76%) Customer Requirements
13 14 (4.76%) Data Protection
13 14 (4.76%) Service Delivery
13 14 (4.76%) Technology Transformation
Programming Languages
1 36 (12.24%) PowerShell
2 11 (3.74%) SQL
3 7 (2.38%) Python
4 6 (2.04%) C#
4 6 (2.04%) JavaScript
4 6 (2.04%) T-SQL
Qualifications
1 129 (43.88%) Degree
2 93 (31.63%) Computer Science Degree
3 86 (29.25%) Master's Degree
4 24 (8.16%) Microsoft Certification
5 19 (6.46%) Security Cleared
6 18 (6.12%) CompTIA Security+
7 10 (3.40%) A+ Certification
8 8 (2.72%) MCSE
8 8 (2.72%) SC Cleared
9 5 (1.70%) Citrix Certification
9 5 (1.70%) MCP
10 4 (1.36%) CEH
10 4 (1.36%) GIAC
10 4 (1.36%) GSEC
11 3 (1.02%) CCNA
11 3 (1.02%) Cisco Certification
12 2 (0.68%) ITIL Certification
12 2 (0.68%) MCDST
12 2 (0.68%) MCITP
12 2 (0.68%) MCSA
Quality Assurance & Compliance
1 17 (5.78%) SLA
2 7 (2.38%) QA
3 6 (2.04%) JSP 440
4 5 (1.70%) NIST
4 5 (1.70%) SOC 2
5 2 (0.68%) GDPR
5 2 (0.68%) ISO/IEC 27001
6 1 (0.34%) Cyber Essentials
6 1 (0.34%) Cyber Essentials PLUS
System Software
1 221 (75.17%) Active Directory
2 100 (34.01%) VMware ESXi
3 92 (31.29%) XenApp
4 91 (30.95%) XenDesktop
5 86 (29.25%) Microsoft App-V
6 57 (19.39%) VMware Infrastructure
7 28 (9.52%) Hyper-V
8 15 (5.10%) Virtual Desktop
9 8 (2.72%) Firmware
10 7 (2.38%) Docker
11 3 (1.02%) vSphere
12 2 (0.68%) BitLocker
13 1 (0.34%) VMware Server
Systems Management
1 123 (41.84%) SCCM
2 86 (29.25%) AirWatch
3 71 (24.15%) Microsoft Intune
4 8 (2.72%) Jamf Pro
5 4 (1.36%) Single Sign-On
6 3 (1.02%) Active Directory Federation Services
6 3 (1.02%) McAfee ePO
6 3 (1.02%) WSUS
7 1 (0.34%) Autotask
Vendors
1 236 (80.27%) Microsoft
2 108 (36.73%) Citrix
3 101 (34.35%) Cisco
4 64 (21.77%) VMware
5 37 (12.59%) Apple
6 22 (7.48%) MobileIron
7 20 (6.80%) Samsung
8 14 (4.76%) Red Hat
9 13 (4.42%) Bloomberg
9 13 (4.42%) HP
10 12 (4.08%) Salesforce
11 9 (3.06%) Google
12 8 (2.72%) Meraki
13 7 (2.38%) Dell
14 6 (2.04%) ServiceNow
14 6 (2.04%) Sophos
14 6 (2.04%) Symantec
15 4 (1.36%) McAfee
15 4 (1.36%) Veeam
16 3 (1.02%) Remedy