Data Security
UK

The following table provides summary statistics for permanent job vacancies with a requirement for Data Security skills. Included is a benchmarking guide to the salaries offered in vacancies that have cited Data Security over the 6 months to 28 November 2023 with a comparison to the same period in the previous 2 years.

6 months to
28 Nov 2023
Same period 2022 Same period 2021
Rank 333 573 434
Rank change year-on-year +240 -139 -71
Permanent jobs citing Data Security 489 620 936
As % of all permanent jobs advertised in the UK 0.90% 0.49% 0.73%
As % of the Processes & Methodologies category 0.96% 0.52% 0.76%
Number of salaries quoted 393 422 696
10th Percentile £35,733 £39,750 £37,500
25th Percentile £47,533 £50,000 £42,500
Median annual salary (50th Percentile) £60,000 £61,600 £57,500
Median % change year-on-year -2.60% +7.13% +9.52%
75th Percentile £82,500 £84,056 £72,500
90th Percentile £97,290 £99,800 £95,000
UK excluding London median annual salary £59,556 £56,500 £50,000
% change year-on-year +5.41% +13.00% +5.26%

All Process and Methodology Skills
UK

Data Security is in the Processes and Methodologies category. The following table is for comparison with the above and provides summary statistics for all permanent job vacancies with a requirement for process or methodology skills.

Permanent vacancies with a requirement for process or methodology skills 51,121 120,104 122,523
As % of all permanent jobs advertised in the UK 94.09% 95.72% 95.43%
Number of salaries quoted 36,956 73,203 81,032
10th Percentile £32,500 £34,313 £32,500
25th Percentile £43,750 £45,000 £42,500
Median annual salary (50th Percentile) £60,000 £60,000 £59,000
Median % change year-on-year - +1.69% +7.27%
75th Percentile £80,000 £81,250 £77,500
90th Percentile £98,750 £100,000 £95,000
UK excluding London median annual salary £52,500 £53,000 £50,000
% change year-on-year -0.94% +6.00% +4.17%

Data Security
Job Vacancy Trend

Job postings citing Data Security as a proportion of all IT jobs advertised.
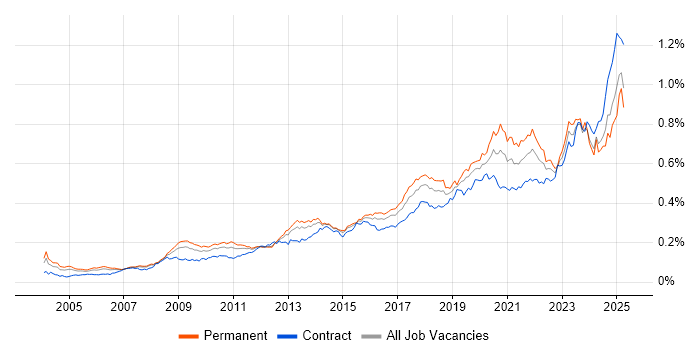
Job vacancy trend for Data Security in the UK

Data Security
Salary Trend

3-month moving average salary quoted in jobs citing Data Security.

Salary trend for Data Security in the UK

Data Security
Salary Histogram

Salary distribution for jobs citing Data Security over the 6 months to 28 November 2023.

Salary histogram for Data Security in the UK

Data Security
Top 15 Job Locations

The table below looks at the demand and provides a guide to the median salaries quoted in IT jobs citing Data Security within the UK over the 6 months to 28 November 2023. The 'Rank Change' column provides an indication of the change in demand within each location based on the same 6 month period last year.

Location Rank Change
on Same Period
Last Year
Matching
Permanent
IT Job Ads
Median Salary
Past 6 Months
Median Salary
% Change
on Same Period
Last Year
Live
Jobs
England +237 445 £60,000 -1.32% 212
UK excluding London +240 298 £59,556 +5.41% 120
Work from Home +209 180 £59,556 -14.92% 104
London +165 174 £70,000 +7.69% 96
North of England +144 76 £63,000 +40.00% 40
South East +130 69 £57,500 -4.17% 35
South West +80 54 £57,500 +8.49% 15
Midlands +149 51 £56,250 +2.51% 19
Yorkshire +118 46 £65,000 +52.94% 15
West Midlands +129 42 £55,000 +3.29% 12
Scotland +61 33 £59,556 +19.11% 1
North West +108 30 £60,000 +33.33% 23
East of England +108 11 £40,000 -38.46% 9
East Midlands +56 9 £60,000 -14.29% 7
Wales +11 7 £62,989 -20.90% 2

Data Security
Co-occurring Skills and Capabilities by Category

The follow tables expand on the table above by listing co-occurrences grouped by category. The same employment type, locality and period is covered with up to 20 co-occurrences shown in each of the following categories:

Application Platforms
1 37 (7.57%) SharePoint
2 9 (1.84%) IIS
3 5 (1.02%) Confluence
4 2 (0.41%) Apache Spark
5 1 (0.20%) Apache
5 1 (0.20%) Apache Airflow
5 1 (0.20%) nginx
Applications
1 45 (9.20%) Microsoft Office
2 31 (6.34%) Microsoft Excel
3 2 (0.41%) Trello
4 1 (0.20%) Microsoft PowerPoint
Business Applications
1 10 (2.04%) Dynamics CRM
2 9 (1.84%) Unit4 Business World
3 8 (1.64%) SAP ERP
4 4 (0.82%) HFM
4 4 (0.82%) Oracle ERP
4 4 (0.82%) SAP S/4HANA
5 3 (0.61%) Payment Gateway
6 1 (0.20%) Dynamics AX
6 1 (0.20%) Infor SunSystems
6 1 (0.20%) Raiser's Edge
6 1 (0.20%) Sage 200
6 1 (0.20%) Temenos T24
Cloud Services
1 220 (44.99%) Azure
2 94 (19.22%) Power Platform
3 93 (19.02%) Microsoft 365
4 73 (14.93%) GCP
5 59 (12.07%) PaaS
6 57 (11.66%) SaaS
7 56 (11.45%) AWS
8 50 (10.22%) IaaS
9 41 (8.38%) Azure DevOps
10 28 (5.73%) PowerApps
11 24 (4.91%) Entra ID
12 22 (4.50%) Serverless
13 20 (4.09%) Power Automate
14 17 (3.48%) Dynamics 365
15 15 (3.07%) Azure Data Factory
15 15 (3.07%) Azure Logic Apps
15 15 (3.07%) OneDrive
16 14 (2.86%) Azure Functions
17 13 (2.66%) Snowflake
18 9 (1.84%) Datadog
Communications & Networking
1 49 (10.02%) Firewall
2 42 (8.59%) VPN
3 37 (7.57%) WAN
4 34 (6.95%) LAN
5 24 (4.91%) Network Security
6 23 (4.70%) Wi-Fi
7 21 (4.29%) Wireless
8 20 (4.09%) DHCP
8 20 (4.09%) Intrusion Detection
9 17 (3.48%) DNS
10 15 (3.07%) VLAN
11 14 (2.86%) Internet
11 14 (2.86%) Remote Desktop
12 11 (2.25%) Cisco Nexus
12 11 (2.25%) IPsec
13 7 (1.43%) TCP/IP
14 6 (1.23%) MPLS
14 6 (1.23%) Wireshark
15 4 (0.82%) BGP
15 4 (0.82%) iSCSI
Database & Business Intelligence
1 97 (19.84%) Data Warehouse
2 92 (18.81%) Power BI
3 72 (14.72%) SQL Server
4 54 (11.04%) Data Lake
5 52 (10.63%) NoSQL
6 41 (8.38%) SQL Server Reporting Services
7 39 (7.98%) Metadata
8 33 (6.75%) SQL Server Integration Services
9 25 (5.11%) Tableau
10 20 (4.09%) Azure SQL Database
11 10 (2.04%) SQL Server Analysis Services
12 8 (1.64%) MongoDB
13 6 (1.23%) Oracle Database
13 6 (1.23%) Relational Database
14 5 (1.02%) Amazon RDS
14 5 (1.02%) OLAP
14 5 (1.02%) OLTP
14 5 (1.02%) Qlik Sense
14 5 (1.02%) Star Schema
15 4 (0.82%) RDBMS
Development Applications
1 8 (1.64%) JIRA
2 7 (1.43%) Git
3 6 (1.23%) Jenkins
4 4 (0.82%) ERwin
5 3 (0.61%) SQL Server Management Studio (SSMS)
5 3 (0.61%) Visual Studio Team System
6 2 (0.41%) GitLab
6 2 (0.41%) Sonatype Nexus
7 1 (0.20%) CircleCI
7 1 (0.20%) git-flow
7 1 (0.20%) Visual Studio
General
1 200 (40.90%) Finance
2 185 (37.83%) Social Skills
3 104 (21.27%) Banking
4 93 (19.02%) Inclusion and Diversity
5 75 (15.34%) Analytical Skills
6 43 (8.79%) Retail
7 25 (5.11%) Marketing
7 25 (5.11%) Presentation Skills
8 22 (4.50%) Public Sector
9 20 (4.09%) Legal
10 16 (3.27%) Influencing Skills
11 11 (2.25%) Law
12 5 (1.02%) Manufacturing
12 5 (1.02%) Organisational Skills
13 4 (0.82%) Financial Institution
13 4 (0.82%) Pharmaceutical
14 3 (0.61%) Telecoms
15 2 (0.41%) Advertising
15 2 (0.41%) Military
16 1 (0.20%) Documentation Skills
Job Titles
1 91 (18.61%) Architect
2 72 (14.72%) Senior
3 58 (11.86%) Enterprise Architect
4 48 (9.82%) Developer
5 44 (9.00%) Analyst
6 41 (8.38%) Commercial Architect
7 38 (7.77%) Data Manager
8 30 (6.13%) Data Architect
9 29 (5.93%) Lead
10 28 (5.73%) Administrator
11 26 (5.32%) Data Engineer
12 22 (4.50%) Security Engineer
13 21 (4.29%) DBA
13 21 (4.29%) IT Engineer
14 19 (3.89%) 3rd Line Engineer
14 19 (3.89%) Governance Manager
14 19 (3.89%) IT Manager
15 16 (3.27%) Data Governance Manager
15 16 (3.27%) Enterprise Data Architect
15 16 (3.27%) IT Security Engineer
Libraries, Frameworks & Software Standards
1 48 (9.82%) REST
2 44 (9.00%) Kafka
3 43 (8.79%) Web Services
4 42 (8.59%) JWT
4 42 (8.59%) OpenID
5 30 (6.13%) .NET
6 22 (4.50%) AngularJS
7 19 (3.89%) .NET Core
7 19 (3.89%) Middleware
8 11 (2.25%) JSON
9 10 (2.04%) React
10 8 (1.64%) HTML
10 8 (1.64%) YAML
11 6 (1.23%) .NET Framework
11 6 (1.23%) CSS
12 5 (1.02%) ASP.NET MVC
12 5 (1.02%) CSS3
12 5 (1.02%) HTML5
12 5 (1.02%) jQuery
12 5 (1.02%) Velocity
Miscellaneous
1 48 (9.82%) Public Cloud
2 46 (9.41%) Mainframe
3 45 (9.20%) Management Information System
4 44 (9.00%) Data Structures
5 42 (8.59%) Blockchain
6 24 (4.91%) Cloud Native
7 21 (4.29%) Driving Licence
8 19 (3.89%) Replication
9 18 (3.68%) Data Centre
9 18 (3.68%) Data Protection Act
10 16 (3.27%) Product Ownership
11 14 (2.86%) Self-Motivation
12 13 (2.66%) Algorithms
12 13 (2.66%) Virtual Team
13 10 (2.04%) Cyber Threat
13 10 (2.04%) NHS
14 9 (1.84%) Cyber Kill Chain
14 9 (1.84%) Cybercrime
14 9 (1.84%) PKI
14 9 (1.84%) Security Operations Centre
Operating Systems
1 58 (11.86%) Windows
2 51 (10.43%) Unix
3 26 (5.32%) Windows Server
4 25 (5.11%) Linux
5 10 (2.04%) Windows 8
6 9 (1.84%) Ubuntu
7 5 (1.02%) Windows 10
8 4 (0.82%) Windows Server 2016
8 4 (0.82%) Windows Server 2019
9 2 (0.41%) Android
9 2 (0.41%) Apple iOS
9 2 (0.41%) Windows Server 2012
Processes & Methodologies
1 183 (37.42%) Agile
2 113 (23.11%) Business Intelligence
3 112 (22.90%) Analytics
4 100 (20.45%) Data Architecture
5 94 (19.22%) Problem-Solving
6 90 (18.40%) Roadmaps
7 75 (15.34%) Cybersecurity
8 73 (14.93%) Data Modelling
8 73 (14.93%) DevOps
9 72 (14.72%) Data Management
10 64 (13.09%) Thought Leadership
11 63 (12.88%) Customer Service
11 63 (12.88%) Migration
12 60 (12.27%) Machine Learning
13 59 (12.07%) Artificial Intelligence
14 57 (11.66%) Decision-Making
15 56 (11.45%) Project Management
16 54 (11.04%) Data Governance
17 53 (10.84%) Data Protection
17 53 (10.84%) Enterprise Architecture
Programming Languages
1 129 (26.38%) SQL
2 58 (11.86%) Python
3 35 (7.16%) PowerShell
4 19 (3.89%) JavaScript
5 18 (3.68%) T-SQL
6 13 (2.66%) Bash
6 13 (2.66%) C#
7 10 (2.04%) Java
8 9 (1.84%) Search Processing Language
9 8 (1.64%) Data Analysis Expressions
10 7 (1.43%) Scala
11 6 (1.23%) R
12 4 (0.82%) Cypher
13 2 (0.41%) C++
13 2 (0.41%) Go
13 2 (0.41%) Kotlin
13 2 (0.41%) PHP
13 2 (0.41%) PL/SQL
13 2 (0.41%) VBScript
14 1 (0.20%) VBA
Qualifications
1 72 (14.72%) Degree
2 26 (5.32%) CISSP
2 26 (5.32%) Computer Science Degree
3 21 (4.29%) Cisco Certification
4 18 (3.68%) Microsoft Certification
5 16 (3.27%) (ISC)2 CCSP
6 15 (3.07%) CCSP
6 15 (3.07%) Security Cleared
7 11 (2.25%) CISM
8 10 (2.04%) SC Cleared
9 9 (1.84%) A+ Certification
9 9 (1.84%) NVQ Level 3
10 5 (1.02%) AWS Certification
10 5 (1.02%) CISMP
10 5 (1.02%) MCSA
11 4 (0.82%) BPSS Clearance
11 4 (0.82%) DV Cleared
11 4 (0.82%) Master's Degree
11 4 (0.82%) MCSE
12 3 (0.61%) CCNA
Quality Assurance & Compliance
1 57 (11.66%) Data Quality
2 48 (9.82%) GDPR
3 19 (3.89%) ISO/IEC 27001
4 17 (3.48%) NIST
4 17 (3.48%) QA
5 13 (2.66%) PCI DSS
6 12 (2.45%) SLA
7 11 (2.25%) Accessibility
8 5 (1.02%) Cyber Essentials
9 4 (0.82%) Cyber Essentials PLUS
9 4 (0.82%) GRC
9 4 (0.82%) NCSC
10 3 (0.61%) HMG Security Policy Framework
10 3 (0.61%) ISO/IEC 27002 (supersedes ISO/IEC 17799)
11 2 (0.41%) PMO
11 2 (0.41%) Sarbanes-Oxley
12 1 (0.20%) Basel III
12 1 (0.20%) GxP
12 1 (0.20%) JSP 440
12 1 (0.20%) RMADS
System Software
1 59 (12.07%) Active Directory
2 22 (4.50%) VMware Infrastructure
3 14 (2.86%) Docker
4 9 (1.84%) VMware ESXi
5 8 (1.64%) Hyper-V
5 8 (1.64%) Virtual Desktop
6 7 (1.43%) Firmware
7 3 (0.61%) Virtual Machines
8 2 (0.41%) vSphere
Systems Management
1 75 (15.34%) Kubernetes
2 21 (4.29%) Terraform
3 15 (3.07%) Ansible
4 8 (1.64%) Microsoft Intune
5 6 (1.23%) Demisto
6 4 (0.82%) FortiGate
7 3 (0.61%) Progress Chef
7 3 (0.61%) WSUS
8 2 (0.41%) Grafana
8 2 (0.41%) Prometheus
8 2 (0.41%) Puppet
8 2 (0.41%) SCCM
8 2 (0.41%) SmoothWall
8 2 (0.41%) ZABBIX
9 1 (0.20%) Active Directory Federation Services
9 1 (0.20%) DatAdvantage
9 1 (0.20%) Istio
9 1 (0.20%) NetBackup
9 1 (0.20%) Single Sign-On
Vendors
1 155 (31.70%) Microsoft
2 28 (5.73%) VMware
3 26 (5.32%) SolarWinds
4 25 (5.11%) Cisco
5 21 (4.29%) Juniper
5 21 (4.29%) Teradata
6 18 (3.68%) Aruba
7 16 (3.27%) Oracle
7 16 (3.27%) Splunk
8 14 (2.86%) Palo Alto
8 14 (2.86%) ServiceNow
9 11 (2.25%) Databricks
9 11 (2.25%) Qualys
10 10 (2.04%) Google
10 10 (2.04%) Varonis
11 9 (1.84%) AppDynamics
11 9 (1.84%) Apple
11 9 (1.84%) New Relic
11 9 (1.84%) SAP
11 9 (1.84%) Talend