CCNA Job Trends

Cisco Certified Network Associate (CCNA)
UK

The table below provides summary statistics for permanent job vacancies with a requirement for CCNA qualifications. It includes a benchmarking guide to the salaries offered over the 6 months leading up to 23 November 2025, comparing them to the same period in the previous two years.

6 months to
23 Nov 2025
Same period 2024 Same period 2023
Rank 328 247 266
Rank change year-on-year -81 +19 +191
Permanent jobs citing CCNA 372 744 617
As % of all permanent jobs in the UK 0.70% 1.08% 1.19%
As % of the Qualifications category 2.18% 3.64% 3.81%
Number of salaries quoted 253 307 502
10th Percentile £25,750 £34,404 £29,000
25th Percentile £31,000 £41,500 £37,000
Median annual salary (50th Percentile) £40,500 £55,000 £45,848
Median % change year-on-year -26.36% +19.96% -3.48%
75th Percentile £60,000 £63,750 £58,500
90th Percentile £70,000 £67,500 £73,750
UK excluding London median annual salary £40,000 £52,500 £42,500
% change year-on-year -23.81% +23.53% -1.28%

All Academic and Professional Certifications
UK

CCNA falls under the Academic Qualifications and Professional Certifications category. For comparison with the information above, the following table provides summary statistics for all permanent job vacancies requiring academic qualifications or professional certifications.

Permanent vacancies requiring academic qualifications or professional certifications 17,102 20,463 16,204
As % of all permanent jobs advertised in the UK 32.18% 29.77% 31.16%
Number of salaries quoted 7,881 8,488 11,131
10th Percentile £28,250 £32,500 £31,250
25th Percentile £36,250 £44,750 £41,750
Median annual salary (50th Percentile) £55,000 £58,033 £57,500
Median % change year-on-year -5.23% +0.93% +0.88%
75th Percentile £75,000 £76,500 £75,000
90th Percentile £90,000 £91,953 £92,500
UK excluding London median annual salary £48,000 £55,000 £52,500
% change year-on-year -12.73% +4.76% +5.00%

CCNA
Job Vacancy Trend

Historical trend showing the proportion of permanent IT job postings citing CCNA relative to all permanent IT jobs advertised.
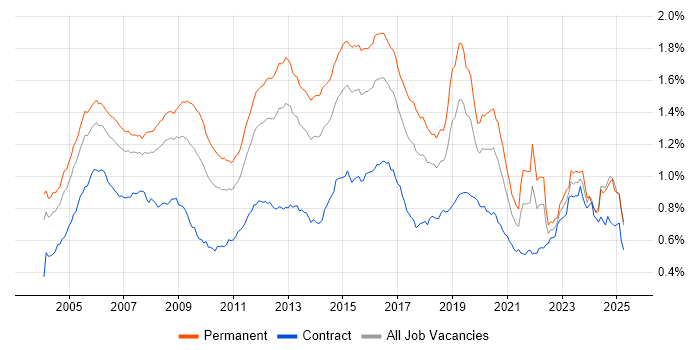
CCNA job vacancy trend in the UK

CCNA
Salary Trend

Salary distribution trend for jobs in the UK citing CCNA.

Salary distribution trend for jobs in the UK citing CCNA

CCNA
Salary Histogram

Salary distribution for jobs citing CCNA over the 6 months to 23 November 2025.

Salary histogram for CCNA in the UK

CCNA
Top 17 Job Locations

The table below looks at the demand and provides a guide to the median salaries quoted in IT jobs citing CCNA within the UK over the 6 months to 23 November 2025. The 'Rank Change' column provides an indication of the change in demand within each location based on the same 6 month period last year.

Location Rank Change
on Same Period
Last Year
Matching
Permanent
IT Job Ads
Median Salary
Past 6 Months
Median Salary
% Change
on Same Period
Last Year
Live
Jobs
England -70 337 £41,276 -24.95% 162
UK excluding London -38 300 £40,000 -23.81% 153
Work from Home +86 106 £45,000 -18.18% 58
South East +16 84 £52,500 -7.09% 64
South West +74 70 £32,250 -29.12% 10
London -17 62 £70,000 +18.64% 45
North of England -19 49 £43,250 -8.95% 21
Midlands -88 41 £32,500 -35.00% 25
East of England +34 33 £40,000 -21.57% 11
East Midlands -4 32 £32,500 -18.75% 13
North West +17 29 £50,000 +5.26% 17
Scotland +19 14 £36,000 -42.40% 19
North East +15 10 £31,000 -52.31% 1
Yorkshire -12 10 £26,000 -54.78% 3
West Midlands -81 9 £41,000 -21.90% 11
Northern Ireland +12 8 £37,500 -28.57% 1
Wales -18 3 £49,750 +15.70% 4

CCNA
Co-Occurring Skills & Capabilities by Category

The following tables expand on the one above by listing co-occurrences grouped by category. They cover the same employment type, locality and period, with up to 20 co-occurrences shown in each category:

Application Platforms
1 27 (7.26%) Microsoft Exchange
2 8 (2.15%) SharePoint
3 4 (1.08%) nginx
4 2 (0.54%) Apache
4 2 (0.54%) Confluence
4 2 (0.54%) WildFly
Applications
1 7 (1.88%) Microsoft Office
2 6 (1.61%) MS Visio
3 5 (1.34%) Microsoft Excel
4 2 (0.54%) Microsoft Project
5 1 (0.27%) Microsoft PowerPoint
5 1 (0.27%) Spreadsheet
Business Applications
1 5 (1.34%) Remedy ITSM
2 2 (0.54%) NetSuite
Cloud Services
1 92 (24.73%) Azure
2 59 (15.86%) Microsoft 365
3 37 (9.95%) AWS
4 29 (7.80%) Entra ID
5 9 (2.42%) IaaS
6 7 (1.88%) GCP
7 6 (1.61%) Mimecast
8 5 (1.34%) Azure Sentinel
8 5 (1.34%) Google Workspace
9 4 (1.08%) Azure DevOps
9 4 (1.08%) Dropbox
9 4 (1.08%) Microsoft Purview
9 4 (1.08%) OpenShift
9 4 (1.08%) Rubrik
9 4 (1.08%) SaaS
10 3 (0.81%) GitHub
10 3 (0.81%) GitHub Actions
11 2 (0.54%) Azure AKS
11 2 (0.54%) SecurityScorecard
11 2 (0.54%) Smartsheet
Communications & Networking
1 171 (45.97%) Firewall
2 108 (29.03%) WAN
3 107 (28.76%) LAN
4 92 (24.73%) VPN
5 60 (16.13%) Network Security
5 60 (16.13%) Wi-Fi
6 57 (15.32%) VSAT
7 41 (11.02%) VLAN
8 40 (10.75%) TCP/IP
9 35 (9.41%) DNS
10 32 (8.60%) Wireless
11 31 (8.33%) MPLS
12 25 (6.72%) BGP
13 24 (6.45%) DHCP
14 23 (6.18%) WLAN
15 22 (5.91%) SD-WAN
16 21 (5.65%) Junos
17 20 (5.38%) LTE
17 20 (5.38%) OSPF
18 18 (4.84%) VoIP
Database & Business Intelligence
1 7 (1.88%) SQL Server
2 3 (0.81%) InfluxDB
3 2 (0.54%) MySQL
3 2 (0.54%) PostgreSQL
Development Applications
1 8 (2.15%) GitLab
2 3 (0.81%) Burp Suite
2 3 (0.81%) JIRA
2 3 (0.81%) Metasploit
3 2 (0.54%) Sonatype Nexus
General
1 109 (29.30%) Social Skills
2 63 (16.94%) Finance
3 29 (7.80%) Telecoms
4 24 (6.45%) Manufacturing
5 23 (6.18%) Analytical Skills
6 16 (4.30%) Organisational Skills
7 15 (4.03%) Aerospace
8 14 (3.76%) Billing
9 13 (3.49%) Public Sector
10 11 (2.96%) Law
11 10 (2.69%) Automotive
11 10 (2.69%) Electronics
11 10 (2.69%) Presentation Skills
12 9 (2.42%) Pharmaceutical
13 8 (2.15%) Banking
14 7 (1.88%) Documentation Skills
14 7 (1.88%) Inclusion and Diversity
15 6 (1.61%) Military
15 6 (1.61%) Retail
16 4 (1.08%) Legal
Job Titles
1 89 (23.92%) Network Engineer
2 84 (22.58%) Support Engineer
3 71 (19.09%) Technical Engineer
4 67 (18.01%) Technical Support
5 59 (15.86%) Technical Support Engineer
6 38 (10.22%) Senior
7 36 (9.68%) Administrator
8 34 (9.14%) Analyst
9 31 (8.33%) Infrastructure Engineer
10 30 (8.06%) Systems Administrator
11 26 (6.99%) IT Engineer
11 26 (6.99%) IT Support
12 22 (5.91%) Senior Network Engineer
13 20 (5.38%) NOC Engineer
14 19 (5.11%) Architect
15 18 (4.84%) Support Analyst
16 14 (3.76%) Cisco Engineer
16 14 (3.76%) IT Support Engineer
17 13 (3.49%) 3rd Line Engineer
17 13 (3.49%) Security Engineer
Libraries, Frameworks & Software Standards
1 14 (3.76%) 802.1X
2 4 (1.08%) ModSecurity
3 1 (0.27%) AngularJS
3 1 (0.27%) LAMP
3 1 (0.27%) React
3 1 (0.27%) SAML
3 1 (0.27%) Svelte
3 1 (0.27%) SvelteKit
Miscellaneous
1 43 (11.56%) Data Centre
2 41 (11.02%) Driving Licence
3 26 (6.99%) e-Learning
4 18 (4.84%) CCTV
5 13 (3.49%) Onboarding
6 10 (2.69%) Renewable Energy
7 9 (2.42%) Management Information System
8 8 (2.15%) Enterprise Software
8 8 (2.15%) Security Operations Centre
9 6 (1.61%) Handset
9 6 (1.61%) Public Cloud
9 6 (1.61%) Security Posture
10 5 (1.34%) Foreign Exchange (FX)
10 5 (1.34%) LIMS
10 5 (1.34%) Private Cloud
10 5 (1.34%) SCADA
10 5 (1.34%) Self-Motivation
11 4 (1.08%) Analytical Mindset
11 4 (1.08%) Hybrid Cloud
11 4 (1.08%) Smartphone
Operating Systems
1 92 (24.73%) Windows
2 70 (18.82%) Linux
3 55 (14.78%) Windows Server
4 32 (8.60%) Unix
5 21 (5.65%) Windows 10
6 12 (3.23%) Windows Server 2016
7 9 (2.42%) Red Hat Enterprise Linux
8 6 (1.61%) Windows Server 2019
9 5 (1.34%) Android
10 2 (0.54%) CentOS
10 2 (0.54%) Windows Server 2012
11 1 (0.27%) Mac OS
11 1 (0.27%) Ubuntu
Processes & Methodologies
1 102 (27.42%) Customer Service
2 78 (20.97%) Mentoring
3 75 (20.16%) ITIL
4 67 (18.01%) Problem-Solving
5 54 (14.52%) High Availability
6 47 (12.63%) Commercial Awareness
7 46 (12.37%) Cybersecurity
8 42 (11.29%) Infrastructure Engineering
9 33 (8.87%) Kalman Filter
10 32 (8.60%) Project Delivery
11 28 (7.53%) Service Delivery
12 27 (7.26%) Requirements Gathering
13 26 (6.99%) Innovative Thinking
13 26 (6.99%) Proactive Monitoring
13 26 (6.99%) Web Filtering
14 24 (6.45%) Continuous Improvement
14 24 (6.45%) Regulatory Change
15 23 (6.18%) Presales
16 21 (5.65%) Network Design
16 21 (5.65%) Security Operations
Programming Languages
1 34 (9.14%) PowerShell
2 28 (7.53%) Python
3 8 (2.15%) Bash
4 3 (0.81%) Bicep
5 2 (0.54%) C
5 2 (0.54%) R
5 2 (0.54%) VB
6 1 (0.27%) Go
6 1 (0.27%) SQL
Qualifications
1 372 (100.00%) Cisco Certification
2 154 (41.40%) CCNP
3 107 (28.76%) Security Cleared
4 84 (22.58%) SC Cleared
5 83 (22.31%) JNCIA
6 65 (17.47%) Microsoft Certification
7 59 (15.86%) Degree
8 50 (13.44%) DV Cleared
9 44 (11.83%) MCSE
10 37 (9.95%) Network+ Certification
11 35 (9.41%) MCSA
12 24 (6.45%) MCP
13 20 (5.38%) DBS Check
14 16 (4.30%) CCIE
14 16 (4.30%) VMware Certified Professional (VCP)
15 14 (3.76%) CompTIA Security+
16 13 (3.49%) CISSP
16 13 (3.49%) Computer Science Degree
17 11 (2.96%) JNCIS
18 10 (2.69%) Azure Certification
Quality Assurance & Compliance
1 24 (6.45%) Cyber Essentials
1 24 (6.45%) SLA
2 15 (4.03%) GDPR
3 14 (3.76%) ISO/IEC 27001
4 13 (3.49%) NIST
5 7 (1.88%) GxP
6 5 (1.34%) 21 CFR Part 11
7 3 (0.81%) Actionable Recommendations
7 3 (0.81%) ITGC
7 3 (0.81%) Sarbanes-Oxley
8 2 (0.54%) Accessibility
9 1 (0.27%) HIPAA
System Software
1 58 (15.59%) Active Directory
2 27 (7.26%) VMware Infrastructure
3 22 (5.91%) Hyper-V
4 17 (4.57%) vSphere
5 12 (3.23%) Virtual Machines
6 6 (1.61%) Docker
7 5 (1.34%) VMware ESXi
8 4 (1.08%) BitLocker
8 4 (1.08%) EMC RecoverPoint
8 4 (1.08%) Firmware
8 4 (1.08%) pfSense
9 3 (0.81%) KVM
9 3 (0.81%) Virtual Servers
10 2 (0.54%) Citrix Hypervisor
10 2 (0.54%) Microsoft Virtual Server
10 2 (0.54%) RHEV
10 2 (0.54%) Samba
10 2 (0.54%) Squid
10 2 (0.54%) Xen
11 1 (0.27%) NFS
Systems Management
1 36 (9.68%) Microsoft Intune
2 16 (4.30%) Ansible
3 15 (4.03%) FortiGate
4 11 (2.96%) Terraform
5 10 (2.69%) SCCM
6 9 (2.42%) Kubernetes
7 8 (2.15%) Autotask
8 7 (1.88%) Jamf Pro
9 6 (1.61%) Cisco CUCM
9 6 (1.61%) vCenter Server
10 4 (1.08%) Grafana
10 4 (1.08%) Nagios
10 4 (1.08%) VxRail
11 3 (0.81%) ArcSight ESM
11 3 (0.81%) Nmap
11 3 (0.81%) Prometheus
11 3 (0.81%) QRadar
12 2 (0.54%) CASB
12 2 (0.54%) PaperCut
12 2 (0.54%) Systems Management Server (SMS)
Vendors
1 223 (59.95%) Cisco
2 104 (27.96%) Microsoft
3 60 (16.13%) Juniper
4 57 (15.32%) Fortinet
5 55 (14.78%) VMware
6 41 (11.02%) Meraki
7 26 (6.99%) Palo Alto
8 24 (6.45%) SolarWinds
9 22 (5.91%) Aruba
10 21 (5.65%) CheckPoint
11 15 (4.03%) Citrix
12 14 (3.76%) Freshdesk
13 13 (3.49%) Apple
13 13 (3.49%) F5
13 13 (3.49%) Starlink
14 12 (3.23%) Dell
14 12 (3.23%) Remedy
15 11 (2.96%) HP
15 11 (2.96%) ServiceNow
16 10 (2.69%) Splunk