Apple iOS Jobs

Apple iOS
UK

The table below provides summary statistics for permanent job vacancies requiring Apple iOS skills. It includes a benchmarking guide to the annual salaries offered in vacancies that cited Apple iOS over the 6 months leading up to 19 March 2025, comparing them to the same period in the previous two years.

6 months to
19 Mar 2025
Same period 2024 Same period 2023
Rank 313 297 264
Rank change year-on-year -16 -33 -96
Permanent jobs citing Apple iOS 490 879 1,584
As % of all permanent jobs advertised in the UK 0.93% 1.00% 1.41%
As % of the Operating Systems category 7.48% 6.71% 8.84%
Number of salaries quoted 315 671 971
10th Percentile £30,000 £26,043 £28,625
25th Percentile £42,500 £31,250 £37,500
Median annual salary (50th Percentile) £60,000 £45,000 £56,250
Median % change year-on-year +33.33% -20.00% -6.25%
75th Percentile £77,500 £67,500 £78,125
90th Percentile £100,000 £90,000 £100,000
UK excluding London median annual salary £56,000 £38,500 £52,500
% change year-on-year +45.45% -26.67% -4.55%

All Operating Systems
UK

Apple iOS falls under the Operating Systems category. For comparison with the information above, the following table provides summary statistics for all permanent job vacancies requiring operating system skills.

Permanent vacancies with a requirement for operating system skills 6,554 13,098 17,911
As % of all permanent jobs advertised in the UK 12.48% 14.88% 15.99%
Number of salaries quoted 4,429 10,470 12,137
10th Percentile £27,750 £25,976 £27,000
25th Percentile £35,500 £31,250 £35,750
Median annual salary (50th Percentile) £50,000 £46,500 £52,500
Median % change year-on-year +7.53% -11.43% -
75th Percentile £70,000 £63,000 £72,000
90th Percentile £88,750 £80,113 £93,750
UK excluding London median annual salary £45,000 £42,500 £45,000
% change year-on-year +5.88% -5.56% -

Apple iOS
Job Vacancy Trend

Job postings citing Apple iOS as a proportion of all IT jobs advertised.
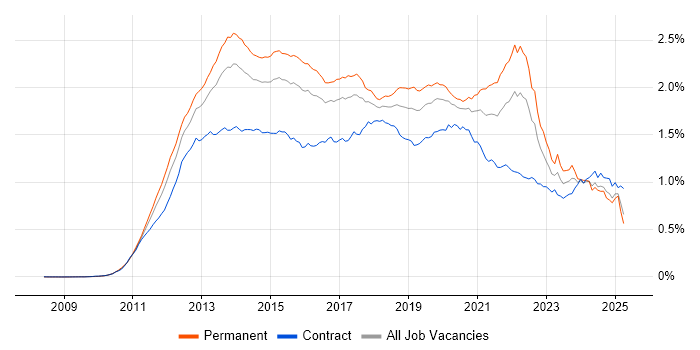
Job vacancy trend for Apple iOS in the UK

Apple iOS
Salary Trend

3-month moving average salary quoted in jobs citing Apple iOS.

Salary trend for Apple iOS in the UK

Apple iOS
Salary Histogram

Salary distribution for jobs citing Apple iOS over the 6 months to 19 March 2025.

Salary histogram for Apple iOS in the UK

Apple iOS
Top 16 Job Locations

The table below looks at the demand and provides a guide to the median salaries quoted in IT jobs citing Apple iOS within the UK over the 6 months to 19 March 2025. The 'Rank Change' column provides an indication of the change in demand within each location based on the same 6 month period last year.

Location Rank Change
on Same Period
Last Year
Matching
Permanent
IT Job Ads
Median Salary
Past 6 Months
Median Salary
% Change
on Same Period
Last Year
Live
Jobs
England -40 434 £60,000 +33.33% 216
UK excluding London -5 314 £56,000 +45.45% 94
Work from Home +59 240 £65,000 +30.00% 125
London +6 169 £75,000 +15.38% 137
South East +26 82 £47,500 +37.68% 20
Midlands +21 61 £70,000 +100.00% 13
Scotland +122 50 £75,000 +50.00% 9
South West +50 49 £60,000 +33.33% 8
West Midlands +33 48 £70,000 +100.00% 8
East of England +12 42 £50,000 +42.86% 17
North of England -45 30 £61,250 +50.56% 25
North West -40 22 £63,750 +41.67% 17
East Midlands +14 13 £31,250 +0.81% 5
Yorkshire +22 7 £47,500 +35.71% 5
Northern Ireland +32 1 - - 1
North East - 1 - - 3

Apple iOS
Co-occurring Skills and Capabilities by Category

The follow tables expand on the table above by listing co-occurrences grouped by category. The same employment type, locality and period is covered with up to 20 co-occurrences shown in each of the following categories:

Application Platforms
1 32 (6.53%) SharePoint
2 28 (5.71%) Microsoft Exchange
3 5 (1.02%) IBM Domino
4 4 (0.82%) Apache
4 4 (0.82%) CMS
4 4 (0.82%) Confluence
4 4 (0.82%) nginx
4 4 (0.82%) Tomcat
5 3 (0.61%) Oracle SOA Suite
6 2 (0.41%) WordPress
7 1 (0.20%) Drupal
7 1 (0.20%) Exchange Server 2010
7 1 (0.20%) Magnolia
7 1 (0.20%) SharePoint Server
7 1 (0.20%) Skype for Business
Applications
1 36 (7.35%) Microsoft Office
2 5 (1.02%) Microsoft Excel
3 4 (0.82%) Microsoft PowerPoint
4 3 (0.61%) Adobe XD
4 3 (0.61%) Sketch
4 3 (0.61%) UserZoom
5 2 (0.41%) Acrobat
Business Applications
1 2 (0.41%) Shopify
2 1 (0.20%) NetSuite
Cloud Services
1 123 (25.10%) Azure
2 106 (21.63%) Microsoft 365
3 48 (9.80%) Entra ID
4 45 (9.18%) AWS
5 39 (7.96%) GitHub
6 24 (4.90%) Azure DevOps
7 20 (4.08%) Firebase
7 20 (4.08%) OneDrive
8 19 (3.88%) Figma
9 11 (2.24%) Google Play
9 11 (2.24%) SaaS
10 8 (1.63%) GitHub Actions
11 7 (1.43%) Cloud Computing
11 7 (1.43%) Mimecast
12 6 (1.22%) Apigee
12 6 (1.22%) GCP
12 6 (1.22%) PaaS
13 5 (1.02%) BrowserStack
13 5 (1.02%) Kibo
13 5 (1.02%) Sauce Labs
Communications & Networking
1 33 (6.73%) Broadband
2 22 (4.49%) Firewall
3 21 (4.29%) DNS
3 21 (4.29%) LAN
4 20 (4.08%) DHCP
5 19 (3.88%) WAN
6 16 (3.27%) Wi-Fi
7 14 (2.86%) Wireless
8 12 (2.45%) TCP/IP
9 10 (2.04%) Internet
9 10 (2.04%) VoIP
9 10 (2.04%) VPN
9 10 (2.04%) WLAN
10 9 (1.84%) Remote Desktop
11 8 (1.63%) VLAN
12 7 (1.43%) HTTP
12 7 (1.43%) SAN
13 5 (1.02%) Bluetooth
13 5 (1.02%) Network Security
14 4 (0.82%) SSL
Database & Business Intelligence
1 17 (3.47%) MySQL
2 14 (2.86%) NoSQL
2 14 (2.86%) SQL Server
3 11 (2.24%) SQLite
4 10 (2.04%) PostgreSQL
5 8 (1.63%) MariaDB
6 7 (1.43%) Amazon RDS
6 7 (1.43%) GIS
7 3 (0.61%) Relational Database
8 1 (0.20%) Azure SQL Database
8 1 (0.20%) BigQuery
8 1 (0.20%) DB2
8 1 (0.20%) DynamoDB
8 1 (0.20%) MongoDB
8 1 (0.20%) MS Access
8 1 (0.20%) Power BI
Development Applications
1 49 (10.00%) Git
2 26 (5.31%) Xcode
3 19 (3.88%) Jenkins
4 18 (3.67%) Appium
5 14 (2.86%) XCTest
6 13 (2.65%) XCUITest
7 12 (2.45%) Gradle
7 12 (2.45%) JIRA
8 11 (2.24%) Bitbucket
9 9 (1.84%) GitLab
10 8 (1.63%) Android Studio
10 8 (1.63%) SonarQube
11 5 (1.02%) Cucumber
11 5 (1.02%) Selenium
12 4 (0.82%) CircleCI
12 4 (0.82%) JUnit
12 4 (0.82%) SpecFlow
12 4 (0.82%) TestNG
13 3 (0.61%) Eclipse
13 3 (0.61%) Maven
General
1 136 (27.76%) Social Skills
2 91 (18.57%) Finance
3 59 (12.04%) Games
4 33 (6.73%) Front Office
4 33 (6.73%) Italian Language
5 22 (4.49%) Analytical Skills
5 22 (4.49%) Inclusion and Diversity
6 16 (3.27%) Banking
7 12 (2.45%) Aviation
7 12 (2.45%) Electronics
7 12 (2.45%) Legal
8 11 (2.24%) Law
8 11 (2.24%) Marketing
9 10 (2.04%) Manufacturing
10 9 (1.84%) Telecoms
11 8 (1.63%) Public Sector
12 6 (1.22%) Automotive
12 6 (1.22%) Documentation Skills
12 6 (1.22%) Publishing
13 5 (1.02%) Retail
Job Titles
1 146 (29.80%) Developer
2 114 (23.27%) Analyst
3 100 (20.41%) Senior
4 55 (11.22%) Service Analyst
5 54 (11.02%) Service Desk Analyst
6 50 (10.20%) Senior Developer
7 40 (8.16%) Lead
8 38 (7.76%) iOS Developer
9 35 (7.14%) Product Manager
10 33 (6.73%) Business Analyst
10 33 (6.73%) Business Manager
10 33 (6.73%) Product Analyst
10 33 (6.73%) Product Business Analyst
10 33 (6.73%) Xamarin Developer
11 32 (6.53%) Senior Xamarin Developer
12 30 (6.12%) IT Support
12 30 (6.12%) Software Engineer
13 26 (5.31%) Android Developer
13 26 (5.31%) Mobile Developer
14 24 (4.90%) Support Engineer
Libraries, Frameworks & Software Standards
1 64 (13.06%) .NET
2 45 (9.18%) RESTful
3 44 (8.98%) React Native
4 41 (8.37%) React
5 33 (6.73%) SwiftUI
6 30 (6.12%) REST
7 25 (5.10%) .NET Core
8 23 (4.69%) HTML
9 22 (4.49%) MvvmCross
10 21 (4.29%) AngularJS
11 20 (4.08%) CSS
11 20 (4.08%) Entity Framework
12 18 (3.67%) .NET Framework
12 18 (3.67%) Node.js
13 17 (3.47%) Web Services
14 15 (3.06%) Flutter
15 12 (2.45%) HTML5
15 12 (2.45%) Laravel
16 11 (2.24%) ASP.NET
16 11 (2.24%) UIKit
Miscellaneous
1 159 (32.45%) Mobile App
2 54 (11.02%) Product Ownership
3 34 (6.94%) Hedge funds
4 33 (6.73%) Derivative
4 33 (6.73%) Equities
4 33 (6.73%) Fixed Income
4 33 (6.73%) Foreign Exchange (FX)
5 20 (4.08%) Greenfield Project
6 17 (3.47%) Algorithms
6 17 (3.47%) Mobile Games
7 16 (3.27%) Data Structures
8 13 (2.65%) Educational Technology
9 12 (2.45%) Virtual Team
10 11 (2.24%) Onboarding
10 11 (2.24%) Video Conferencing
11 10 (2.04%) Self-Motivation
12 9 (1.84%) Driving Licence
12 9 (1.84%) Legacy Systems
12 9 (1.84%) Smartphone
13 7 (1.43%) Replication
Operating Systems
1 317 (64.69%) Android
2 179 (36.53%) Windows
3 82 (16.73%) Windows 10
4 80 (16.33%) Mac OS
5 27 (5.51%) Windows Server
6 19 (3.88%) Linux
7 6 (1.22%) VMS
8 4 (0.82%) Windows Server 2012
8 4 (0.82%) Windows Server 2019
9 2 (0.41%) Mac OS X
9 2 (0.41%) Windows Server 2016
10 1 (0.20%) Windows Phone
10 1 (0.20%) Windows Phone 7
10 1 (0.20%) Windows Server 2003
Processes & Methodologies
1 158 (32.24%) Agile
2 146 (29.80%) Problem-Solving
3 106 (21.63%) iOS Development
4 99 (20.20%) Roadmaps
5 97 (19.80%) Customer Service
5 97 (19.80%) User Experience
6 85 (17.35%) CI/CD
7 80 (16.33%) Mobile Development
8 69 (14.08%) Android Development
9 64 (13.06%) DevOps
10 63 (12.86%) Mobile Application Development
11 56 (11.43%) Mentoring
12 53 (10.82%) Software Engineering
13 51 (10.41%) Asset Management
14 50 (10.20%) Test Automation
15 45 (9.18%) ITIL
15 45 (9.18%) Technology Roadmap
16 43 (8.78%) Artificial Intelligence
16 43 (8.78%) Customer Experience
16 43 (8.78%) Front End Development
Programming Languages
1 101 (20.61%) Swift
2 64 (13.06%) Java
3 60 (12.24%) C#
4 59 (12.04%) JavaScript
5 46 (9.39%) Objective-C
6 44 (8.98%) Kotlin
7 34 (6.94%) TypeScript
8 20 (4.08%) Python
9 17 (3.47%) SQL
10 16 (3.27%) C++
11 15 (3.06%) PHP
12 12 (2.45%) PowerShell
13 11 (2.24%) XAML
14 10 (2.04%) Dart
15 7 (1.43%) C
15 7 (1.43%) Go
16 5 (1.02%) Ruby
17 2 (0.41%) Rust
18 1 (0.20%) ANSI SQL
18 1 (0.20%) T-SQL
Qualifications
1 68 (13.88%) Degree
2 20 (4.08%) Computer Science Degree
3 9 (1.84%) Microsoft Certification
4 8 (1.63%) DBS Check
5 7 (1.43%) A+ Certification
5 7 (1.43%) Security Cleared
6 6 (1.22%) Azure Certification
7 5 (1.02%) SC Cleared
8 4 (0.82%) Cisco Certification
8 4 (0.82%) MCSA
8 4 (0.82%) Network+ Certification
9 3 (0.61%) CCNA
9 3 (0.61%) MCP
10 2 (0.41%) BPSS Clearance
10 2 (0.41%) CCA
10 2 (0.41%) Citrix Certification
10 2 (0.41%) DV Cleared
10 2 (0.41%) ITIL Certification
10 2 (0.41%) ITIL Foundation Certificate
10 2 (0.41%) MCSE
Quality Assurance & Compliance
1 65 (13.27%) QA
2 19 (3.88%) Accessibility
3 13 (2.65%) ISO/IEC 27001
4 11 (2.24%) GDPR
5 8 (1.63%) WCAG
6 7 (1.43%) SLA
7 2 (0.41%) ISO 9001
8 1 (0.20%) ISO 13485
8 1 (0.20%) NCSC
8 1 (0.20%) PMO
System Software
1 86 (17.55%) Active Directory
2 21 (4.29%) Hyper-V
3 16 (3.27%) VMware Infrastructure
4 15 (3.06%) Virtual Desktop
5 9 (1.84%) Docker
6 5 (1.02%) Firmware
6 5 (1.02%) Virtual Machines
7 4 (0.82%) BitLocker
8 3 (0.61%) LXC
9 2 (0.41%) Embedded Firmware
9 2 (0.41%) XenApp
9 2 (0.41%) XenDesktop
10 1 (0.20%) Microsoft App-V
10 1 (0.20%) VMware NSX
10 1 (0.20%) vSphere
Systems Management
1 41 (8.37%) Microsoft Intune
2 14 (2.86%) SCCM
3 12 (2.45%) Kubernetes
4 6 (1.22%) AirWatch
5 4 (0.82%) Terraform
6 2 (0.41%) Backup Exec
6 2 (0.41%) Symantec Endpoint Protection
7 1 (0.20%) Active Directory Federation Services
7 1 (0.20%) Failover Clustering
7 1 (0.20%) FortiGate
7 1 (0.20%) Jamf Pro
7 1 (0.20%) Single Sign-On
7 1 (0.20%) Systems Management Server (SMS)
7 1 (0.20%) vCenter Server
Vendors
1 123 (25.10%) Microsoft
2 58 (11.84%) Apple
3 36 (7.35%) Xamarin
4 25 (5.10%) Google
5 21 (4.29%) VMware
6 17 (3.47%) Citrix
7 13 (2.65%) ServiceNow
8 10 (2.04%) Sophos
9 8 (1.63%) New Relic
10 7 (1.43%) HP
10 7 (1.43%) IBM
10 7 (1.43%) Samsung
11 6 (1.22%) N-able
11 6 (1.22%) OpenAI
12 5 (1.02%) Adobe
12 5 (1.02%) Oracle
13 4 (0.82%) Dell
13 4 (0.82%) Meraki
13 4 (0.82%) MobileIron
14 3 (0.61%) iManage