Microsoft Certified Solutions Associate (MCSA) formerly Microsoft Certified Systems Administrator
UK

The following table provides summary statistics for permanent job vacancies with a requirement for MCSA qualifications. Included is a benchmarking guide to the salaries offered over the 6 months to 7 December 2023 with a comparison to the same period in the previous 2 years.

6 months to
7 Dec 2023
Same period 2022 Same period 2021
Rank 582 819 696
Rank change year-on-year +237 -123 -223
Permanent jobs citing MCSA 148 256 413
As % of all permanent jobs advertised in the UK 0.28% 0.21% 0.32%
As % of the Qualifications category 0.86% 0.71% 1.30%
Number of salaries quoted 124 224 314
10th Percentile £29,300 £25,075 £27,900
25th Percentile £37,969 £30,500 £30,500
Median annual salary (50th Percentile) £55,000 £43,625 £42,500
Median % change year-on-year +26.07% +2.65% +6.25%
75th Percentile £67,500 £58,750 £55,175
90th Percentile £80,375 £65,500 £62,500
UK excluding London median annual salary £45,000 £42,400 £42,500
% change year-on-year +6.13% -0.24% +6.25%

All Academic and Professional Certifications
UK

MCSA is in the Academic Qualifications and Professional Certifications category. The following table is for comparison with the above and provides summary statistics for all permanent job vacancies with a requirement for academic qualifications or professional certifications.

Permanent vacancies requiring academic qualifications or professional certifications 17,261 36,220 31,728
As % of all permanent jobs advertised in the UK 32.58% 29.49% 24.76%
Number of salaries quoted 10,821 16,971 17,946
10th Percentile £31,207 £31,250 £31,250
25th Percentile £42,000 £41,250 £41,250
Median annual salary (50th Percentile) £57,500 £57,500 £55,000
Median % change year-on-year - +4.55% -
75th Percentile £75,000 £76,250 £73,000
90th Percentile £92,500 £93,750 £90,000
UK excluding London median annual salary £52,500 £50,000 £50,000
% change year-on-year +5.00% - +2.04%

MCSA
Job Vacancy Trend

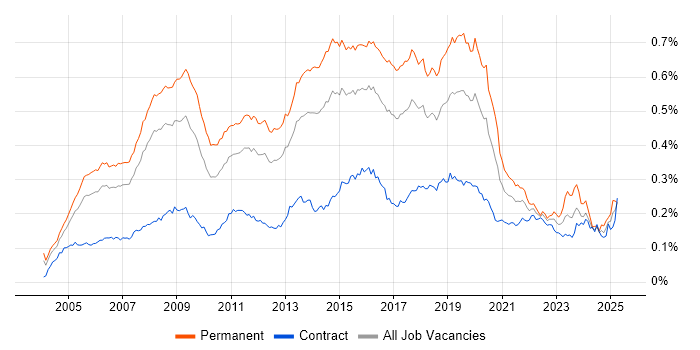
Job postings citing MCSA as a proportion of all IT jobs advertised.

Job vacancy trend for MCSA in the UK

MCSA
Salary Trend

3-month moving average salary quoted in jobs citing MCSA.

Salary trend for MCSA in the UK

MCSA
Salary Histogram

Salary distribution for jobs citing MCSA over the 6 months to 7 December 2023.

Salary histogram for MCSA in the UK

MCSA
Top 17 Job Locations

The table below looks at the demand and provides a guide to the median salaries quoted in IT jobs citing MCSA within the UK over the 6 months to 7 December 2023. The 'Rank Change' column provides an indication of the change in demand within each location based on the same 6 month period last year.

Location Rank Change
on Same Period
Last Year
Matching
Permanent
IT Job Ads
Median Salary
Past 6 Months
Median Salary
% Change
on Same Period
Last Year
Live
Jobs
England +219 128 £55,000 +26.44% 64
UK excluding London +140 76 £45,000 +6.13% 52
London +265 62 £65,000 +25.00% 20
Work from Home +186 51 £52,500 +10.53% 22
Midlands +125 21 £37,572 -13.63% 9
West Midlands +133 16 £30,000 +36.36% 3
South West +74 16 £47,500 +8.57% 6
South East +88 14 £54,250 +75.00% 15
North of England +103 10 £40,750 -15.98% 16
Wales +21 8 £35,250 +4.44% 1
Yorkshire +91 6 £40,750 +25.38% 6
East Midlands +40 5 £52,500 -12.50% 6
Scotland +35 4 - - 2
North West +89 3 £39,000 -30.67% 8
East of England +103 2 £46,000 -23.33% 3
Northern Ireland - 1 £60,000 - 2
North East - 1 £50,000 - 2

MCSA
Co-occurring Skills and Capabilities by Category

The follow tables expand on the table above by listing co-occurrences grouped by category. The same employment type, locality and period is covered with up to 20 co-occurrences shown in each of the following categories:

Application Platforms
1 31 (20.95%) MS Exchange
2 16 (10.81%) SharePoint
3 13 (8.78%) IIS
4 10 (6.76%) Apache
4 10 (6.76%) WebSphere
5 2 (1.35%) Skype for Business
6 1 (0.68%) Drupal
6 1 (0.68%) nginx
Applications
1 10 (6.76%) Microsoft Office
2 9 (6.08%) AutoCAD
2 9 (6.08%) PTC Creo
2 9 (6.08%) SOLIDWORKS
3 1 (0.68%) Microsoft Excel
3 1 (0.68%) Microsoft PowerPoint
Business Applications
1 1 (0.68%) Fidessa
1 1 (0.68%) Remedy ITSM
Cloud Services
1 85 (57.43%) Azure
2 74 (50.00%) Microsoft 365
3 30 (20.27%) Entra ID
4 24 (16.22%) AWS
5 21 (14.19%) IaaS
5 21 (14.19%) PaaS
6 12 (8.11%) Azure DevOps
7 10 (6.76%) GCP
8 8 (5.41%) OneDrive
9 6 (4.05%) Power Platform
9 6 (4.05%) SaaS
10 5 (3.38%) Amazon EKS
11 3 (2.03%) Amazon ECS
11 3 (2.03%) Azure Data Factory
12 2 (1.35%) AWS Data Pipeline
12 2 (1.35%) Azure AKS
12 2 (1.35%) Azure Synapse Analytics
12 2 (1.35%) GitHub
12 2 (1.35%) GitHub Actions
12 2 (1.35%) Serverless
Communications & Networking
1 46 (31.08%) Firewall
2 38 (25.68%) DNS
3 34 (22.97%) DHCP
4 26 (17.57%) VPN
5 25 (16.89%) SAN
6 20 (13.51%) LAN
6 20 (13.51%) WAN
7 19 (12.84%) VLAN
8 17 (11.49%) TCP/IP
9 7 (4.73%) Network Security
10 6 (4.05%) Internet
11 5 (3.38%) SSL
11 5 (3.38%) Wireless
12 4 (2.70%) Cisco ASA
12 4 (2.70%) Remote Desktop
12 4 (2.70%) Structured Cabling
12 4 (2.70%) Wi-Fi
13 3 (2.03%) WLAN
14 2 (1.35%) Cisco IOS
14 2 (1.35%) iSCSI
Database & Business Intelligence
1 35 (23.65%) SQL Server
2 10 (6.76%) SAP HANA
3 7 (4.73%) MySQL
4 6 (4.05%) Amazon RDS
4 6 (4.05%) Power BI
4 6 (4.05%) SQL Server Analysis Services
4 6 (4.05%) SQL Server Integration Services
4 6 (4.05%) SQL Server Reporting Services
5 5 (3.38%) Data Warehouse
5 5 (3.38%) Relational Database
5 5 (3.38%) Tableau
6 4 (2.70%) Oracle Database
6 4 (2.70%) PostgreSQL
6 4 (2.70%) RDBMS
7 2 (1.35%) Data Lake
7 2 (1.35%) InfluxDB
7 2 (1.35%) OLTP
8 1 (0.68%) Azure SQL Database
8 1 (0.68%) Microsoft Analysis Services
8 1 (0.68%) MongoDB
Development Applications
1 12 (8.11%) Git
2 10 (6.76%) Chocolatey
2 10 (6.76%) Jenkins
3 2 (1.35%) JIRA
General
1 50 (33.78%) Social Skills
2 25 (16.89%) Finance
3 17 (11.49%) Public Sector
4 14 (9.46%) Billing
5 10 (6.76%) Analytical Skills
5 10 (6.76%) Law
6 8 (5.41%) Banking
7 7 (4.73%) Telecoms
8 6 (4.05%) Legal
9 5 (3.38%) Documentation Skills
9 5 (3.38%) Retail
10 4 (2.70%) Influencing Skills
10 4 (2.70%) Investment Banking
11 2 (1.35%) Games
11 2 (1.35%) Inclusion and Diversity
12 1 (0.68%) Manufacturing
12 1 (0.68%) Organisational Skills
12 1 (0.68%) Pharmaceutical
12 1 (0.68%) Presentation Skills
12 1 (0.68%) Private Banking
Job Titles
1 26 (17.57%) Infrastructure Engineer
2 22 (14.86%) Senior
3 20 (13.51%) Architect
4 16 (10.81%) IT Engineer
5 15 (10.14%) Infrastructure Architect
6 14 (9.46%) Analyst
6 14 (9.46%) Automation Engineer
6 14 (9.46%) Azure Engineer
7 12 (8.11%) Cloud Engineer
8 11 (7.43%) Support Engineer
9 10 (6.76%) Consultant
10 9 (6.08%) Systems Engineer
11 8 (5.41%) Technical Engineer
12 7 (4.73%) Desktop Engineer
12 7 (4.73%) Developer
12 7 (4.73%) IT Support
12 7 (4.73%) Server Engineer
12 7 (4.73%) Service Analyst
12 7 (4.73%) Service Desk Analyst
13 6 (4.05%) Windows Engineer
Libraries, Frameworks & Software Standards
1 10 (6.76%) Elastic Stack
1 10 (6.76%) XML
1 10 (6.76%) YAML
2 6 (4.05%) .NET
3 2 (1.35%) AngularJS
3 2 (1.35%) ASP.NET
3 2 (1.35%) ASP.NET MVC
3 2 (1.35%) Kafka
3 2 (1.35%) Middleware
4 1 (0.68%) .NET Framework
4 1 (0.68%) FIX Protocol
4 1 (0.68%) Software Packaging
Miscellaneous
1 33 (22.30%) Data Centre
2 28 (18.92%) Public Cloud
3 23 (15.54%) Replication
4 15 (10.14%) Enterprise Software
5 10 (6.76%) Self-Motivation
6 9 (6.08%) Operational Technology
7 6 (4.05%) Management Information System
7 6 (4.05%) Product Ownership
8 5 (3.38%) Clustering
8 5 (3.38%) Mobile Computing
9 4 (2.70%) Driving Licence
10 3 (2.03%) Data Structures
10 3 (2.03%) SCADA
10 3 (2.03%) Video Conferencing
11 2 (1.35%) Distributed Denial-of-Service
12 1 (0.68%) Cloud Native
12 1 (0.68%) Eurex
12 1 (0.68%) IoT
12 1 (0.68%) Mobile App
12 1 (0.68%) Virtual Team
Operating Systems
1 92 (62.16%) Windows
2 70 (47.30%) Windows Server
3 28 (18.92%) Windows Server 2012
4 23 (15.54%) Linux
5 17 (11.49%) Windows 10
6 15 (10.14%) Ubuntu
7 14 (9.46%) SUSE
8 11 (7.43%) Windows Server 2016
8 11 (7.43%) Windows Server 2019
9 6 (4.05%) Windows Server 2008
10 5 (3.38%) Unix
11 4 (2.70%) VMS
12 3 (2.03%) Android
13 2 (1.35%) Windows 7
13 2 (1.35%) Windows 8
14 1 (0.68%) Apple iOS
14 1 (0.68%) Solaris
Processes & Methodologies
1 43 (29.05%) ITIL
2 36 (24.32%) Infrastructure Engineering
3 33 (22.30%) Problem-Solving
4 24 (16.22%) Mentoring
5 23 (15.54%) Disaster Recovery
6 22 (14.86%) Infrastructure as Code
7 21 (14.19%) DevOps
8 20 (13.51%) Asset Management
8 20 (13.51%) Computer Science
8 20 (13.51%) Customer Service
8 20 (13.51%) Migration
9 18 (12.16%) ERP
9 18 (12.16%) Network Monitoring
9 18 (12.16%) Virtual Infrastructure
10 17 (11.49%) CI/CD
10 17 (11.49%) Project Delivery
10 17 (11.49%) Server Building
11 16 (10.81%) Continuous Improvement
12 15 (10.14%) Presales
12 15 (10.14%) Task Automation
Programming Languages
1 60 (40.54%) PowerShell
2 47 (31.76%) SQL
3 13 (8.78%) Bash
4 9 (6.08%) MATLAB
5 5 (3.38%) Bicep
6 4 (2.70%) Python
7 3 (2.03%) C#
7 3 (2.03%) JavaScript
7 3 (2.03%) T-SQL
8 2 (1.35%) VBScript
9 1 (0.68%) VB.NET
Qualifications
1 148 (100.00%) Microsoft Certification
2 81 (54.73%) MCSE
3 52 (35.14%) Degree
4 32 (21.62%) Cisco Certification
5 28 (18.92%) CCNA
6 26 (17.57%) VMware Certified Professional (VCP)
7 20 (13.51%) MCP
8 18 (12.16%) Azure Certification
9 17 (11.49%) A+ Certification
10 16 (10.81%) Security Cleared
11 14 (9.46%) Computer Science Degree
12 13 (8.78%) CompTIA Security+
13 12 (8.11%) AWS Certification
14 11 (7.43%) CCNP
15 10 (6.76%) AWS Certified Solutions Architect
16 7 (4.73%) Network+ Certification
16 7 (4.73%) SC Cleared
17 6 (4.05%) MCDST
18 5 (3.38%) MCITP
18 5 (3.38%) VTSP
Quality Assurance & Compliance
1 6 (4.05%) GDPR
2 2 (1.35%) PCI DSS
2 2 (1.35%) SLA
3 1 (0.68%) Data Quality
3 1 (0.68%) GxP
3 1 (0.68%) ISO/IEC 27001
3 1 (0.68%) NIST
3 1 (0.68%) Sarbanes-Oxley
System Software
1 98 (66.22%) Active Directory
2 50 (33.78%) VMware Infrastructure
3 22 (14.86%) vSphere
4 14 (9.46%) Hyper-V
4 14 (9.46%) vCloud
5 7 (4.73%) Virtual Machines
5 7 (4.73%) VMware ESXi
6 4 (2.70%) VMware NSX
7 2 (1.35%) Docker
8 1 (0.68%) BitLocker
8 1 (0.68%) Terminal Services
8 1 (0.68%) Virtual Servers
Systems Management
1 30 (20.27%) SCCM
2 27 (18.24%) Terraform
3 21 (14.19%) SCOM
4 17 (11.49%) Ansible
5 16 (10.81%) Active Directory Federation Services
6 14 (9.46%) Microsoft Intune
7 8 (5.41%) Single Sign-On
8 5 (3.38%) Kubernetes
9 3 (2.03%) Failover Clustering
9 3 (2.03%) FortiGate
9 3 (2.03%) Oracle RMAN
9 3 (2.03%) WSUS
10 2 (1.35%) Grafana
10 2 (1.35%) Prometheus
10 2 (1.35%) vCenter Server
11 1 (0.68%) Data Guard
11 1 (0.68%) DatAdvantage
11 1 (0.68%) Demisto
Vendors
1 110 (74.32%) Microsoft
2 63 (42.57%) VMware
3 27 (18.24%) Cisco
3 27 (18.24%) HP
4 20 (13.51%) Oracle
5 18 (12.16%) Veeam
6 14 (9.46%) Fujitsu
7 10 (6.76%) IBM
7 10 (6.76%) Red Hat
7 10 (6.76%) SAP
7 10 (6.76%) TOWER Software
8 9 (6.08%) MathWorks
8 9 (6.08%) PTC
9 7 (4.73%) Citrix
9 7 (4.73%) Dell
10 5 (3.38%) Aruba
10 5 (3.38%) Bloomberg
10 5 (3.38%) SolarWinds
11 4 (2.70%) FactSet
11 4 (2.70%) MobileIron