Microsoft Azure Certification
UK

The following table provides summary statistics for permanent job vacancies with a requirement for Azure Certification qualifications. Included is a benchmarking guide to the salaries offered over the 6 months to 10 December 2023 with a comparison to the same period in the previous 2 years.

6 months to
10 Dec 2023
Same period 2022 Same period 2021
Rank 289 262 382
Rank change year-on-year -27 +120 -27
Permanent jobs citing Azure Certification 584 1,743 1,125
As % of all permanent jobs advertised in the UK 1.12% 1.43% 0.89%
As % of the Qualifications category 3.42% 4.84% 3.59%
Number of salaries quoted 479 811 748
10th Percentile £33,781 £40,875 £38,500
25th Percentile £52,500 £53,750 £52,500
Median annual salary (50th Percentile) £67,000 £72,500 £65,000
Median % change year-on-year -7.59% +11.54% -
75th Percentile £90,000 £86,250 £78,563
90th Percentile £110,000 £96,250 £92,500
UK excluding London median annual salary £60,000 £72,500 £60,000
% change year-on-year -17.24% +20.83% -

All Academic and Professional Certifications
UK

Azure Certification is in the Academic Qualifications and Professional Certifications category. The following table is for comparison with the above and provides summary statistics for all permanent job vacancies with a requirement for academic qualifications or professional certifications.

Permanent vacancies requiring academic qualifications or professional certifications 17,067 35,981 31,364
As % of all permanent jobs advertised in the UK 32.65% 29.44% 24.68%
Number of salaries quoted 10,705 16,977 17,903
10th Percentile £31,000 £31,250 £31,250
25th Percentile £41,670 £41,250 £41,250
Median annual salary (50th Percentile) £57,500 £57,500 £55,000
Median % change year-on-year - +4.55% -
75th Percentile £75,000 £76,250 £73,750
90th Percentile £92,500 £93,750 £90,000
UK excluding London median annual salary £52,500 £50,000 £50,000
% change year-on-year +5.00% - +2.04%

Azure Certification
Job Vacancy Trend

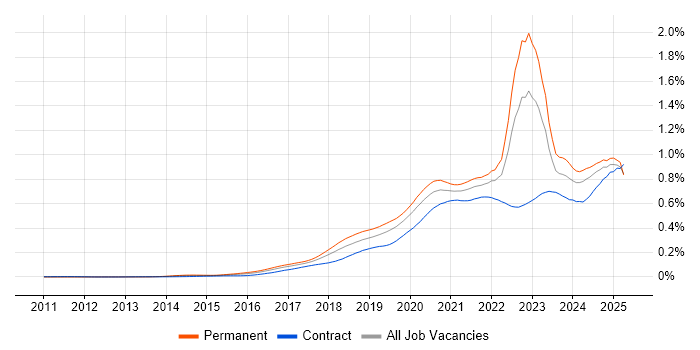
Job postings citing Azure Certification as a proportion of all IT jobs advertised.

Job vacancy trend for Azure Certification in the UK

Azure Certification
Salary Trend

3-month moving average salary quoted in jobs citing Azure Certification.

Salary trend for Azure Certification in the UK

Azure Certification
Salary Histogram

Salary distribution for jobs citing Azure Certification over the 6 months to 10 December 2023.

Salary histogram for Azure Certification in the UK

Azure Certification
Top 17 Job Locations

The table below looks at the demand and provides a guide to the median salaries quoted in IT jobs citing Azure Certification within the UK over the 6 months to 10 December 2023. The 'Rank Change' column provides an indication of the change in demand within each location based on the same 6 month period last year.

Location Rank Change
on Same Period
Last Year
Matching
Permanent
IT Job Ads
Median Salary
Past 6 Months
Median Salary
% Change
on Same Period
Last Year
Live
Jobs
England -33 487 £67,000 -9.46% 170
UK excluding London -92 288 £60,000 -17.24% 103
Work from Home +113 247 £73,500 +5.00% 102
London +84 231 £80,000 +6.67% 70
South East +133 94 £65,000 +10.17% 30
North of England -108 69 £42,500 -46.88% 34
Midlands -36 42 £60,000 -14.29% 17
Yorkshire -40 37 £34,500 -56.88% 13
South West +21 36 £70,000 +7.69% 7
Scotland -37 33 £69,447 +15.75% 12
North West -85 28 £55,000 -31.25% 14
West Midlands -8 27 £60,000 -17.24% 7
East Midlands +14 15 £62,500 +92.31% 9
East of England +78 7 £26,000 -52.73% 3
Wales +18 5 £50,000 -27.54% 1
North East +40 4 £32,500 -55.17% 8
Northern Ireland - 2 £85,000 -

Azure Certification
Co-occurring Skills and Capabilities by Category

The follow tables expand on the table above by listing co-occurrences grouped by category. The same employment type, locality and period is covered with up to 20 co-occurrences shown in each of the following categories:

Application Platforms
1 21 (3.60%) MS Exchange
2 15 (2.57%) IIS
2 15 (2.57%) SharePoint
3 11 (1.88%) Apache
4 8 (1.37%) WebSphere
5 7 (1.20%) Apache Spark
6 4 (0.68%) CMS
6 4 (0.68%) Umbraco
7 3 (0.51%) Apache Airflow
8 2 (0.34%) OpenStack
9 1 (0.17%) Confluence
9 1 (0.17%) Jupyter
Applications
1 7 (1.20%) AutoCAD
1 7 (1.20%) PTC Creo
1 7 (1.20%) SOLIDWORKS
2 6 (1.03%) Microsoft Office
3 3 (0.51%) Microsoft Excel
4 2 (0.34%) MS Visio
5 1 (0.17%) Microsoft Project
Business Applications
1 4 (0.68%) Remedy ITSM
2 2 (0.34%) Misys Equation
3 1 (0.17%) Aareon QL
3 1 (0.17%) Dynamics CRM
3 1 (0.17%) MIS ActiveH
3 1 (0.17%) OPENHousing
3 1 (0.17%) SAP S/4HANA
Cloud Services
1 584 (100.00%) Azure
2 140 (23.97%) Microsoft 365
3 135 (23.12%) AWS
4 113 (19.35%) PaaS
5 96 (16.44%) Azure DevOps
6 95 (16.27%) IaaS
7 75 (12.84%) Entra ID
8 59 (10.10%) Power Platform
9 53 (9.08%) Serverless
10 52 (8.90%) Azure Monitor
11 43 (7.36%) GCP
12 41 (7.02%) SaaS
13 40 (6.85%) Azure Data Factory
14 39 (6.68%) Azure Cosmos DB
15 34 (5.82%) GitHub
16 31 (5.31%) Cloud Computing
17 27 (4.62%) Azure Synapse Analytics
18 26 (4.45%) Azure Sentinel
19 24 (4.11%) Azure Functions
20 17 (2.91%) Azure Storage
Communications & Networking
1 59 (10.10%) DNS
2 53 (9.08%) Firewall
3 49 (8.39%) DHCP
4 44 (7.53%) VPN
5 39 (6.68%) LAN
6 30 (5.14%) Wireless
7 22 (3.77%) SAN
8 20 (3.42%) WAN
9 17 (2.91%) Wi-Fi
10 12 (2.05%) NetScaler
10 12 (2.05%) VLAN
11 10 (1.71%) Network Security
12 8 (1.37%) TCP/IP
13 7 (1.20%) BGP
13 7 (1.20%) OSPF
14 6 (1.03%) IGMP
14 6 (1.03%) Intrusion Detection
14 6 (1.03%) IPsec
14 6 (1.03%) VRRP
14 6 (1.03%) WLAN
Database & Business Intelligence
1 91 (15.58%) SQL Server
2 43 (7.36%) Power BI
3 34 (5.82%) Data Lake
4 30 (5.14%) Azure SQL Database
5 28 (4.79%) Amazon RDS
6 26 (4.45%) Data Warehouse
7 19 (3.25%) Microsoft Analysis Services
8 16 (2.74%) Relational Database
9 15 (2.57%) NoSQL
10 12 (2.05%) Amazon Redshift
10 12 (2.05%) SQL Server Integration Services
11 10 (1.71%) SQL Server Analysis Services
12 9 (1.54%) PostgreSQL
12 9 (1.54%) SQL Server Reporting Services
13 8 (1.37%) SAP HANA
13 8 (1.37%) Tableau
14 7 (1.20%) DynamoDB
14 7 (1.20%) QlikView
14 7 (1.20%) ThoughtSpot
15 6 (1.03%) MongoDB
Development Applications
1 49 (8.39%) Git
2 29 (4.97%) Jenkins
3 15 (2.57%) GitLab
4 14 (2.40%) JIRA
5 10 (1.71%) Axure RP
6 8 (1.37%) Chocolatey
7 7 (1.20%) Artifactory
7 7 (1.20%) Sonatype Nexus
8 3 (0.51%) JIRA Agile
9 2 (0.34%) Cypress.io
9 2 (0.34%) Selenium
9 2 (0.34%) Subversion
9 2 (0.34%) Vagrant
10 1 (0.17%) TeamCity
General
1 182 (31.16%) Social Skills
2 146 (25.00%) Finance
3 58 (9.93%) Analytical Skills
4 47 (8.05%) Inclusion and Diversity
4 47 (8.05%) Public Sector
5 33 (5.65%) Banking
6 31 (5.31%) Presentation Skills
7 15 (2.57%) Retail
8 11 (1.88%) Financial Institution
8 11 (1.88%) Legal
9 10 (1.71%) Marketing
9 10 (1.71%) Organisational Skills
10 9 (1.54%) Law
11 7 (1.20%) Manufacturing
11 7 (1.20%) Telecoms
12 6 (1.03%) Local Government
13 5 (0.86%) Billing
13 5 (0.86%) Documentation Skills
13 5 (0.86%) Pharmaceutical
14 4 (0.68%) Influencing Skills
Job Titles
1 142 (24.32%) Architect
2 88 (15.07%) Infrastructure Engineer
3 79 (13.53%) Azure Engineer
4 72 (12.33%) Cloud Engineer
5 56 (9.59%) Senior
6 55 (9.42%) Azure Architect
7 54 (9.25%) Cloud Architect
8 48 (8.22%) Solutions Architect
9 40 (6.85%) Infrastructure Architect
10 38 (6.51%) Lead
11 35 (5.99%) Citrix Architect
12 34 (5.82%) Consultant
13 32 (5.48%) Analyst
13 32 (5.48%) Security Engineer
14 31 (5.31%) DevOps Engineer
15 28 (4.79%) Support Engineer
16 26 (4.45%) Cloud Infrastructure Architect
16 26 (4.45%) Data Engineer
16 26 (4.45%) Developer
16 26 (4.45%) Security Architect
Libraries, Frameworks & Software Standards
1 45 (7.71%) .NET
2 41 (7.02%) JSON
3 38 (6.51%) YAML
4 21 (3.60%) ARM Templates
4 21 (3.60%) XML
5 18 (3.08%) .NET Framework
6 16 (2.74%) AngularJS
6 16 (2.74%) REST
6 16 (2.74%) RESTful
7 15 (2.57%) Node.js
8 14 (2.40%) React
9 11 (1.88%) HTML
10 10 (1.71%) ASP.NET
10 10 (1.71%) CSS
10 10 (1.71%) Elastic Stack
11 9 (1.54%) Middleware
12 8 (1.37%) Spring
12 8 (1.37%) Spring Boot
13 7 (1.20%) Kafka
13 7 (1.20%) Vue
Miscellaneous
1 77 (13.18%) Public Cloud
2 49 (8.39%) Data Centre
3 40 (6.85%) Management Information System
4 26 (4.45%) Self-Motivation
5 19 (3.25%) Enterprise Software
6 18 (3.08%) Linux Command Line
7 17 (2.91%) Clustering
8 15 (2.57%) Cloud Native
9 13 (2.23%) Cyberattack
9 13 (2.23%) Onboarding
10 11 (1.88%) PKI
10 11 (1.88%) Private Cloud
11 10 (1.71%) Product Ownership
11 10 (1.71%) Virtual Team
12 9 (1.54%) IoT
12 9 (1.54%) iPhone
12 9 (1.54%) Team-Oriented Environment
13 8 (1.37%) Hybrid Cloud
14 7 (1.20%) Legacy Applications
14 7 (1.20%) Operational Technology
Operating Systems
1 138 (23.63%) Windows
2 78 (13.36%) Windows Server
3 30 (5.14%) Windows 10
4 29 (4.97%) Windows Server 2016
5 25 (4.28%) Windows Server 2012
5 25 (4.28%) Windows Server 2019
6 16 (2.74%) Linux
7 7 (1.20%) Android
8 4 (0.68%) Apple iOS
8 4 (0.68%) Unix
8 4 (0.68%) VMS
8 4 (0.68%) Windows 7
Processes & Methodologies
1 195 (33.39%) DevOps
2 147 (25.17%) Infrastructure as Code
3 129 (22.09%) Agile
4 123 (21.06%) Problem-Solving
5 95 (16.27%) ITIL
6 91 (15.58%) CI/CD
7 88 (15.07%) Infrastructure Engineering
8 87 (14.90%) Computer Science
9 77 (13.18%) Cloud Security
10 73 (12.50%) Analytics
11 59 (10.10%) Roadmaps
12 58 (9.93%) Cybersecurity
13 56 (9.59%) Stakeholder Management
14 54 (9.25%) Scrum
15 46 (7.88%) Asset Management
15 46 (7.88%) Coaching
15 46 (7.88%) Service Management
16 45 (7.71%) Migration
17 44 (7.53%) Information Security
18 43 (7.36%) Service Delivery
Programming Languages
1 129 (22.09%) PowerShell
2 119 (20.38%) SQL
3 82 (14.04%) Python
4 59 (10.10%) C#
5 58 (9.93%) Bash
6 44 (7.53%) Bicep
7 34 (5.82%) Java
8 26 (4.45%) JavaScript
9 10 (1.71%) VB
9 10 (1.71%) VBScript
10 9 (1.54%) Shell Script
11 8 (1.37%) R
12 7 (1.20%) Kusto Query Language
12 7 (1.20%) MATLAB
13 4 (0.68%) Dart
13 4 (0.68%) Ruby
14 3 (0.51%) C++
14 3 (0.51%) Go
14 3 (0.51%) Groovy
15 2 (0.34%) T-SQL
Qualifications
1 180 (30.82%) Degree
2 174 (29.79%) Microsoft Certification
3 95 (16.27%) AWS Certification
4 87 (14.90%) Security Cleared
5 66 (11.30%) Computer Science Degree
5 66 (11.30%) SC Cleared
6 39 (6.68%) CISSP
7 38 (6.51%) Cisco Certification
8 33 (5.65%) Master's Degree
9 32 (5.48%) ITIL Foundation Certificate
10 30 (5.14%) CISM
11 23 (3.94%) OSCP
12 22 (3.77%) AWS Certified Solutions Architect
13 18 (3.08%) DV Cleared
14 17 (2.91%) MCSA
15 15 (2.57%) TOGAF Certification
16 14 (2.40%) CCNP
16 14 (2.40%) MCSE
17 13 (2.23%) BPSS Clearance
17 13 (2.23%) CCNA
Quality Assurance & Compliance
1 39 (6.68%) SLA
2 26 (4.45%) ISO/IEC 27001
3 18 (3.08%) NIST
4 17 (2.91%) QA
5 15 (2.57%) Cyber Essentials
6 10 (1.71%) GDPR
7 7 (1.20%) Cyber Essentials PLUS
7 7 (1.20%) PCI DSS
8 6 (1.03%) Data Quality
8 6 (1.03%) DICOM
8 6 (1.03%) HL7
8 6 (1.03%) IASME
9 4 (0.68%) GRC
9 4 (0.68%) SOC 2
10 3 (0.51%) California Consumer Privacy Act
10 3 (0.51%) NCSC
11 2 (0.34%) Accessibility
11 2 (0.34%) JSP 440
11 2 (0.34%) NIST 800
11 2 (0.34%) WCAG
System Software
1 153 (26.20%) Active Directory
2 59 (10.10%) VMware Infrastructure
3 46 (7.88%) Virtual Machines
4 44 (7.53%) Docker
5 40 (6.85%) Hyper-V
6 22 (3.77%) Firmware
6 22 (3.77%) Virtual Desktop
7 6 (1.03%) XenApp
8 4 (0.68%) VMware ESXi
8 4 (0.68%) vSphere
9 3 (0.51%) Citrix Hypervisor
9 3 (0.51%) Virtual Servers
9 3 (0.51%) XenDesktop
10 2 (0.34%) Ceph
10 2 (0.34%) NFS
10 2 (0.34%) VMware NSX
11 1 (0.17%) BitLocker
11 1 (0.17%) HDFS
11 1 (0.17%) Microsoft Virtual Server
11 1 (0.17%) Terminal Services
Systems Management
1 140 (23.97%) Terraform
2 75 (12.84%) Kubernetes
3 61 (10.45%) Microsoft Intune
4 40 (6.85%) SCCM
5 39 (6.68%) Ansible
6 35 (5.99%) SCOM
7 22 (3.77%) Active Directory Federation Services
8 16 (2.74%) Failover Clustering
8 16 (2.74%) Istio
9 15 (2.57%) FortiGate
9 15 (2.57%) Microsoft Data Protection Manager
10 14 (2.40%) WSUS
11 11 (1.88%) Packer
12 8 (1.37%) Single Sign-On
13 7 (1.20%) Argo
14 6 (1.03%) Backup Exec
15 4 (0.68%) NetBackup
15 4 (0.68%) Progress Chef
15 4 (0.68%) Puppet
16 3 (0.51%) Hadoop YARN
Vendors
1 360 (61.64%) Microsoft
2 86 (14.73%) VMware
3 69 (11.82%) Citrix
4 50 (8.56%) Cisco
5 43 (7.36%) Google
6 28 (4.79%) Databricks
7 22 (3.77%) Aruba
8 19 (3.25%) Veeam
9 17 (2.91%) Commvault
10 16 (2.74%) Oracle
11 14 (2.40%) Barracuda Networks
11 14 (2.40%) Kaseya
12 12 (2.05%) SAP
13 11 (1.88%) TOWER Software
14 10 (1.71%) AppDynamics
14 10 (1.71%) Red Hat
14 10 (1.71%) Splunk
15 9 (1.54%) Dynatrace
15 9 (1.54%) IBM
15 9 (1.54%) ServiceNow