Re-Platforming Jobs with Work from Home Options

Re-Platforming
UK > Work from Home

The table below provides summary statistics for permanent job vacancies with an option to work from home (WFH) and a requirement for Re-Platforming skills. Included is a benchmarking guide to the salaries offered in vacancies that have cited Re-Platforming over the 6 months to 8 May 2024 with a comparison to the same period in the previous 2 years.

6 months to
8 May 2024
Same period 2023 Same period 2022
Rank 487 601 720
Rank change year-on-year +114 +119 -230
Permanent jobs citing Re-Platforming 106 62 132
As % of all permanent jobs with a WFH option 0.31% 0.15% 0.19%
As % of the Processes & Methodologies category 0.34% 0.16% 0.20%
Number of salaries quoted 57 48 78
10th Percentile £52,500 £52,500 £45,000
25th Percentile £56,809 £60,000 £55,000
Median annual salary (50th Percentile) £79,932 £72,500 £65,000
Median % change year-on-year +10.25% +11.54% -1.89%
75th Percentile £84,964 £105,625 £83,438
90th Percentile - £120,250 £93,250
UK median annual salary £79,932 £85,000 £71,640
% change year-on-year -5.96% +18.65% +0.55%

All Process and Methodology Skills
Work from Home

Re-Platforming is in the Processes and Methodologies category. The following table is for comparison with the above and provides summary statistics for all permanent job vacancies with a WFH option and a requirement for process or methodology skills.

Permanent vacancies with a requirement for process or methodology skills 30,965 39,955 66,612
As % of all permanent jobs with a WFH option 91.45% 96.10% 96.96%
Number of salaries quoted 23,443 27,739 41,261
10th Percentile £33,750 £37,500 £36,250
25th Percentile £42,500 £47,500 £45,750
Median annual salary (50th Percentile) £57,500 £62,500 £60,000
Median % change year-on-year -8.00% +4.17% +9.09%
75th Percentile £75,000 £82,500 £80,000
90th Percentile £95,000 £100,000 £95,000
UK median annual salary £55,000 £61,180 £60,000
% change year-on-year -10.10% +1.97% +9.09%

Re-Platforming
Trend for Jobs with a WFH Option

Job vacancies with a work from home option citing Re-Platforming as a proportion of all IT jobs advertised.
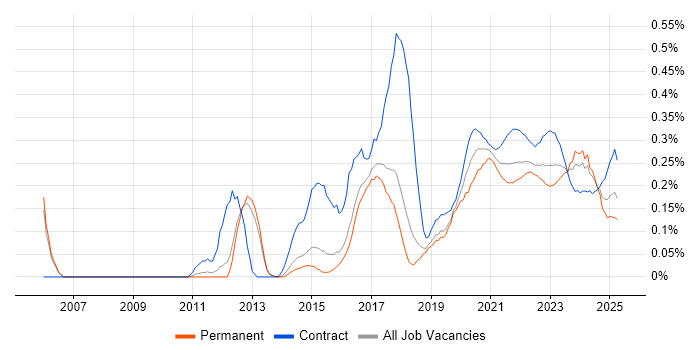
Re-Platforming trend for jobs with a WFH option

Re-Platforming
Salary Trend for Jobs with a WFH Option

3-month moving average salary quoted in job vacancies with a work from home option citing Re-Platforming.

Re-Platforming salary trend for jobs with a WFH option

Re-Platforming
Salary Histogram for Jobs with a WFH Option

Salary distribution for jobs with a work from home option citing Re-Platforming over the 6 months to 8 May 2024.

Re-Platforming salary histogram for jobs with a WFH option

Re-Platforming
Co-occurring Skills and Capabilities with WFH Options by Category

The follow tables expand on the table above by listing co-occurrences grouped by category. The same employment type, locality and period is covered with up to 20 co-occurrences shown in each of the following categories:

Application Platforms
1 46 (43.40%) WebLogic
2 1 (0.94%) Apache
2 1 (0.94%) Apache Airflow
Applications
1 2 (1.89%) Microsoft Project
Business Applications
1 46 (43.40%) Sparx Enterprise Architect
2 2 (1.89%) Shopify
Cloud Services
1 49 (46.23%) Azure
2 48 (45.28%) AWS
3 46 (43.40%) Amazon EKS
3 46 (43.40%) Amazon SQS
4 3 (2.83%) Azure DevOps
5 1 (0.94%) Cloudflare
5 1 (0.94%) dbt
5 1 (0.94%) Google Analytics
5 1 (0.94%) PaaS
5 1 (0.94%) Power Platform
5 1 (0.94%) SaaS
5 1 (0.94%) Serverless
Communications & Networking
1 47 (44.34%) DNS
2 46 (43.40%) BGP
2 46 (43.40%) SSL
2 46 (43.40%) TCP/IP
Database & Business Intelligence
1 46 (43.40%) Amazon RDS
1 46 (43.40%) Oracle Database
1 46 (43.40%) RDBMS
1 46 (43.40%) Relational Database
2 1 (0.94%) Big Data
2 1 (0.94%) Data Lake
2 1 (0.94%) Data Warehouse
2 1 (0.94%) Looker
2 1 (0.94%) Power BI
2 1 (0.94%) Tableau
Development Applications
1 2 (1.89%) JIRA
1 2 (1.89%) JIRA Agile
2 1 (0.94%) Git
General
1 48 (45.28%) Social Skills
2 8 (7.55%) Marketing
3 4 (3.77%) Retail
4 3 (2.83%) Finance
5 2 (1.89%) Presentation Skills
6 1 (0.94%) Analytical Skills
6 1 (0.94%) Front Office
6 1 (0.94%) Law
6 1 (0.94%) Tech for Good
Job Titles
1 78 (73.58%) Lead
2 54 (50.94%) Architect
2 54 (50.94%) Solutions Architect
3 46 (43.40%) Lead Architect
3 46 (43.40%) Lead Solutions Architect
4 29 (27.36%) Technical Leader
5 8 (7.55%) Senior
5 8 (7.55%) Senior Architect
5 8 (7.55%) Senior Solutions Architect
6 7 (6.60%) Digital Marketing Manager
6 7 (6.60%) Marketing Manager
6 7 (6.60%) Transformation Manager
6 7 (6.60%) Web Manager
6 7 (6.60%) Web Marketing Manager
6 7 (6.60%) Website Marketing Manager
7 4 (3.77%) Developer
7 4 (3.77%) Project Manager
8 2 (1.89%) Full Stack Engineer
8 2 (1.89%) Lead Developer
8 2 (1.89%) Shopify Developer
Libraries, Frameworks & Software Standards
1 46 (43.40%) RabbitMQ
1 46 (43.40%) Spring Boot
2 4 (3.77%) React
3 3 (2.83%) Laravel
3 3 (2.83%) Node.js
3 3 (2.83%) Vue
4 2 (1.89%) Next.js
4 2 (1.89%) Nuxt
4 2 (1.89%) Symfony
4 2 (1.89%) Tailwind CSS
5 1 (0.94%) .NET
5 1 (0.94%) .NET Core
5 1 (0.94%) AngularJS
5 1 (0.94%) Apache Beam
5 1 (0.94%) CSS
5 1 (0.94%) HTML
5 1 (0.94%) Kafka
5 1 (0.94%) RESTful
Miscellaneous
1 47 (44.34%) Enterprise Software
2 46 (43.40%) Public Cloud
3 4 (3.77%) Mobile App
4 2 (1.89%) Greenfield Project
4 2 (1.89%) NHS
4 2 (1.89%) PMI
Operating Systems
1 54 (50.94%) Linux
2 46 (43.40%) Red Hat Enterprise Linux
3 8 (7.55%) VME
Processes & Methodologies
1 87 (82.08%) Agile
2 75 (70.75%) Open Source
3 48 (45.28%) Project Management
3 48 (45.28%) Scrum
4 47 (44.34%) Load Balancing
5 46 (43.40%) Actionable Insight
5 46 (43.40%) ArchiMate
5 46 (43.40%) Cloud Operations
5 46 (43.40%) Collaborative Working
5 46 (43.40%) Data Migration
5 46 (43.40%) Kanban
5 46 (43.40%) Migration
5 46 (43.40%) SDLC
5 46 (43.40%) Systems Engineering
5 46 (43.40%) TOGAF
6 40 (37.74%) Mentoring
7 38 (35.85%) Roadmaps
8 37 (34.91%) Coaching
8 37 (34.91%) Product Roadmap
9 30 (28.30%) Software Engineering
Programming Languages
1 37 (34.91%) COBOL
1 37 (34.91%) Micro Focus COBOL
2 32 (30.19%) Python
3 29 (27.36%) C
3 29 (27.36%) C++
4 5 (4.72%) TypeScript
5 3 (2.83%) JavaScript
5 3 (2.83%) PHP
6 2 (1.89%) Bash
6 2 (1.89%) Java
6 2 (1.89%) PowerShell
7 1 (0.94%) Bicep
7 1 (0.94%) C#
7 1 (0.94%) Scala
7 1 (0.94%) SQL
Qualifications
1 46 (43.40%) AWS Certification
1 46 (43.40%) AWS Certified Solutions Architect
1 46 (43.40%) Azure Certification
1 46 (43.40%) SC Cleared
1 46 (43.40%) Security Cleared
2 2 (1.89%) Degree
2 2 (1.89%) PMI Certification
2 2 (1.89%) PMP
2 2 (1.89%) PRINCE2 Practitioner
Quality Assurance & Compliance
1 2 (1.89%) PMO
2 1 (0.94%) Accessibility
2 1 (0.94%) GMP
System Software
1 2 (1.89%) Docker
Systems Management
1 2 (1.89%) Terraform
2 1 (0.94%) Kubernetes
Vendors
1 46 (43.40%) Oracle
1 46 (43.40%) Sparx
2 37 (34.91%) Micro Focus
3 2 (1.89%) Northgate
4 1 (0.94%) Google
4 1 (0.94%) Microsoft