Cloud Engineer Jobs with Work from Home Options

Cloud Engineer
UK > Work from Home

The median Cloud Engineer salary for remote or hybrid work is £65,000 per year, according to job vacancies posted during the 6 months leading to 26 July 2024.

The table below provides salary benchmarking and summary statistics, comparing them to the same period in the previous two years.

6 months to
26 Jul 2024
Same period 2023 Same period 2022
Rank 257 235 249
Rank change year-on-year -22 +14 -49
Permanent jobs requiring a Cloud Engineer 329 462 1,285
As % of all permanent jobs with a WFH option 1.18% 1.41% 1.64%
As % of the Job Titles category 1.22% 1.47% 1.69%
Number of salaries quoted 247 374 743
10th Percentile £47,300 £42,874 £45,000
25th Percentile £52,500 £52,219 £52,500
Median annual salary (50th Percentile) £65,000 £65,000 £69,447
Median % change year-on-year - -6.40% +6.84%
75th Percentile £75,000 £80,000 £85,000
90th Percentile £88,000 £95,000 £95,000
UK median annual salary £65,000 £68,515 £65,000
% change year-on-year -5.13% +5.41% +4.00%

All Permanent IT Job Vacancies
Work from Home

For comparison with the information above, the following table provides summary statistics for all permanent IT job vacancies with WFH or hybrid options. Most job vacancies include a discernible job title that can be normalized. As such, the figures in the second row provide an indication of the number of permanent jobs in our overall sample.

Permanent vacancies in Work from Home with a recognized job title 26,891 31,453 76,163
% of permanent jobs with a recognized job title 96.26% 95.84% 96.99%
Number of salaries quoted 19,582 23,849 44,441
10th Percentile £34,500 £36,750 £36,250
25th Percentile £42,500 £46,749 £45,750
Median annual salary (50th Percentile) £57,500 £62,500 £60,000
Median % change year-on-year -8.00% +4.17% +9.09%
75th Percentile £75,728 £80,000 £80,000
90th Percentile £95,000 £100,000 £95,000
UK median annual salary £55,000 £60,000 £60,000
% change year-on-year -8.33% - +9.09%

Cloud Engineer
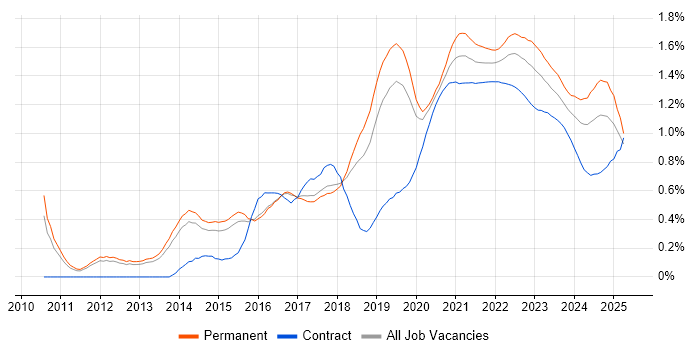
Trend for Jobs with a WFH Option

Job vacancies with a work from home option which featured Cloud Engineer in the job title as a proportion of all IT jobs advertised.

Cloud Engineer trend for jobs with a WFH option

Cloud Engineer
Salary Trend for Jobs with a WFH Option

3-month moving average salary quoted in job vacancies with a work from home option citing Cloud Engineer.

Cloud Engineer salary trend for jobs with a WFH option

Cloud Engineer
Salary Histogram for Jobs with a WFH Option

Salary distribution for jobs with a work from home option citing Cloud Engineer over the 6 months to 26 July 2024.

Cloud Engineer salary histogram for jobs with a WFH option

Cloud Engineer Skill Set
Top 30 Co-occurring Skills and Capabilities in Job Vacancies with WFH Options

For the 6 months to 26 July 2024, Cloud Engineer job roles required the following skills and capabilities in order of popularity. The figures indicate the absolute number co-occurrences and as a proportion of all permanent jobs with remote work options featuring Cloud Engineer in the job title.

1 231 (70.21%) Azure
2 168 (51.06%) Terraform
3 151 (45.90%) AWS
4 136 (41.34%) Infrastructure as Code
5 122 (37.08%) DevOps
6 100 (30.40%) Infrastructure Engineering
7 97 (29.48%) CI/CD
8 88 (26.75%) Python
9 82 (24.92%) PowerShell
10 80 (24.32%) Kubernetes
11 79 (24.01%) Linux
12 76 (23.10%) Finance
13 70 (21.28%) Windows
14 62 (18.84%) Docker
15 56 (17.02%) Microsoft
16 54 (16.41%) Problem-Solving
17 52 (15.81%) Agile
18 50 (15.20%) Microsoft 365
18 50 (15.20%) Ansible
19 47 (14.29%) Social Skills
19 47 (14.29%) Active Directory
20 46 (13.98%) Bash
20 46 (13.98%) Git
21 44 (13.37%) Platform Engineering
22 41 (12.46%) Containerisation
22 41 (12.46%) Azure DevOps
23 37 (11.25%) Entra ID
24 36 (10.94%) SaaS
24 36 (10.94%) Inclusion and Diversity
25 35 (10.64%) Analytics

Cloud Engineer Skill Set
Co-occurring Skills and Capabilities with WFH Options by Category

The follow tables expand on the table above by listing co-occurrences grouped by category. The same employment type, locality and period is covered with up to 20 co-occurrences shown in each of the following categories:

Application Platforms
1 10 (3.04%) Microsoft Exchange
1 10 (3.04%) SharePoint
2 4 (1.22%) Confluence
3 3 (0.91%) CloudStack
4 1 (0.30%) Apache Spark
4 1 (0.30%) IIS
4 1 (0.30%) Moodle
4 1 (0.30%) SharePoint Server
Applications
1 2 (0.61%) Microsoft Office
Business Applications
1 11 (3.34%) Remedy ITSM
Cloud Services
1 231 (70.21%) Azure
2 151 (45.90%) AWS
3 50 (15.20%) Microsoft 365
4 41 (12.46%) Azure DevOps
5 37 (11.25%) Entra ID
6 36 (10.94%) SaaS
7 35 (10.64%) Serverless
8 31 (9.42%) GCP
9 23 (6.99%) AWS Lambda
10 22 (6.69%) Azure Storage
11 21 (6.38%) AWS CloudFormation
11 21 (6.38%) Azure Monitor
12 20 (6.08%) GitHub
13 17 (5.17%) IaaS
14 14 (4.26%) Virtual Private Cloud
15 12 (3.65%) Azure Logic Apps
15 12 (3.65%) PaaS
16 11 (3.34%) Amazon CloudWatch
16 11 (3.34%) Azure AKS
16 11 (3.34%) Azure Event Grid
Communications & Networking
1 29 (8.81%) Firewall
2 13 (3.95%) DNS
3 12 (3.65%) DHCP
3 12 (3.65%) VPN
4 11 (3.34%) TCP/IP
5 7 (2.13%) Network Security
6 6 (1.82%) LAN
6 6 (1.82%) WAN
7 5 (1.52%) Remote Desktop
7 5 (1.52%) VLAN
8 4 (1.22%) WLAN
9 3 (0.91%) BGP
9 3 (0.91%) Internet
9 3 (0.91%) iSCSI
10 2 (0.61%) IPv4
10 2 (0.61%) NetScaler
10 2 (0.61%) OSPF
11 1 (0.30%) IPsec
11 1 (0.30%) Multicast
11 1 (0.30%) SAN
Database & Business Intelligence
1 15 (4.56%) Amazon RDS
2 10 (3.04%) BigQuery
3 9 (2.74%) MySQL
3 9 (2.74%) SQL Server
4 8 (2.43%) DynamoDB
5 6 (1.82%) MongoDB
6 4 (1.22%) Power BI
7 3 (0.91%) MariaDB
7 3 (0.91%) Redis
8 2 (0.61%) Azure SQL Database
8 2 (0.61%) DB2
8 2 (0.61%) Elasticsearch
8 2 (0.61%) PostgreSQL
9 1 (0.30%) Amazon Athena
9 1 (0.30%) Apache Cassandra
9 1 (0.30%) Data Warehouse
9 1 (0.30%) Event Store
9 1 (0.30%) NoSQL
9 1 (0.30%) SQL Server Integration Services
Development Applications
1 46 (13.98%) Git
2 20 (6.08%) Jenkins
3 19 (5.78%) GitLab
4 12 (3.65%) Artifactory
5 4 (1.22%) Bitbucket
5 4 (1.22%) JIRA
5 4 (1.22%) Terragrunt
6 3 (0.91%) Eclipse
6 3 (0.91%) JMeter
6 3 (0.91%) Robot Framework
6 3 (0.91%) SonarQube
7 2 (0.61%) CircleCI
8 1 (0.30%) Burp Suite
8 1 (0.30%) Metasploit
8 1 (0.30%) Spinnaker
8 1 (0.30%) sqlmap
General
1 76 (23.10%) Finance
2 47 (14.29%) Social Skills
3 36 (10.94%) Inclusion and Diversity
4 26 (7.90%) Law
5 21 (6.38%) Analytical Skills
6 20 (6.08%) Public Sector
7 14 (4.26%) Banking
7 14 (4.26%) Retail
8 9 (2.74%) Legal
9 5 (1.52%) Telecoms
10 3 (0.91%) Aerospace
10 3 (0.91%) Automotive
10 3 (0.91%) Back Office
10 3 (0.91%) Financial Institution
11 2 (0.61%) Advertising
11 2 (0.61%) Manufacturing
11 2 (0.61%) Organisational Skills
11 2 (0.61%) Presentation Skills
12 1 (0.30%) Documentation Skills
12 1 (0.30%) Games
Libraries, Frameworks & Software Standards
1 19 (5.78%) ARM Templates
2 12 (3.65%) Kafka
3 11 (3.34%) YAML
4 10 (3.04%) .NET
5 9 (2.74%) RESTful
6 6 (1.82%) AWS CDK
6 6 (1.82%) Django
6 6 (1.82%) GraphQL
7 4 (1.22%) JSON
7 4 (1.22%) Node.js
8 3 (0.91%) Elastic Stack
8 3 (0.91%) REST
9 2 (0.61%) .NET Core
9 2 (0.61%) ASP.NET
9 2 (0.61%) SAML
10 1 (0.30%) JDBC
10 1 (0.30%) LDAP
10 1 (0.30%) PySpark
10 1 (0.30%) Web Services
10 1 (0.30%) web3js
Miscellaneous
1 33 (10.03%) Public Cloud
2 23 (6.99%) Data Centre
3 20 (6.08%) Hybrid Cloud
4 16 (4.86%) Distributed Systems
5 15 (4.56%) Linux Command Line
6 14 (4.26%) Private Cloud
7 12 (3.65%) Cloud Native
8 11 (3.34%) Blog
9 6 (1.82%) IoT
9 6 (1.82%) Product Ownership
10 5 (1.52%) Management Information System
11 4 (1.22%) Cyber Security Posture
12 3 (0.91%) Distributed Denial-of-Service
12 3 (0.91%) Enterprise Cloud
12 3 (0.91%) PropTech
12 3 (0.91%) Tandem
13 2 (0.61%) Data Structures
13 2 (0.61%) Enterprise Software
13 2 (0.61%) Greenfield Project
13 2 (0.61%) Renewable Energy
Operating Systems
1 79 (24.01%) Linux
2 70 (21.28%) Windows
3 19 (5.78%) Windows Server
4 8 (2.43%) Red Hat Enterprise Linux
5 5 (1.52%) Unix
5 5 (1.52%) VMS
6 4 (1.22%) Windows Server 2012
6 4 (1.22%) Windows Server 2016
7 3 (0.91%) SUSE
7 3 (0.91%) SUSE Linux Enterprise Server
8 2 (0.61%) CentOS
8 2 (0.61%) Windows Server 2019
9 1 (0.30%) Ubuntu
9 1 (0.30%) Windows 10
Processes & Methodologies
1 136 (41.34%) Infrastructure as Code
2 122 (37.08%) DevOps
3 100 (30.40%) Infrastructure Engineering
4 97 (29.48%) CI/CD
5 54 (16.41%) Problem-Solving
6 52 (15.81%) Agile
7 44 (13.37%) Platform Engineering
8 41 (12.46%) Containerisation
9 35 (10.64%) Analytics
10 33 (10.03%) Cloud Security
10 33 (10.03%) ITIL
10 33 (10.03%) Service Management
11 29 (8.81%) Migration
11 29 (8.81%) Software Engineering
12 27 (8.21%) Mentoring
13 26 (7.90%) Site Reliability Engineering
14 25 (7.60%) Fintech
15 21 (6.38%) Infrastructure Automation
16 20 (6.08%) Cybersecurity
16 20 (6.08%) Deployment Automation
Programming Languages
1 88 (26.75%) Python
2 82 (24.92%) PowerShell
3 46 (13.98%) Bash
4 31 (9.42%) Bicep
5 18 (5.47%) Go
6 13 (3.95%) SQL
7 11 (3.34%) Kusto Query Language
8 9 (2.74%) C#
9 8 (2.43%) Perl
10 7 (2.13%) Java
10 7 (2.13%) Shell Script
11 4 (1.22%) JavaScript
12 3 (0.91%) AWK
12 3 (0.91%) sed
12 3 (0.91%) TypeScript
13 1 (0.30%) PHP
13 1 (0.30%) Scala
Qualifications
1 31 (9.42%) Security Cleared
2 30 (9.12%) Degree
3 26 (7.90%) Azure Certification
4 21 (6.38%) AWS Certification
5 14 (4.26%) SC Cleared
6 12 (3.65%) AWS Certified Solutions Architect
7 10 (3.04%) Computer Science Degree
8 8 (2.43%) Microsoft Certification
9 7 (2.13%) DBS Check
10 4 (1.22%) AWS Certified DevOps Engineer
10 4 (1.22%) MCSE
11 3 (0.91%) Master's Degree
11 3 (0.91%) PhD
11 3 (0.91%) VMware Certified Professional (VCP)
12 2 (0.61%) AWS Certified Cloud Practitioner
12 2 (0.61%) DV Cleared
12 2 (0.61%) ITIL Certification
12 2 (0.61%) MCSA
12 2 (0.61%) VCP6
13 1 (0.30%) CCNP
Quality Assurance & Compliance
1 15 (4.56%) PCI DSS
2 13 (3.95%) QA
3 8 (2.43%) ISO/IEC 27001
4 7 (2.13%) SOC 2
5 6 (1.82%) GDPR
6 5 (1.52%) HIPAA
7 4 (1.22%) NCSC
8 1 (0.30%) Cyber Essentials
8 1 (0.30%) Data Quality
8 1 (0.30%) NIST
8 1 (0.30%) SLA
System Software
1 62 (18.84%) Docker
2 47 (14.29%) Active Directory
3 33 (10.03%) Virtual Machines
4 17 (5.17%) VMware Infrastructure
5 16 (4.86%) Virtual Desktop
6 12 (3.65%) XenDesktop
7 11 (3.34%) XenApp
8 6 (1.82%) Hyper-V
9 3 (0.91%) Ceph
9 3 (0.91%) Gluster
9 3 (0.91%) KVM
9 3 (0.91%) oVirt
10 1 (0.30%) Virtual Servers
10 1 (0.30%) VMware ESXi
10 1 (0.30%) vSphere
Systems Management
1 168 (51.06%) Terraform
2 80 (24.32%) Kubernetes
3 50 (15.20%) Ansible
4 18 (5.47%) Microsoft Intune
5 15 (4.56%) Prometheus
6 12 (3.65%) Grafana
7 11 (3.34%) Docker Swarm
8 7 (2.13%) Puppet
9 5 (1.52%) Single Sign-On
9 5 (1.52%) ZABBIX
10 3 (0.91%) Active Directory Federation Services
10 3 (0.91%) CASB
10 3 (0.91%) Graylog
10 3 (0.91%) Observium
10 3 (0.91%) Progress Chef
10 3 (0.91%) SCCM
11 2 (0.61%) Istio
11 2 (0.61%) Opsgenie
11 2 (0.61%) Rundeck
11 2 (0.61%) SCOM
Vendors
1 56 (17.02%) Microsoft
2 20 (6.08%) VMware
3 19 (5.78%) Google
4 14 (4.26%) Splunk
5 12 (3.65%) Citrix
6 11 (3.34%) BMC
6 11 (3.34%) Remedy
7 9 (2.74%) Oracle
8 8 (2.43%) Cisco
9 6 (1.82%) New Relic
9 6 (1.82%) ServiceNow
10 5 (1.52%) SolarWinds
11 4 (1.22%) Atlassian
11 4 (1.22%) HP
12 3 (0.91%) Meraki
12 3 (0.91%) Zscaler
13 2 (0.61%) Extreme Networks
13 2 (0.61%) LogicMonitor
13 2 (0.61%) PagerDuty
13 2 (0.61%) Veeam