Value Proposition Jobs with Hybrid/Remote/WFH Options

Value Proposition
UK > Work from Home

The table below provides summary statistics for permanent remote or hybrid work requiring Value Proposition skills. It includes a benchmarking guide to the annual salaries offered in vacancies that cited Value Proposition over the 6 months leading up to 2 May 2025, comparing them to the same period in the previous two years.

6 months to
2 May 2025
Same period 2024 Same period 2023
Rank 372 429 505
Rank change year-on-year +57 +76 +100
Permanent jobs citing Value Proposition 41 162 169
As % of all permanent jobs with a WFH option 0.27% 0.48% 0.40%
As % of the Processes & Methodologies category 0.29% 0.52% 0.41%
Number of salaries quoted 31 113 51
10th Percentile £35,000 £24,606 £44,000
25th Percentile £46,875 £29,750 £46,375
Median annual salary (50th Percentile) £67,138 £40,060 £112,896
Median % change year-on-year +67.60% -64.52% +50.53%
75th Percentile £88,500 £54,000 £138,073
90th Percentile £120,000 £77,500 £150,000
UK median annual salary £30,580 £49,500 £85,000
% change year-on-year -38.22% -41.76% +25.93%

All Process and Methodology Skills
Work from Home

Value Proposition falls under the Processes and Methodologies category. For comparison with the information above, the following table provides summary statistics for all permanent job vacancies with remote or hybrid options requiring process or methodology skills.

Permanent vacancies with a requirement for process or methodology skills 13,938 31,020 41,026
As % of all permanent jobs with a WFH option 93.13% 91.65% 96.09%
Number of salaries quoted 9,733 23,575 28,496
10th Percentile £30,000 £33,800 £37,500
25th Percentile £45,000 £42,500 £47,500
Median annual salary (50th Percentile) £60,000 £57,500 £62,500
Median % change year-on-year +4.35% -8.00% +4.17%
75th Percentile £77,500 £75,000 £82,500
90th Percentile £102,500 £95,000 £100,000
UK median annual salary £57,500 £55,000 £61,500
% change year-on-year +4.55% -10.57% +2.50%

Value Proposition
Trend for Jobs with a WFH Option

Job vacancies with remote working options citing Value Proposition as a proportion of all IT jobs advertised.
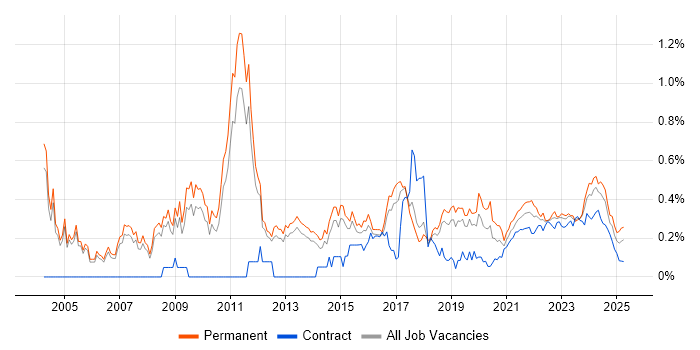
Value Proposition trend for jobs with Hybrid/Remote/WFH options

Value Proposition
Salary Trend for Jobs with a WFH Option

3-month moving average salary quoted in job vacancies with remote working options citing Value Proposition.

Value Proposition salary trend for jobs with a WFH option

Value Proposition
Salary Histogram for Jobs with a WFH Option

Salary distribution for jobs with remote working options citing Value Proposition over the 6 months to 2 May 2025.

Value Proposition salary histogram for jobs with a WFH option

Value Proposition
Co-occurring Skills and Capabilities with WFH Options by Category

The follow tables expand on the table above by listing co-occurrences grouped by category. The same employment type, locality and period is covered with up to 20 co-occurrences shown in each of the following categories:

Application Platforms
1 5 (12.20%) SharePoint
2 1 (2.44%) Confluence
Applications
1 1 (2.44%) Microsoft Office
Business Applications
1 2 (4.88%) Dynamics CRM
Cloud Services
1 9 (21.95%) Azure
2 5 (12.20%) Entra ID
2 5 (12.20%) Microsoft 365
2 5 (12.20%) Microsoft Copilot
2 5 (12.20%) SaaS
3 3 (7.32%) AWS
4 2 (4.88%) IBM Cloud
5 1 (2.44%) Cloud Computing
5 1 (2.44%) Dynamics 365
5 1 (2.44%) GCP
Communications & Networking
1 2 (4.88%) DHCP
1 2 (4.88%) DNS
1 2 (4.88%) LAN
1 2 (4.88%) TCP/IP
1 2 (4.88%) Wireless
2 1 (2.44%) Network Security
2 1 (2.44%) Unified Communications
2 1 (2.44%) WAN
2 1 (2.44%) Wi-Fi
Development Applications
1 1 (2.44%) JIRA
General
1 19 (46.34%) Social Skills
2 16 (39.02%) Marketing
3 15 (36.59%) Finance
4 6 (14.63%) Presentation Skills
5 5 (12.20%) Analytical Skills
5 5 (12.20%) Inclusion and Diversity
5 5 (12.20%) Retail
6 4 (9.76%) Manufacturing
7 2 (4.88%) Advertising
7 2 (4.88%) Automotive
7 2 (4.88%) Organisational Skills
7 2 (4.88%) Pharmaceutical
7 2 (4.88%) Public Sector
8 1 (2.44%) Banking
8 1 (2.44%) Electronics
8 1 (2.44%) Health Technology
8 1 (2.44%) Telecoms
Job Titles
1 8 (19.51%) Lead
2 5 (12.20%) Business Manager
3 3 (7.32%) Architect
3 3 (7.32%) Business Development Manager
3 3 (7.32%) Consultant
3 3 (7.32%) Development Manager
3 3 (7.32%) Principal Consultant
4 2 (4.88%) Account Manager
4 2 (4.88%) CCTV Architect
4 2 (4.88%) Development Specialist
4 2 (4.88%) Marketing Manager
4 2 (4.88%) Product Manager
4 2 (4.88%) Sales Executive
4 2 (4.88%) Security Architect
4 2 (4.88%) Security Solutions Architect
4 2 (4.88%) Solutions Architect
4 2 (4.88%) Technical Account Manager
4 2 (4.88%) Technical Manager
5 1 (2.44%) IT Engineer
5 1 (2.44%) Senior
Miscellaneous
1 5 (12.20%) Microsoft Licensing
2 4 (9.76%) Self-Motivation
3 3 (7.32%) Analytical Mindset
3 3 (7.32%) New Media
3 3 (7.32%) PMI
4 2 (4.88%) CCTV
4 2 (4.88%) Data Centre
4 2 (4.88%) Digital Media
4 2 (4.88%) Onboarding
5 1 (2.44%) Analogue Electronics
5 1 (2.44%) Enterprise Software
5 1 (2.44%) Public Cloud
5 1 (2.44%) Renewable Energy
5 1 (2.44%) Social Media
5 1 (2.44%) Virtual Team
Operating Systems
1 5 (12.20%) Windows
Processes & Methodologies
1 15 (36.59%) Business Development
2 12 (29.27%) Continuous Improvement
3 11 (26.83%) Customer Value Proposition
4 9 (21.95%) Decision-Making
4 9 (21.95%) Line Management
5 8 (19.51%) Roadmaps
6 7 (17.07%) Agile
6 7 (17.07%) Change Management
6 7 (17.07%) Collaborative Working
7 6 (14.63%) Business Case
7 6 (14.63%) Customer Experience
7 6 (14.63%) Customer Service
7 6 (14.63%) Cybersecurity
7 6 (14.63%) Market Research
7 6 (14.63%) Performance Metrics
7 6 (14.63%) Service Delivery
8 5 (12.20%) Project Roadmap
8 5 (12.20%) Strategic Thinking
8 5 (12.20%) Technology Strategy
8 5 (12.20%) Workforce Productivity
Qualifications
1 4 (9.76%) Degree
1 4 (9.76%) SC Cleared
1 4 (9.76%) Security Cleared
2 3 (7.32%) PMI Certification
3 2 (4.88%) DBS Check
4 1 (2.44%) AWS Certified Cloud Practitioner
4 1 (2.44%) Azure Certification
Quality Assurance & Compliance
1 1 (2.44%) COSO
System Software
1 6 (14.63%) Active Directory
2 2 (4.88%) Hyper-V
2 2 (4.88%) VMware Infrastructure
Vendors
1 9 (21.95%) Microsoft
2 5 (12.20%) Google
3 4 (9.76%) SAP
4 3 (7.32%) Adobe
4 3 (7.32%) IBM
4 3 (7.32%) Salesforce
4 3 (7.32%) TikTok
5 2 (4.88%) Cisco
5 2 (4.88%) VMware
6 1 (2.44%) AppNeta
6 1 (2.44%) Broadcom
6 1 (2.44%) Ericsson
6 1 (2.44%) Fortinet
6 1 (2.44%) HubSpot
6 1 (2.44%) Oracle