Performance Metrics Jobs with Work from Home Options

Performance Metrics
UK > Work from Home

The table below provides summary statistics for permanent job vacancies with an option to work from home (WFH) and a requirement for Performance Metrics skills. Included is a benchmarking guide to the salaries offered in vacancies that have cited Performance Metrics over the 6 months to 5 May 2024 with a comparison to the same period in the previous 2 years.

6 months to
5 May 2024
Same period 2023 Same period 2022
Rank 493 563 516
Rank change year-on-year +70 -47 +25
Permanent jobs citing Performance Metrics 92 96 343
As % of all permanent jobs with a WFH option 0.27% 0.23% 0.50%
As % of the Processes & Methodologies category 0.30% 0.24% 0.52%
Number of salaries quoted 78 44 150
10th Percentile £39,079 £46,250 £48,000
25th Percentile £44,438 £46,750 £52,500
Median annual salary (50th Percentile) £58,250 £57,500 £66,250
Median % change year-on-year +1.30% -13.21% +20.45%
75th Percentile £77,688 £70,000 £85,000
90th Percentile £85,375 £76,250 £92,500
UK median annual salary £56,250 £55,000 £65,000
% change year-on-year +2.27% -15.38% +8.33%

All Process and Methodology Skills
Work from Home

Performance Metrics is in the Processes and Methodologies category. The following table is for comparison with the above and provides summary statistics for all permanent job vacancies with a WFH option and a requirement for process or methodology skills.

Permanent vacancies with a requirement for process or methodology skills 30,949 40,734 65,929
As % of all permanent jobs with a WFH option 91.59% 96.10% 96.90%
Number of salaries quoted 23,494 28,287 41,473
10th Percentile £33,750 £37,500 £36,250
25th Percentile £42,500 £47,500 £45,617
Median annual salary (50th Percentile) £57,500 £62,500 £60,000
Median % change year-on-year -8.00% +4.17% +9.09%
75th Percentile £75,000 £82,500 £80,000
90th Percentile £95,000 £100,000 £95,000
UK median annual salary £55,000 £61,500 £60,000
% change year-on-year -10.57% +2.50% +9.09%

Performance Metrics
Trend for Jobs with a WFH Option

Job vacancies with a work from home option citing Performance Metrics as a proportion of all IT jobs advertised.
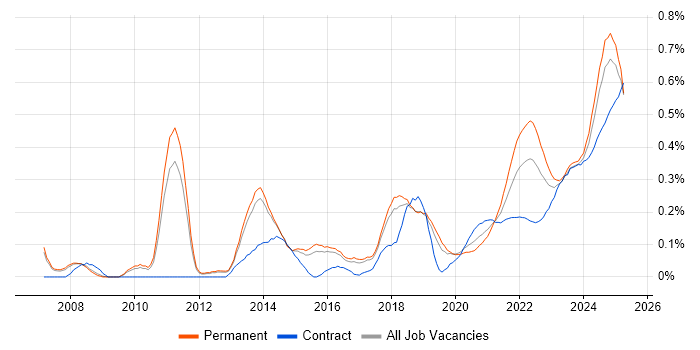
Performance Metrics trend for jobs with a WFH option

Performance Metrics
Salary Trend for Jobs with a WFH Option

3-month moving average salary quoted in job vacancies with a work from home option citing Performance Metrics.

Performance Metrics salary trend for jobs with a WFH option

Performance Metrics
Salary Histogram for Jobs with a WFH Option

Salary distribution for jobs with a work from home option citing Performance Metrics over the 6 months to 5 May 2024.

Performance Metrics salary histogram for jobs with a WFH option

Performance Metrics
Co-occurring Skills and Capabilities with WFH Options by Category

The follow tables expand on the table above by listing co-occurrences grouped by category. The same employment type, locality and period is covered with up to 20 co-occurrences shown in each of the following categories:

Application Platforms
1 5 (5.43%) WebLogic
2 2 (2.17%) Apache Spark
2 2 (2.17%) Confluence
3 1 (1.09%) Apache
3 1 (1.09%) Apache Airflow
3 1 (1.09%) WordPress
Applications
1 6 (6.52%) Microsoft Excel
2 2 (2.17%) Microsoft Project
2 2 (2.17%) MS Visio
3 1 (1.09%) Adobe Creative Suite
3 1 (1.09%) Chatbot
3 1 (1.09%) Microsoft PowerPoint
Business Applications
1 1 (1.09%) Remedy ITSM
Cloud Services
1 18 (19.57%) SaaS
2 13 (14.13%) Azure
3 7 (7.61%) GCP
4 6 (6.52%) AWS
5 5 (5.43%) Entra ID
6 4 (4.35%) Azure DevOps
6 4 (4.35%) Azure Storage
6 4 (4.35%) Dynamics 365
7 3 (3.26%) Microsoft 365
8 2 (2.17%) Google Analytics
8 2 (2.17%) Power Platform
9 1 (1.09%) AWS IoT
9 1 (1.09%) Azure Data Factory
9 1 (1.09%) dbt
9 1 (1.09%) Smartsheet
Communications & Networking
1 6 (6.52%) Firewall
2 5 (5.43%) Network Security
3 2 (2.17%) HTTP
3 2 (2.17%) Internet
3 2 (2.17%) LAN
3 2 (2.17%) SD-WAN
3 2 (2.17%) VPN
3 2 (2.17%) WAN
Database & Business Intelligence
1 5 (5.43%) Oracle Database
2 4 (4.35%) Data Warehouse
3 3 (3.26%) Oracle Reports
3 3 (3.26%) SQL Server
3 3 (3.26%) Tableau
4 2 (2.17%) Elasticsearch
4 2 (2.17%) NoSQL
4 2 (2.17%) Power BI
5 1 (1.09%) Big Data
5 1 (1.09%) Data Lake
5 1 (1.09%) Looker
5 1 (1.09%) Relational Database
Development Applications
1 7 (7.61%) webpack
2 5 (5.43%) JIRA
3 2 (2.17%) Git
4 1 (1.09%) Bitbucket
4 1 (1.09%) Eclipse
4 1 (1.09%) GitLab
4 1 (1.09%) Gradle
4 1 (1.09%) IntelliJ
4 1 (1.09%) JUnit
4 1 (1.09%) Mockito
General
1 40 (43.48%) Social Skills
2 27 (29.35%) Finance
3 25 (27.17%) Analytical Skills
4 14 (15.22%) Marketing
5 9 (9.78%) Manufacturing
6 7 (7.61%) Inclusion and Diversity
6 7 (7.61%) Organisational Skills
6 7 (7.61%) Retail
7 6 (6.52%) Games
7 6 (6.52%) Law
8 4 (4.35%) Advertising
8 4 (4.35%) Legal
9 3 (3.26%) Presentation Skills
9 3 (3.26%) Public Sector
10 1 (1.09%) Banking
10 1 (1.09%) Electronics
10 1 (1.09%) Esports
10 1 (1.09%) Financial Institution
10 1 (1.09%) Influencing Skills
10 1 (1.09%) Publishing
Job Titles
1 17 (18.48%) Senior
2 13 (14.13%) Analyst
3 10 (10.87%) Lead
4 7 (7.61%) Cloud Engineer
4 7 (7.61%) Front-End Engineer (Client-Side Engineer)
4 7 (7.61%) Senior Front-End Engineer (Client-Side Engineer)
5 5 (5.43%) Administrator
5 5 (5.43%) DBA
5 5 (5.43%) Financial Analyst
5 5 (5.43%) Oracle DBA
5 5 (5.43%) Software Engineer
5 5 (5.43%) Technical Administrator
6 4 (4.35%) Business Analyst
6 4 (4.35%) Data Manager
6 4 (4.35%) IT Manager
6 4 (4.35%) Portfolio Manager
6 4 (4.35%) Product Manager
6 4 (4.35%) Senior Software Engineer
6 4 (4.35%) SEO Executive
6 4 (4.35%) Test Leader
Libraries, Frameworks & Software Standards
1 11 (11.96%) CSS
2 9 (9.78%) Node.js
3 7 (7.61%) GraphQL
3 7 (7.61%) HTML
3 7 (7.61%) React
3 7 (7.61%) REST
4 3 (3.26%) Kafka
4 3 (3.26%) Oracle Fusion
5 2 (2.17%) .NET
5 2 (2.17%) Spring
6 1 (1.09%) .NET Core
6 1 (1.09%) Apache Beam
6 1 (1.09%) OpenAPI
6 1 (1.09%) RESTEasy
6 1 (1.09%) Spring Integration
6 1 (1.09%) Web Services
Miscellaneous
1 8 (8.70%) Greenfield Project
2 5 (5.43%) Algorithms
2 5 (5.43%) Management Information System
2 5 (5.43%) Product Ownership
3 4 (4.35%) Driving Licence
3 4 (4.35%) Onboarding
4 3 (3.26%) Analytical Mindset
5 2 (2.17%) Data Structures
5 2 (2.17%) Distributed Systems
5 2 (2.17%) IoT
5 2 (2.17%) Operational Technology
6 1 (1.09%) Cloud Native
6 1 (1.09%) Digital Media
6 1 (1.09%) e-Learning
6 1 (1.09%) EPoS
6 1 (1.09%) iPad
6 1 (1.09%) Mobile App
6 1 (1.09%) Public Cloud
6 1 (1.09%) Video Editing
6 1 (1.09%) Virtual Team
Operating Systems
1 7 (7.61%) Linux
2 2 (2.17%) Windows
2 2 (2.17%) Windows Server
3 1 (1.09%) Android
3 1 (1.09%) Apple iOS
3 1 (1.09%) Mac OS
Processes & Methodologies
1 49 (53.26%) Problem-Solving
2 27 (29.35%) Agile
3 19 (20.65%) Continuous Improvement
3 19 (20.65%) Decision-Making
4 16 (17.39%) ITIL
4 16 (17.39%) User Experience
5 15 (16.30%) Analytics
6 14 (15.22%) Process Improvement
6 14 (15.22%) Software Engineering
7 13 (14.13%) Mentoring
7 13 (14.13%) Project Management
8 12 (13.04%) Computer Science
9 11 (11.96%) Data Analysis
9 11 (11.96%) Front End Development
10 10 (10.87%) Risk Management
11 9 (9.78%) Business Continuity
11 9 (9.78%) Information Security
11 9 (9.78%) Roadmaps
11 9 (9.78%) Service Management
12 8 (8.70%) Architectural Patterns
Programming Languages
1 8 (8.70%) Python
1 8 (8.70%) SQL
2 7 (7.61%) TypeScript
3 4 (4.35%) Java
3 4 (4.35%) MATLAB
3 4 (4.35%) VBA
4 3 (3.26%) Scala
5 1 (1.09%) C#
5 1 (1.09%) Go
5 1 (1.09%) R
5 1 (1.09%) Ruby
Qualifications
1 19 (20.65%) Degree
2 5 (5.43%) OCA
2 5 (5.43%) OCP
2 5 (5.43%) Oracle Certification
2 5 (5.43%) Security Cleared
3 4 (4.35%) BPSS Clearance
4 3 (3.26%) Master's Degree
4 3 (3.26%) MBA
5 2 (2.17%) Cisco Certification
5 2 (2.17%) ITIL Foundation Certificate
5 2 (2.17%) PMI Certification
5 2 (2.17%) PMP
6 1 (1.09%) A+ Certification
6 1 (1.09%) ACCA
6 1 (1.09%) AWS Certification
6 1 (1.09%) AWS Certified Solutions Architect
6 1 (1.09%) CIMA
6 1 (1.09%) Numerate Degree
6 1 (1.09%) SC Cleared
Quality Assurance & Compliance
1 8 (8.70%) QA
1 8 (8.70%) SLA
2 7 (7.61%) Accessibility
2 7 (7.61%) WCAG
3 5 (5.43%) Data Quality
4 3 (3.26%) PMO
5 1 (1.09%) Actionable Recommendations
5 1 (1.09%) GDPR
5 1 (1.09%) GMP
System Software
1 6 (6.52%) Active Directory
2 5 (5.43%) Oracle RAC
3 4 (4.35%) Virtual Desktop
4 2 (2.17%) Docker
Systems Management
1 5 (5.43%) Data Guard
1 5 (5.43%) Oracle RMAN
2 4 (4.35%) Active Directory Federation Services
3 2 (2.17%) Kubernetes
3 2 (2.17%) Terraform
Vendors
1 19 (20.65%) Microsoft
2 17 (18.48%) Google
3 9 (9.78%) Oracle
4 4 (4.35%) Ahrefs
4 4 (4.35%) Apple
4 4 (4.35%) Screaming Frog
5 2 (2.17%) Cisco
5 2 (2.17%) Meraki
5 2 (2.17%) OneTrust
5 2 (2.17%) ServiceNow
5 2 (2.17%) SolarWinds
6 1 (1.09%) Adobe
6 1 (1.09%) Databricks
6 1 (1.09%) HubSpot
6 1 (1.09%) Remedy
6 1 (1.09%) Salesforce
6 1 (1.09%) SAP