Hybrid/Remote Technology Strategy Job Trends

Technology Strategy
UK > Work from Home

The table below provides summary statistics and salary benchmarking for remote or hybrid work requiring Technology Strategy skills. It covers permanent job vacancies from the 6 months leading up to 8 November 2025, with comparisons to the same periods in the previous two years.

6 months to
8 Nov 2025
Same period 2024 Same period 2023
Rank 181 282 223
Rank change year-on-year +101 -59 +45
Permanent jobs citing Technology Strategy 251 195 318
As % of all permanent jobs with remote/hybrid work options 1.57% 0.98% 1.44%
As % of the Processes & Methodologies category 1.70% 1.11% 1.51%
Number of salaries quoted 168 103 198
10th Percentile £24,570 £45,000 £57,500
25th Percentile £47,500 £61,814 £66,769
Median annual salary (50th Percentile) £60,000 £80,000 £82,500
Median % change year-on-year -25.00% -3.03% -6.74%
75th Percentile £82,500 £100,000 £97,416
90th Percentile £108,250 £117,250 £115,000
UK median annual salary £72,000 £82,822 £79,632
% change year-on-year -13.07% +4.01% -9.98%

All Process and Methodology Skills
Work from Home

Technology Strategy falls under the Processes and Methodologies category. For comparison with the information above, the following table provides summary statistics for all permanent job vacancies with remote or hybrid options requiring process or methodology skills.

Permanent vacancies with a requirement for process or methodology skills 14,749 17,546 20,993
As % of all permanent jobs with a WFH option 92.38% 88.33% 95.02%
Number of salaries quoted 8,703 10,436 17,007
10th Percentile £29,300 £36,000 £37,000
25th Percentile £40,000 £46,250 £47,000
Median annual salary (50th Percentile) £57,500 £62,500 £62,500
Median % change year-on-year -8.00% - -
75th Percentile £77,500 £81,250 £80,500
90th Percentile £98,000 £100,000 £97,500
UK median annual salary £54,000 £60,000 £60,000
% change year-on-year -10.00% - -

Technology Strategy
Job Vacancy Trend for Remote/Hybrid Jobs

Historical trend showing the proportion of permanent IT job postings citing Technology Strategy and offering remote or hybrid work options relative to all permanent IT jobs advertised.
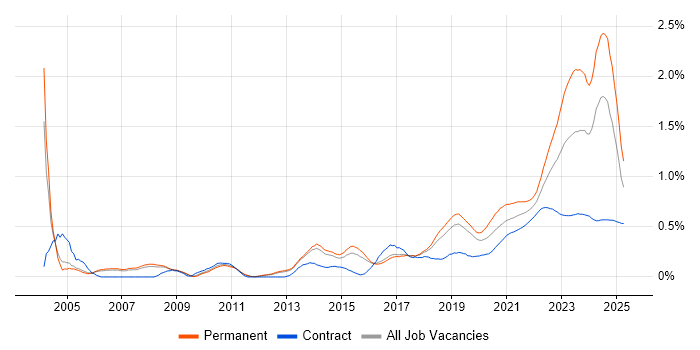
Technology Strategy job vacancy trend for remote/hybrid jobs

Technology Strategy
Salary Trend for Remote/Hybrid Jobs

Salary distribution trend for jobs with remote/hybrid work options citing Technology Strategy.

Salary distribution trend for jobs with remote/hybrid work options citing Technology Strategy

Technology Strategy
Salary Histogram for Remote/Hybrid Jobs

Salary distribution for jobs with remote/hybrid work options citing Technology Strategy over the 6 months to 8 November 2025.

Technology Strategy salary histogram for jobs with remote/hybrid work options

Technology Strategy
Co-Occurring Skills & Capabilities in Remote/Hybrid Jobs by Category

The following tables expand on the one above by listing co-occurrences grouped by category. They cover the same employment type, locality and period, with up to 20 co-occurrences shown in each category:

Application Platforms
1 16 (6.37%) SharePoint
2 3 (1.20%) Confluence
3 1 (0.40%) Microsoft Exchange
Applications
1 9 (3.59%) Adobe XD
2 4 (1.59%) Microsoft Excel
3 2 (0.80%) Civil 3D
3 2 (0.80%) Navisworks
3 2 (0.80%) Revit
4 1 (0.40%) Spreadsheet
Business Applications
1 13 (5.18%) Dynamics CRM
2 10 (3.98%) Dynamics GP
3 5 (1.99%) Adaptiv
4 1 (0.40%) Aladdin
4 1 (0.40%) SAP S/4HANA
4 1 (0.40%) Shopify
Cloud Services
1 51 (20.32%) Azure
2 29 (11.55%) AWS
2 29 (11.55%) Power Platform
3 23 (9.16%) Microsoft 365
4 20 (7.97%) Dynamics 365
5 17 (6.77%) PowerApps
6 15 (5.98%) Power Automate
6 15 (5.98%) SaaS
7 12 (4.78%) GCP
8 11 (4.38%) Figma
9 10 (3.98%) Miro
10 5 (1.99%) Azure Machine Learning
10 5 (1.99%) Salesforce Sales Cloud
10 5 (1.99%) Salesforce Service Cloud
10 5 (1.99%) Serverless
11 3 (1.20%) Azure Data Factory
11 3 (1.20%) Azure Functions
11 3 (1.20%) Azure Logic Apps
11 3 (1.20%) Google Analytics
11 3 (1.20%) Google Tag Manager
Communications & Networking
1 3 (1.20%) Broadband
1 3 (1.20%) Internet
2 2 (0.80%) TETRA
3 1 (0.40%) BGP
3 1 (0.40%) Firewall
3 1 (0.40%) LAN
3 1 (0.40%) MPLS
3 1 (0.40%) OSPF
3 1 (0.40%) SD-WAN
3 1 (0.40%) TCP/IP
3 1 (0.40%) Unified Communications
3 1 (0.40%) VLAN
3 1 (0.40%) VoIP
3 1 (0.40%) WAN
Database & Business Intelligence
1 24 (9.56%) Power BI
2 7 (2.79%) SQL Server
3 4 (1.59%) Metadata
3 4 (1.59%) MySQL
3 4 (1.59%) PostgreSQL
3 4 (1.59%) Relational Database
4 3 (1.20%) Data Warehouse
4 3 (1.20%) SQL Server Integration Services
4 3 (1.20%) SQL Server Reporting Services
5 2 (0.80%) Amazon RDS
5 2 (0.80%) Amazon Redshift
5 2 (0.80%) Big Data
5 2 (0.80%) Data Lake
5 2 (0.80%) GIS
5 2 (0.80%) NoSQL
6 1 (0.40%) Electronic Patient Records
6 1 (0.40%) Metadata Repository
6 1 (0.40%) MongoDB
6 1 (0.40%) Oracle Database
Development Applications
1 9 (3.59%) Axure RP
1 9 (3.59%) Balsamiq
2 8 (3.19%) Cypress.io
2 8 (3.19%) Selenium
2 8 (3.19%) WebDriver
3 6 (2.39%) Git
4 3 (1.20%) JIRA
5 2 (0.80%) ER Studio
6 1 (0.40%) Jenkins
General
1 138 (54.98%) Social Skills
2 71 (28.29%) Marketing
3 69 (27.49%) Inclusion and Diversity
4 66 (26.29%) Finance
5 62 (24.70%) Public Sector
6 58 (23.11%) Law
7 51 (20.32%) Analytical Skills
8 18 (7.17%) Legal
9 11 (4.38%) Influencing Skills
9 11 (4.38%) Retail
10 9 (3.59%) Banking
10 9 (3.59%) Games
11 5 (1.99%) Police
11 5 (1.99%) Presentation Skills
12 4 (1.59%) Local Government
13 3 (1.20%) Automotive
13 3 (1.20%) Back Office
14 1 (0.40%) Financial Institution
14 1 (0.40%) Military
14 1 (0.40%) Telecoms
Job Titles
1 61 (24.30%) Sales Executive
2 56 (22.31%) Corporate Sales Executive
3 39 (15.54%) Architect
4 36 (14.34%) Developer
5 35 (13.94%) Lead
6 21 (8.37%) Senior
7 15 (5.98%) Enterprise Architect
8 13 (5.18%) Power Platform Developer
9 12 (4.78%) Senior Developer
9 12 (4.78%) Technology Director
10 11 (4.38%) Analyst
10 11 (4.38%) Designer
10 11 (4.38%) Software Developer
11 9 (3.59%) Head of IT
11 9 (3.59%) Service Designer
12 8 (3.19%) Data Architect
12 8 (3.19%) Developer in Test
12 8 (3.19%) Technical Architect
13 7 (2.79%) Business Analyst
14 6 (2.39%) Software Engineer
Libraries, Frameworks & Software Standards
1 19 (7.57%) .NET
2 14 (5.58%) HTML5 Canvas
3 13 (5.18%) REST
4 12 (4.78%) React
5 9 (3.59%) .NET Core
6 8 (3.19%) Playwright
7 6 (2.39%) AngularJS
7 6 (2.39%) Entity Framework
7 6 (2.39%) SOAP
8 5 (1.99%) CSS
8 5 (1.99%) HTML
8 5 (1.99%) Lightning Web Components
8 5 (1.99%) Middleware
8 5 (1.99%) RESTful
8 5 (1.99%) Symfony
8 5 (1.99%) Unity (Game Engine)
8 5 (1.99%) Visualforce
8 5 (1.99%) WebGL
9 4 (1.59%) .NET Framework
10 3 (1.20%) Spring
Miscellaneous
1 21 (8.37%) Cloud Native
2 19 (7.57%) Product Ownership
3 14 (5.58%) Enterprise Software
4 13 (5.18%) Foreign Exchange (FX)
5 10 (3.98%) Self-Motivation
6 8 (3.19%) Educational Technology
6 8 (3.19%) Legacy Systems
6 8 (3.19%) Team-Oriented Environment
7 7 (2.79%) Credit Risk
7 7 (2.79%) Management Information System
8 5 (1.99%) Market Risk
8 5 (1.99%) Mobile Games
9 3 (1.20%) Analytical Mindset
9 3 (1.20%) Data Protection Act
9 3 (1.20%) Derivative
9 3 (1.20%) IoT
9 3 (1.20%) Onboarding
9 3 (1.20%) Smart Home
9 3 (1.20%) Social Media
10 2 (0.80%) Distributed Architecture
Operating Systems
1 6 (2.39%) Android
1 6 (2.39%) Apple iOS
2 1 (0.40%) Linux
Processes & Methodologies
1 146 (58.17%) IT Strategy
2 78 (31.08%) AI
3 66 (26.29%) Continuous Improvement
4 63 (25.10%) Customer Experience
5 60 (23.90%) Email Marketing
6 58 (23.11%) Agile
7 57 (22.71%) Roadmaps
8 53 (21.12%) Community of Practice
9 41 (16.33%) Analytics
10 34 (13.55%) Business Strategy
10 34 (13.55%) Software Engineering
10 34 (13.55%) Stakeholder Management
11 32 (12.75%) Business Intelligence
12 31 (12.35%) Technology Roadmap
13 29 (11.55%) Enterprise Architecture
14 28 (11.16%) Computer Science
14 28 (11.16%) Problem-Solving
15 24 (9.56%) Project Management
16 23 (9.16%) Data Modelling
16 23 (9.16%) Decision-Making
Programming Languages
1 34 (13.55%) C#
2 31 (12.35%) Java
3 23 (9.16%) JavaScript
4 12 (4.78%) SQL
5 8 (3.19%) Python
6 5 (1.99%) Apex Code
6 5 (1.99%) Kotlin
6 5 (1.99%) PHP
7 1 (0.40%) Groovy
Qualifications
1 65 (25.90%) Security Cleared
2 62 (24.70%) Degree
3 59 (23.51%) SC Cleared
4 25 (9.96%) Computer Science Degree
5 16 (6.37%) Microsoft Certification
6 9 (3.59%) PMP
7 8 (3.19%) CFA
7 8 (3.19%) ITIL Certification
7 8 (3.19%) PMI Certification
8 4 (1.59%) DBS Check
8 4 (1.59%) Master's Degree
8 4 (1.59%) TOGAF Certification
9 2 (0.80%) RIBA
10 1 (0.40%) APMG
10 1 (0.40%) AWS Certification
10 1 (0.40%) CISSP
10 1 (0.40%) CSPO
10 1 (0.40%) DV Cleared
10 1 (0.40%) ITIL Foundation Certificate
10 1 (0.40%) PCI QSA
Quality Assurance & Compliance
1 22 (8.76%) PMO
2 19 (7.57%) Accessibility
3 15 (5.98%) QA
4 11 (4.38%) WCAG
5 9 (3.59%) GDPR
6 7 (2.79%) ISO/IEC 27001
7 4 (1.59%) Data Quality
8 3 (1.20%) PCI DSS
9 2 (0.80%) Cyber Essentials
9 2 (0.80%) Cyber Essentials PLUS
9 2 (0.80%) ISO 19650
9 2 (0.80%) ISO 9001
9 2 (0.80%) ISO/IEC 20000
10 1 (0.40%) Actionable Recommendations
10 1 (0.40%) GRC
10 1 (0.40%) HL7
10 1 (0.40%) NCSC
10 1 (0.40%) NIST
System Software
1 3 (1.20%) Docker
1 3 (1.20%) Firmware
Systems Management
1 3 (1.20%) Kubernetes
Vendors
1 100 (39.84%) Microsoft
2 58 (23.11%) Cisco
3 57 (22.71%) Dell
4 10 (3.98%) Google
4 10 (3.98%) Sage
5 9 (3.59%) Adobe
6 8 (3.19%) MuleSoft
6 8 (3.19%) Murex
7 7 (2.79%) Salesforce
8 5 (1.99%) FIS
9 4 (1.59%) Oracle
10 3 (1.20%) Databricks
10 3 (1.20%) ESRI
11 2 (0.80%) Autodesk
11 2 (0.80%) SAP
11 2 (0.80%) ServiceNow
12 1 (0.40%) Avaya
12 1 (0.40%) Calypso
12 1 (0.40%) Genesys
12 1 (0.40%) Meraki