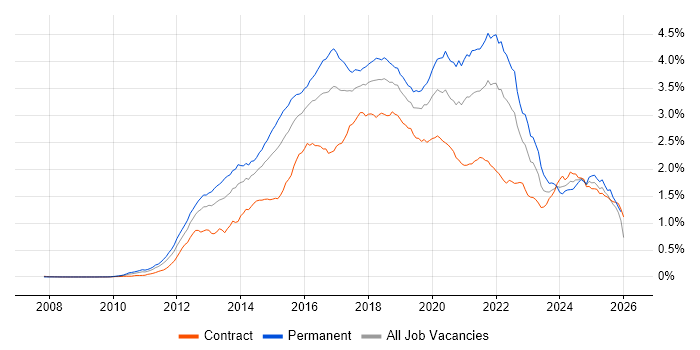
NoSQL Contracts in London

NoSQL
England > London

The table below provides summary statistics for contract job vacancies advertised in London requiring NoSQL skills. It includes a benchmarking guide to the contractor rates offered in vacancies that cited NoSQL over the 6 months leading up to 4 October 2024, comparing them to the same period in the previous two years.

6 months to
4 Oct 2024
Same period 2023 Same period 2022
Rank 146 213 166
Rank change year-on-year +67 -47 -39
Contract jobs citing NoSQL 299 258 664
As % of all contract jobs advertised in London 1.85% 1.21% 1.73%
As % of the Database & Business Intelligence category 8.23% 6.31% 8.19%
Number of daily rates quoted 218 163 459
10th Percentile £359 £431 £463
25th Percentile £500 £525 £550
Median daily rate (50th Percentile) £600 £645 £650
Median % change year-on-year -6.98% -0.77% +4.00%
75th Percentile £700 £763 £756
90th Percentile £800 £800 £825
England median daily rate £600 £623 £600
% change year-on-year -3.61% +3.75% -
Number of hourly rates quoted 0 7 1
10th Percentile - £35.00 -
25th Percentile - £35.32 £69.50
Median hourly rate - £75.00 £72.00
Median % change year-on-year - +4.17% +16.13%
75th Percentile - £90.00 £74.50
90th Percentile - - -
England median hourly rate - £75.00 £66.00
% change year-on-year - +13.64% +1.15%

All Database and Business Intelligence Skills
London

NoSQL falls under the Databases and Business Intelligence category. For comparison with the information above, the following table provides summary statistics for all contract job vacancies requiring database or business intelligence skills in London.

Contract vacancies with a requirement for database or business intelligence skills 3,633 4,091 8,105
As % of all contract IT jobs advertised in London 22.46% 19.18% 21.12%
Number of daily rates quoted 2,595 2,925 5,790
10th Percentile £363 £388 £413
25th Percentile £463 £463 £500
Median daily rate (50th Percentile) £575 £575 £600
Median % change year-on-year - -4.17% +9.09%
75th Percentile £713 £688 £713
90th Percentile £850 £788 £800
England median daily rate £550 £550 £550
% change year-on-year - - +4.76%
Number of hourly rates quoted 22 40 34
10th Percentile £27.81 £19.18 £27.21
25th Percentile £36.25 £35.54 £36.56
Median hourly rate £43.75 £51.50 £55.00
Median % change year-on-year -15.05% -6.36% +69.23%
75th Percentile £53.75 £68.66 £71.38
90th Percentile £78.38 £90.00 £76.06
England median hourly rate £36.25 £54.50 £50.00
% change year-on-year -33.49% +9.00% +50.38%

NoSQL
Job Vacancy Trend in London

Job postings citing NoSQL as a proportion of all IT jobs advertised in London.

Job vacancy trend for NoSQL in London

NoSQL
Contractor Daily Rate Trend in London

3-month moving average daily rate quoted in jobs citing NoSQL in London.

Daily rate trend for NoSQL in London

NoSQL
Daily Rate Histogram in London

Daily rate distribution for jobs citing NoSQL in London over the 6 months to 4 October 2024.

Daily rate histogram for NoSQL in London

NoSQL
Contractor Hourly Rate Trend in London

3-month moving average hourly rates quoted in jobs citing NoSQL in London.

Hourly rate trend for NoSQL in London

NoSQL
Contract Job Locations in London

The table below looks at the demand and provides a guide to the median contractor rates quoted in IT jobs citing NoSQL within the London region over the 6 months to 4 October 2024. The 'Rank Change' column provides an indication of the change in demand within each location based on the same 6 month period last year.

Location Rank Change
on Same Period
Last Year
Matching
Contract
IT Job Ads
Median
Daily Rate
Past 6 Months
Median Daily Rate
% Change
on Same Period
Last Year
Live
Jobs
Central London +36 48 £650 +4.00% 12
West London +11 3 £81 -87.44% 3
South London - 3 £575 - 4
East London +8 1 £540 -12.90% 1
NoSQL
England

NoSQL
Co-occurring Skills and Capabilities in London by Category

The follow tables expand on the table above by listing co-occurrences grouped by category. The same employment type, locality and period is covered with up to 20 co-occurrences shown in each of the following categories:

Application Platforms
1 27 (9.03%) Apache Spark
2 17 (5.69%) Apache
2 17 (5.69%) Confluence
3 15 (5.02%) SharePoint
4 10 (3.34%) Apache Airflow
5 6 (2.01%) Jupyter
6 2 (0.67%) Tomcat
7 1 (0.33%) Anypoint
7 1 (0.33%) Cloud Foundry
7 1 (0.33%) Luigi
7 1 (0.33%) OpenStack
7 1 (0.33%) SAS
7 1 (0.33%) ThingWorx
Applications
1 1 (0.33%) Microsoft Excel
1 1 (0.33%) Microsoft Office
1 1 (0.33%) Microsoft PowerPoint
1 1 (0.33%) Microsoft Project
1 1 (0.33%) MS Visio
1 1 (0.33%) Trello
Business Applications
1 1 (0.33%) SAP BPC
1 1 (0.33%) SAP Oil and Gas
1 1 (0.33%) SAP S/4HANA
Cloud Services
1 181 (60.54%) Azure
2 94 (31.44%) AWS
3 43 (14.38%) Serverless
4 39 (13.04%) GCP
4 39 (13.04%) GitHub
5 29 (9.70%) Power Platform
6 21 (7.02%) Azure Service Bus
6 21 (7.02%) Azure Synapse Analytics
7 20 (6.69%) Azure DevOps
8 19 (6.35%) Azure App Service
8 19 (6.35%) Azure Cosmos DB
8 19 (6.35%) Azure Event Grid
8 19 (6.35%) Azure Functions
9 16 (5.35%) Azure Data Factory
9 16 (5.35%) Azure Logic Apps
9 16 (5.35%) Microsoft 365
10 15 (5.02%) Power Automate
10 15 (5.02%) PowerApps
11 14 (4.68%) Amazon S3
11 14 (4.68%) Azure AKS
Communications & Networking
1 3 (1.00%) Internet
2 2 (0.67%) HTTP
2 2 (0.67%) TCP/IP
3 1 (0.33%) DHCP
3 1 (0.33%) DNS
3 1 (0.33%) Intrusion Detection
Database & Business Intelligence
1 63 (21.07%) MongoDB
2 58 (19.40%) SQL Server
3 55 (18.39%) PostgreSQL
4 53 (17.73%) Azure SQL Database
5 48 (16.05%) Data Warehouse
6 32 (10.70%) Relational Database
7 29 (9.70%) Power BI
8 24 (8.03%) Elasticsearch
9 19 (6.35%) DynamoDB
10 18 (6.02%) Apache Cassandra
11 17 (5.69%) Data Lake
12 16 (5.35%) Big Data
13 14 (4.68%) Amazon Redshift
13 14 (4.68%) Couchbase
13 14 (4.68%) Tableau
14 12 (4.01%) Hadoop
14 12 (4.01%) MySQL
15 11 (3.68%) BusinessObjects
15 11 (3.68%) Redis
15 11 (3.68%) Snowflake Schema
Development Applications
1 43 (14.38%) Git
2 37 (12.37%) Jenkins
3 25 (8.36%) GitLab
4 23 (7.69%) JIRA
5 8 (2.68%) Cucumber
6 7 (2.34%) TeamCity
7 5 (1.67%) Maven
8 4 (1.34%) Atlassian Bamboo
8 4 (1.34%) Deequ
8 4 (1.34%) Gradle
8 4 (1.34%) webpack
9 3 (1.00%) Ant
9 3 (1.00%) Artifactory
9 3 (1.00%) Babel
9 3 (1.00%) JUnit
9 3 (1.00%) Mockito
9 3 (1.00%) Selenium
9 3 (1.00%) Sonatype Nexus
10 2 (0.67%) Gatling
10 2 (0.67%) Jasmine
General
1 78 (26.09%) Social Skills
2 77 (25.75%) Finance
3 65 (21.74%) Banking
4 38 (12.71%) Analytical Skills
5 19 (6.35%) Public Sector
6 15 (5.02%) Front Office
7 13 (4.35%) Investment Banking
8 12 (4.01%) Retail
9 5 (1.67%) Back Office
10 4 (1.34%) Manufacturing
10 4 (1.34%) Marketing
10 4 (1.34%) Presentation Skills
10 4 (1.34%) Telecoms
11 3 (1.00%) Documentation Skills
11 3 (1.00%) Electronics
11 3 (1.00%) Financial Institution
12 2 (0.67%) Corporate Banking
13 1 (0.33%) Billing
13 1 (0.33%) Military
13 1 (0.33%) Retail Banking
Job Titles
1 122 (40.80%) Developer
2 44 (14.72%) Senior
3 41 (13.71%) Architect
4 35 (11.71%) Data Engineer
5 29 (9.70%) Azure Engineer
6 26 (8.70%) Full-Stack Developer
6 26 (8.70%) Java Developer
7 25 (8.36%) Data Architect
8 20 (6.69%) C# Developer
8 20 (6.69%) Senior Developer
9 17 (5.69%) Lead
9 17 (5.69%) React Developer
10 16 (5.35%) Analyst
11 13 (4.35%) .NET Developer
12 12 (4.01%) Applications Developer
12 12 (4.01%) Power Apps Developer
13 11 (3.68%) Azure Data Engineer
13 11 (3.68%) Azure Developer
14 10 (3.34%) Angular Developer
14 10 (3.34%) C# .NET Developer
Libraries, Frameworks & Software Standards
1 83 (27.76%) Kafka
2 65 (21.74%) .NET
3 46 (15.38%) RESTful
4 40 (13.38%) .NET Core
4 40 (13.38%) HTML
4 40 (13.38%) Spring Boot
5 39 (13.04%) Spring
6 38 (12.71%) React
7 33 (11.04%) CSS
8 29 (9.70%) Node.js
9 18 (6.02%) GraphQL
9 18 (6.02%) HTML5
9 18 (6.02%) REST
10 16 (5.35%) AngularJS
11 15 (5.02%) PySpark
12 14 (4.68%) CSS3
13 12 (4.01%) TensorFlow
13 12 (4.01%) Web Services
14 11 (3.68%) gRPC
14 11 (3.68%) scikit-learn
Miscellaneous
1 17 (5.69%) Cloud Native
2 16 (5.35%) Greenfield Project
3 13 (4.35%) Product Ownership
4 11 (3.68%) Analytical Mindset
4 11 (3.68%) Data Structures
4 11 (3.68%) Enterprise Software
5 10 (3.34%) Algorithms
6 8 (2.68%) Distributed Systems
6 8 (2.68%) Replication
7 7 (2.34%) iPad
7 7 (2.34%) SWIFT Messaging Network
8 6 (2.01%) Foreign Exchange (FX)
9 5 (1.67%) Reference Data
9 5 (1.67%) Self-Motivation
10 4 (1.34%) Data Protection Act
10 4 (1.34%) Derivative
11 3 (1.00%) IBM Mainframe
11 3 (1.00%) Mainframe
11 3 (1.00%) Public Cloud
12 2 (0.67%) Hybrid Cloud
Operating Systems
1 23 (7.69%) Linux
2 16 (5.35%) Unix
3 3 (1.00%) Red Hat Enterprise Linux
4 2 (0.67%) Windows
5 1 (0.33%) Apple iOS
5 1 (0.33%) VMS
5 1 (0.33%) Windows Server
Processes & Methodologies
1 124 (41.47%) Agile
2 96 (32.11%) Microservices
3 82 (27.42%) CI/CD
4 76 (25.42%) Data Modelling
5 64 (21.40%) DevOps
6 53 (17.73%) Design Patterns
7 46 (15.38%) Full-Stack Development
7 46 (15.38%) Problem-Solving
8 44 (14.72%) Analytics
9 42 (14.05%) Software Engineering
10 41 (13.71%) Containerisation
11 39 (13.04%) ETL
12 38 (12.71%) Data Architecture
13 37 (12.37%) Architectural Design
14 36 (12.04%) Event-Driven
15 35 (11.71%) Business Intelligence
15 35 (11.71%) Computer Science
15 35 (11.71%) Event-Driven Architecture
15 35 (11.71%) Migration
15 35 (11.71%) Scrum
Programming Languages
1 190 (63.55%) SQL
2 86 (28.76%) Python
3 85 (28.43%) Java
4 65 (21.74%) C#
5 60 (20.07%) JavaScript
6 26 (8.70%) Scala
7 22 (7.36%) TypeScript
8 12 (4.01%) Go
9 9 (3.01%) PowerShell
9 9 (3.01%) Shell Script
10 7 (2.34%) T-SQL
11 3 (1.00%) Bash
11 3 (1.00%) C++
11 3 (1.00%) R
11 3 (1.00%) Ruby
12 2 (0.67%) Bicep
12 2 (0.67%) Kotlin
12 2 (0.67%) PL/SQL
13 1 (0.33%) Gremlin
13 1 (0.33%) PHP
Qualifications
1 40 (13.38%) Degree
2 26 (8.70%) Security Cleared
3 23 (7.69%) SC Cleared
4 18 (6.02%) Computer Science Degree
5 13 (4.35%) Master's Degree
6 4 (1.34%) SnowPro
7 3 (1.00%) Azure Certification
7 3 (1.00%) DV Cleared
8 2 (0.67%) AWS Certification
8 2 (0.67%) OCP
8 2 (0.67%) Oracle Certification
9 1 (0.33%) CBAP
9 1 (0.33%) ISEB
9 1 (0.33%) ISTQB
9 1 (0.33%) ISTQB Foundation Certification
Quality Assurance & Compliance
1 30 (10.03%) Data Quality
2 7 (2.34%) PCI DSS
3 6 (2.01%) ISO 20022
4 5 (1.67%) QA
5 3 (1.00%) Accessibility
5 3 (1.00%) Basel III
6 2 (0.67%) WCAG
7 1 (0.33%) GDPR
7 1 (0.33%) Government Security Classifications
7 1 (0.33%) HIPAA
7 1 (0.33%) HMG Security Policy Framework
7 1 (0.33%) NCSC
System Software
1 55 (18.39%) Docker
2 9 (3.01%) VMware Infrastructure
3 3 (1.00%) Active Directory
4 1 (0.33%) Apache Flume
4 1 (0.33%) Ceph
4 1 (0.33%) HDFS
4 1 (0.33%) Hyper-V
4 1 (0.33%) Virtual Machines
Systems Management
1 96 (32.11%) Kubernetes
2 33 (11.04%) Terraform
3 17 (5.69%) Grafana
4 9 (3.01%) Prometheus
5 6 (2.01%) Kibana
6 5 (1.67%) Ansible
7 4 (1.34%) logstash
8 2 (0.67%) Podman
9 1 (0.33%) Ganglia
9 1 (0.33%) Oozie
9 1 (0.33%) Progress Chef
9 1 (0.33%) Single Sign-On
Vendors
1 56 (18.73%) Microsoft
2 41 (13.71%) Oracle
3 32 (10.70%) Google
4 25 (8.36%) SAP
5 21 (7.02%) Databricks
6 10 (3.34%) Splunk
7 9 (3.01%) VMware
8 6 (2.01%) CyberSource
8 6 (2.01%) IBM
9 5 (1.67%) Informatica
10 3 (1.00%) Atlassian
10 3 (1.00%) TIBCO
11 2 (0.67%) PagerDuty
11 2 (0.67%) Red Hat
11 2 (0.67%) Salesforce
11 2 (0.67%) Sybase
11 2 (0.67%) WSO2
12 1 (0.33%) AppDynamics
12 1 (0.33%) Cloudera
12 1 (0.33%) New Relic