Containerisation Contracts in London

Containerization
England > London

The table below provides summary statistics for contract job vacancies advertised in London requiring Containerisation skills. It includes a benchmarking guide to the contractor rates offered in vacancies that cited Containerisation over the 6 months leading up to 1 May 2025, comparing them to the same period in the previous two years.

6 months to
1 May 2025
Same period 2024 Same period 2023
Rank 82 148 123
Rank change year-on-year +66 -25 +25
Contract jobs citing Containerisation 411 292 554
As % of all contract jobs advertised in London 3.28% 1.64% 2.05%
As % of the Processes & Methodologies category 3.55% 1.85% 2.25%
Number of daily rates quoted 284 201 424
10th Percentile £413 £425 £463
25th Percentile £485 £500 £531
Median daily rate (50th Percentile) £575 £600 £650
Median % change year-on-year -4.17% -7.69% +4.00%
75th Percentile £650 £700 £769
90th Percentile £704 £788 £811
England median daily rate £550 £575 £625
% change year-on-year -4.35% -8.00% +4.17%
Number of hourly rates quoted 0 0 1
10th Percentile - - -
25th Percentile - - £87.50
Median hourly rate - - £95.00
75th Percentile - - £102.50
90th Percentile - - -
England median hourly rate £26.50 £58.75 £71.00
% change year-on-year -54.89% -17.25% +37.88%

All Process and Methodology Skills
London

Containerisation falls under the Processes and Methodologies category. For comparison with the information above, the following table provides summary statistics for all contract job vacancies requiring process or methodology skills in London.

Contract vacancies with a requirement for process or methodology skills 11,564 15,790 24,631
As % of all contract IT jobs advertised in London 92.16% 88.55% 91.11%
Number of daily rates quoted 7,847 11,316 17,711
10th Percentile £350 £338 £375
25th Percentile £440 £450 £475
Median daily rate (50th Percentile) £550 £550 £590
Median % change year-on-year - -6.78% +2.61%
75th Percentile £688 £675 £700
90th Percentile £813 £800 £800
England median daily rate £525 £525 £550
% change year-on-year - -4.55% +2.33%
Number of hourly rates quoted 166 324 278
10th Percentile £16.17 £16.00 £18.59
25th Percentile £22.68 £20.00 £22.53
Median hourly rate £31.67 £29.50 £38.13
Median % change year-on-year +7.36% -22.62% +5.90%
75th Percentile £50.75 £47.56 £62.64
90th Percentile £63.75 £65.93 £76.78
England median hourly rate £29.07 £36.00 £37.50
% change year-on-year -19.25% -4.00% +53.06%

Containerisation
Job Vacancy Trend in London

Job postings citing Containerisation as a proportion of all IT jobs advertised in London.
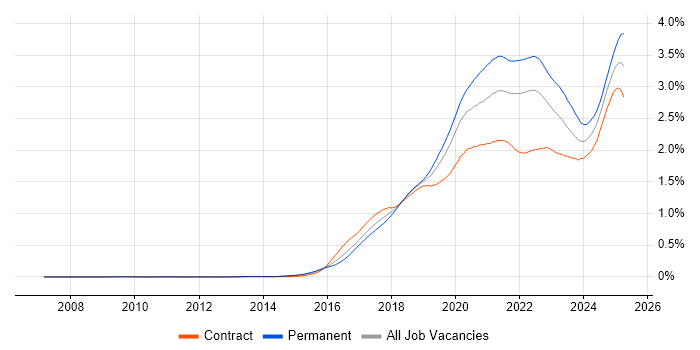
Job vacancy trend for Containerisation in London

Containerisation
Contractor Daily Rate Trend in London

3-month moving average daily rate quoted in jobs citing Containerisation in London.

Daily rate trend for Containerisation in London

Containerisation
Daily Rate Histogram in London

Daily rate distribution for jobs citing Containerisation in London over the 6 months to 1 May 2025.

Daily rate histogram for Containerisation in London

Containerisation
Contractor Hourly Rate Trend in London

3-month moving average hourly rates quoted in jobs citing Containerisation in London.

Hourly rate trend for Containerisation in London

Containerisation
Contract Job Locations in London

The table below looks at the demand and provides a guide to the median contractor rates quoted in IT jobs citing Containerisation within the London region over the 6 months to 1 May 2025. The 'Rank Change' column provides an indication of the change in demand within each location based on the same 6 month period last year.

Location Rank Change
on Same Period
Last Year
Matching
Contract
IT Job Ads
Median
Daily Rate
Past 6 Months
Median Daily Rate
% Change
on Same Period
Last Year
Live
Jobs
Central London +35 58 £575 -13.86% 67
South London +21 20 £538 +4.88% 2
East London +18 4 £585 -22.00% 10
West London +10 3 £409 +408.07% 21
Containerisation
England

Containerisation
Co-occurring Skills and Capabilities in London by Category

The follow tables expand on the table above by listing co-occurrences grouped by category. The same employment type, locality and period is covered with up to 20 co-occurrences shown in each of the following categories:

Application Platforms
1 15 (3.65%) Apache Spark
2 13 (3.16%) Apache
3 12 (2.92%) Confluence
4 5 (1.22%) Apache Airflow
5 4 (0.97%) Microsoft Exchange
5 4 (0.97%) nginx
5 4 (0.97%) OpenStack
5 4 (0.97%) SharePoint
6 3 (0.73%) Jupyter
7 2 (0.49%) Camunda
7 2 (0.49%) Umbraco
8 1 (0.24%) CMS
8 1 (0.24%) DataSynapse
8 1 (0.24%) IIS
Applications
1 1 (0.24%) InVision
1 1 (0.24%) Microsoft Excel
1 1 (0.24%) Microsoft PowerPoint
1 1 (0.24%) Sketch
Business Applications
1 3 (0.73%) Shopify
2 2 (0.49%) Actimize
2 2 (0.49%) SAP BPC
3 1 (0.24%) Cloudability
3 1 (0.24%) Fidessa
3 1 (0.24%) Oracle EBS
Cloud Services
1 230 (55.96%) AWS
2 147 (35.77%) Azure
3 79 (19.22%) GCP
4 61 (14.84%) Serverless
5 58 (14.11%) AWS CloudFormation
6 46 (11.19%) Amazon EKS
7 44 (10.71%) Amazon S3
8 39 (9.49%) Azure DevOps
9 38 (9.25%) AWS Lambda
10 34 (8.27%) GitHub
11 28 (6.81%) PaaS
12 26 (6.33%) IaaS
13 24 (5.84%) Snowflake
14 23 (5.60%) Amazon EC2
15 19 (4.62%) OpenShift
16 18 (4.38%) Azure AKS
17 16 (3.89%) GitHub Actions
18 13 (3.16%) Virtual Private Cloud
19 12 (2.92%) Amazon CloudWatch
19 12 (2.92%) Azure Monitor
Communications & Networking
1 21 (5.11%) DNS
2 15 (3.65%) HTTP
3 14 (3.41%) Firewall
4 13 (3.16%) TCP/IP
4 13 (3.16%) VPN
5 9 (2.19%) DHCP
6 7 (1.70%) Internet
7 3 (0.73%) Kerberos
7 3 (0.73%) Network Security
7 3 (0.73%) SD-WAN
7 3 (0.73%) Software-Defined Networking
7 3 (0.73%) VLAN
7 3 (0.73%) WAN
8 2 (0.49%) BGP
8 2 (0.49%) Cisco IOS
8 2 (0.49%) DSL
8 2 (0.49%) Ethernet VPN
8 2 (0.49%) MPLS
8 2 (0.49%) SSH
9 1 (0.24%) IP Telephony
Database & Business Intelligence
1 63 (15.33%) PostgreSQL
2 50 (12.17%) Amazon RDS
3 32 (7.79%) Data Warehouse
4 26 (6.33%) MongoDB
5 25 (6.08%) Relational Database
6 24 (5.84%) MySQL
6 24 (5.84%) NoSQL
7 21 (5.11%) Amazon Redshift
8 18 (4.38%) Elasticsearch
9 15 (3.65%) Redis
10 13 (3.16%) Amazon Aurora
10 13 (3.16%) Data Lake
11 11 (2.68%) Apache Cassandra
11 11 (2.68%) SQL Server
12 9 (2.19%) Big Data
12 9 (2.19%) BigQuery
13 8 (1.95%) Geospatial Data
14 7 (1.70%) DynamoDB
14 7 (1.70%) Hadoop
15 6 (1.46%) OLTP
Development Applications
1 90 (21.90%) Jenkins
2 71 (17.27%) GitLab
3 52 (12.65%) Git
4 25 (6.08%) JUnit
5 23 (5.60%) JIRA
6 14 (3.41%) Gradle
6 14 (3.41%) Mockito
7 11 (2.68%) Liquibase
8 10 (2.43%) Cucumber
9 9 (2.19%) Jasmine
10 8 (1.95%) JMeter
10 8 (1.95%) Maven
10 8 (1.95%) SonarQube
11 7 (1.70%) Bitbucket
12 6 (1.46%) CircleCI
13 5 (1.22%) LoadRunner
13 5 (1.22%) MLflow
14 4 (0.97%) Artifactory
14 4 (0.97%) Selenium
14 4 (0.97%) Serenity BDD
General
1 109 (26.52%) Social Skills
2 88 (21.41%) Finance
3 66 (16.06%) Public Sector
4 37 (9.00%) Analytical Skills
5 20 (4.87%) Banking
5 20 (4.87%) Telecoms
6 16 (3.89%) Marketing
7 13 (3.16%) Presentation Skills
8 12 (2.92%) Electronics
8 12 (2.92%) Manufacturing
9 8 (1.95%) Publishing
10 7 (1.70%) Financial Institution
11 6 (1.46%) Front Office
11 6 (1.46%) Investment Banking
12 4 (0.97%) Billing
12 4 (0.97%) Documentation Skills
12 4 (0.97%) Retail
13 3 (0.73%) Military
13 3 (0.73%) Multimedia
14 2 (0.49%) Organisational Skills
Job Titles
1 91 (22.14%) Developer
2 69 (16.79%) DevOps Engineer
3 64 (15.57%) Architect
4 58 (14.11%) Senior
5 44 (10.71%) Lead
6 32 (7.79%) AWS Engineer
7 29 (7.06%) Java Developer
8 27 (6.57%) AWS Architect
8 27 (6.57%) Software Engineer
9 22 (5.35%) Data Engineer
10 18 (4.38%) Cloud Engineer
11 17 (4.14%) Consultant
11 17 (4.14%) Senior Developer
12 16 (3.89%) Senior DevOps
13 15 (3.65%) Cloud Architect
13 15 (3.65%) Senior DevOps Engineer
14 14 (3.41%) .NET Developer
14 14 (3.41%) AWS DevOps
14 14 (3.41%) Full-Stack Developer
15 12 (2.92%) AWS DevOps Engineer
Libraries, Frameworks & Software Standards
1 54 (13.14%) Kafka
2 50 (12.17%) Spring
3 41 (9.98%) Spring Boot
4 34 (8.27%) React
5 33 (8.03%) .NET
6 32 (7.79%) RESTful
7 30 (7.30%) Elastic Stack
8 27 (6.57%) OpenAPI
8 27 (6.57%) Swagger
9 24 (5.84%) Node.js
10 17 (4.14%) REST
11 13 (3.16%) FastAPI
12 12 (2.92%) .NET Framework
12 12 (2.92%) Spring Security
13 11 (2.68%) HTML
14 10 (2.43%) JSON
14 10 (2.43%) Spring Batch
15 9 (2.19%) ARM Templates
15 9 (2.19%) Entity Framework
16 8 (1.95%) GraphQL
Miscellaneous
1 36 (8.76%) Cloud Native
2 20 (4.87%) Distributed Systems
3 14 (3.41%) Onboarding
4 13 (3.16%) Public Cloud
5 11 (2.68%) Hybrid Cloud
6 10 (2.43%) Data Centre
6 10 (2.43%) Product Ownership
7 9 (2.19%) Distributed Denial-of-Service
8 6 (1.46%) Hedge funds
9 5 (1.22%) Enterprise Software
9 5 (1.22%) Legacy Systems
9 5 (1.22%) Private Cloud
9 5 (1.22%) Replication
10 4 (0.97%) Legacy Applications
10 4 (0.97%) Management Information System
10 4 (0.97%) PKI
10 4 (0.97%) Virtual Team
11 3 (0.73%) Equities
11 3 (0.73%) Fixed Income
11 3 (0.73%) Grid Computing
Operating Systems
1 74 (18.00%) Linux
2 26 (6.33%) Red Hat Enterprise Linux
3 16 (3.89%) Windows
4 14 (3.41%) Unix
5 6 (1.46%) Rocky
6 5 (1.22%) CentOS
6 5 (1.22%) Windows Server
7 4 (0.97%) VMS
8 3 (0.73%) SUSE
8 3 (0.73%) Ubuntu
8 3 (0.73%) Windows Server 2019
9 2 (0.49%) Apple iOS
10 1 (0.24%) AIX
10 1 (0.24%) Android
10 1 (0.24%) Oracle Linux
10 1 (0.24%) Windows 10
Processes & Methodologies
1 227 (55.23%) CI/CD
2 203 (49.39%) DevOps
3 151 (36.74%) Infrastructure as Code
4 114 (27.74%) Problem-Solving
5 107 (26.03%) Microservices
6 103 (25.06%) Agile
7 64 (15.57%) Software Engineering
8 55 (13.38%) High Availability
9 54 (13.14%) Configuration Management
10 52 (12.65%) Test Automation
11 45 (10.95%) Event-Driven
12 44 (10.71%) Continuous Integration
13 42 (10.22%) Full-Stack Development
14 40 (9.73%) Migration
15 36 (8.76%) Cloud Security
16 35 (8.52%) Analytics
17 33 (8.03%) Event-Driven Architecture
17 33 (8.03%) Infrastructure Automation
17 33 (8.03%) Open Source
18 32 (7.79%) TDD
Programming Languages
1 183 (44.53%) Python
2 89 (21.65%) Java
3 82 (19.95%) SQL
4 68 (16.55%) Bash
5 47 (11.44%) JavaScript
6 40 (9.73%) C#
7 36 (8.76%) TypeScript
8 28 (6.81%) PowerShell
9 16 (3.89%) Go
10 15 (3.65%) Shell Script
11 13 (3.16%) Scala
12 11 (2.68%) Bicep
13 10 (2.43%) C++
13 10 (2.43%) PL/SQL
14 9 (2.19%) Ruby
15 8 (1.95%) RPG
15 8 (1.95%) RPG IV
16 5 (1.22%) Perl
17 4 (0.97%) Kusto Query Language
18 3 (0.73%) Kotlin
Qualifications
1 125 (30.41%) Security Cleared
2 119 (28.95%) SC Cleared
3 39 (9.49%) AWS Certification
4 30 (7.30%) AWS Certified Solutions Architect
5 21 (5.11%) Degree
6 11 (2.68%) DV Cleared
7 9 (2.19%) AWS Certified DevOps Engineer
7 9 (2.19%) Azure Certification
8 8 (1.95%) Computer Science Degree
9 5 (1.22%) RHCSA
10 4 (0.97%) AWS Certified SysOps Administrator
10 4 (0.97%) Master's Degree
11 3 (0.73%) Cisco Certification
11 3 (0.73%) VCAP
12 2 (0.49%) AWS Certified Developer
12 2 (0.49%) CCIE
12 2 (0.49%) CCNA
12 2 (0.49%) CCNP
12 2 (0.49%) RHCE
12 2 (0.49%) SANS
Quality Assurance & Compliance
1 19 (4.62%) QA
2 12 (2.92%) GDPR
3 9 (2.19%) Accessibility
4 6 (1.46%) Data Quality
4 6 (1.46%) ISO/IEC 27001
5 5 (1.22%) PCI DSS
6 4 (0.97%) HIPAA
6 4 (0.97%) NIST
7 3 (0.73%) SOC 2
8 1 (0.24%) California Consumer Privacy Act
8 1 (0.24%) EMIR
8 1 (0.24%) FedRAMP
8 1 (0.24%) MiFID
8 1 (0.24%) NCSC
8 1 (0.24%) Sarbanes-Oxley
8 1 (0.24%) SLA
System Software
1 252 (61.31%) Docker
2 13 (3.16%) VMware Infrastructure
3 12 (2.92%) Active Directory
4 3 (0.73%) Microsoft App-V
4 3 (0.73%) Platform Symphony
4 3 (0.73%) VMware NSX
5 2 (0.49%) Apache ZooKeeper
5 2 (0.49%) Lustre
6 1 (0.24%) Ceph
6 1 (0.24%) HDFS
6 1 (0.24%) Oracle RAC
6 1 (0.24%) Veritas Cluster Server
6 1 (0.24%) Virtual Machines
Systems Management
1 268 (65.21%) Kubernetes
2 154 (37.47%) Terraform
3 93 (22.63%) Ansible
4 45 (10.95%) Grafana
5 44 (10.71%) Prometheus
6 32 (7.79%) Puppet
7 22 (5.35%) Progress Chef
8 7 (1.70%) Podman
9 6 (1.46%) Kibana
10 5 (1.22%) Argo
10 5 (1.22%) Istio
10 5 (1.22%) Microsoft Intune
10 5 (1.22%) Perfmon
10 5 (1.22%) Single Sign-On
11 4 (0.97%) Kubeflow
12 3 (0.73%) Consul
12 3 (0.73%) ITRS Geneos
12 3 (0.73%) Packer
12 3 (0.73%) PowerCLI
12 3 (0.73%) vRealize
Vendors
1 40 (9.73%) Google
2 29 (7.06%) Microsoft
3 22 (5.35%) Red Hat
4 19 (4.62%) SAP
5 17 (4.14%) VMware
6 14 (3.41%) Databricks
7 12 (2.92%) Oracle
8 7 (1.70%) Dynatrace
8 7 (1.70%) New Relic
8 7 (1.70%) ServiceNow
8 7 (1.70%) TIBCO
9 6 (1.46%) Cisco
9 6 (1.46%) IBM
10 5 (1.22%) Splunk
11 4 (0.97%) Adobe
11 4 (0.97%) Informatica
11 4 (0.97%) Salesforce
11 4 (0.97%) Solace
12 3 (0.73%) Sitecore
13 2 (0.49%) SolarWinds