Private Cloud Jobs in England

Private Cloud
UK > England

The table below looks at the prevalence of the term Private Cloud in permanent job vacancies in England. Included is a benchmarking guide to the salaries offered in vacancies that cited Private Cloud over the 6 months leading up to 21 April 2025, comparing them to the same period in the previous two years.

6 months to
21 Apr 2025
Same period 2024 Same period 2023
Rank 524 508 454
Rank change year-on-year -16 -54 +170
Permanent jobs citing Private Cloud 130 330 626
As % of all permanent jobs advertised in England 0.29% 0.39% 0.66%
As % of the Miscellaneous category 0.81% 1.13% 1.49%
Number of salaries quoted 92 281 310
10th Percentile £52,000 £35,920 £42,500
25th Percentile £52,500 £47,500 £56,219
Median annual salary (50th Percentile) £65,000 £65,000 £68,515
Median % change year-on-year - -5.13% -1.29%
75th Percentile £80,000 £82,548 £84,056
90th Percentile £97,876 £95,000 £97,290
UK median annual salary £68,750 £65,000 £68,515
% change year-on-year +5.77% -5.13% +1.50%

All Generic Skills
England

Private Cloud falls under the General and Transferable Skills category. For comparison with the information above, the following table provides summary statistics for all permanent job vacancies requiring generic IT skills in England.

Permanent vacancies with a requirement for generic IT skills 15,957 29,313 41,928
As % of all permanent jobs advertised in England 35.03% 34.88% 44.30%
Number of salaries quoted 8,716 20,688 22,030
10th Percentile £31,750 £28,000 £35,483
25th Percentile £43,750 £38,000 £46,570
Median annual salary (50th Percentile) £60,000 £55,000 £65,000
Median % change year-on-year +9.09% -15.38% +4.00%
75th Percentile £81,250 £76,000 £87,500
90th Percentile £112,500 £98,474 £110,000
UK median annual salary £60,000 £55,000 £65,000
% change year-on-year +9.09% -15.38% +4.00%

Private Cloud
Job Vacancy Trend in England

Job postings citing Private Cloud as a proportion of all IT jobs advertised in England.
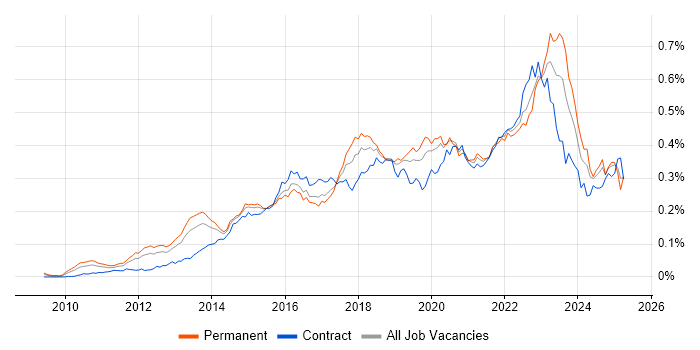
Job vacancy trend for Private Cloud in England

Private Cloud
Salary Trend in England

3-month moving average salary quoted in jobs citing Private Cloud in England.

Salary trend for Private Cloud in England

Private Cloud
Salary Histogram in England

Salary distribution for jobs citing Private Cloud in England over the 6 months to 21 April 2025.

Salary histogram for Private Cloud in England

Private Cloud
Job Locations in England

The table below looks at the demand and provides a guide to the median salaries quoted in IT jobs citing Private Cloud within the England region over the 6 months to 21 April 2025. The 'Rank Change' column provides an indication of the change in demand within each location based on the same 6 month period last year.

Location Rank Change
on Same Period
Last Year
Matching
Permanent
IT Job Ads
Median Salary
Past 6 Months
Median Salary
% Change
on Same Period
Last Year
Live
Jobs
North of England +25 35 £75,000 +36.36% 24
London +43 28 £80,000 +10.34% 84
South East +81 23 £60,000 -20.00% 15
Yorkshire +66 23 £87,319 +51.86% 4
Midlands +46 18 £55,000 -12.00% 10
West Midlands +19 16 £55,000 -8.33% 6
South West +76 15 £62,500 -3.85% 28
East of England - 13 £70,000 -
North West -13 11 £68,750 +14.58% 17
East Midlands +60 2 £57,000 -24.00% 3
North East +39 1 £85,000 +61.90% 3
Private Cloud
UK

Private Cloud
Co-occurring Skills and Capabilities in England by Category

The follow tables expand on the table above by listing co-occurrences grouped by category. The same employment type, locality and period is covered with up to 20 co-occurrences shown in each of the following categories:

Application Platforms
1 19 (14.62%) Microsoft Exchange
2 17 (13.08%) IIS
3 4 (3.08%) OpenStack
4 1 (0.77%) CICS
4 1 (0.77%) SharePoint
Applications
1 16 (12.31%) Microsoft Office
2 8 (6.15%) Microsoft Excel
2 8 (6.15%) MS Visio
Business Applications
1 6 (4.62%) Dynamics CRM
2 1 (0.77%) Cloudability
2 1 (0.77%) SAP CO
2 1 (0.77%) SAP FI
2 1 (0.77%) SAP FI/CO
2 1 (0.77%) SAP S/4HANA
Cloud Services
1 82 (63.08%) Azure
2 56 (43.08%) AWS
3 45 (34.62%) SaaS
4 32 (24.62%) Microsoft 365
5 16 (12.31%) IaaS
6 15 (11.54%) PaaS
7 13 (10.00%) Entra ID
8 9 (6.92%) GCP
9 7 (5.38%) Power Platform
10 6 (4.62%) Dynamics 365
10 6 (4.62%) GitHub
10 6 (4.62%) Serverless
11 2 (1.54%) Amazon EC2
11 2 (1.54%) Amazon S3
11 2 (1.54%) AWS Lambda
11 2 (1.54%) Azure AKS
11 2 (1.54%) Azure Cosmos DB
11 2 (1.54%) Azure ExpressRoute
11 2 (1.54%) Cloud Computing
11 2 (1.54%) OCI
Communications & Networking
1 13 (10.00%) Firewall
2 12 (9.23%) DNS
3 11 (8.46%) SAN
4 10 (7.69%) DHCP
4 10 (7.69%) Intrusion Detection
4 10 (7.69%) Structured Cabling
5 8 (6.15%) Cisco IOS
5 8 (6.15%) FTP
5 8 (6.15%) IPv4
5 8 (6.15%) PBX
5 8 (6.15%) SMTP
5 8 (6.15%) VLAN
6 6 (4.62%) NetScaler
7 4 (3.08%) WAN
8 3 (2.31%) LAN
9 2 (1.54%) Ethernet
9 2 (1.54%) Internet
9 2 (1.54%) MPLS
9 2 (1.54%) VPN
9 2 (1.54%) Wireless
Database & Business Intelligence
1 24 (18.46%) SQL Server
2 10 (7.69%) Amazon RDS
3 9 (6.92%) Data Hub
3 9 (6.92%) SQL CLR
4 7 (5.38%) Power BI
5 6 (4.62%) Metadata
5 6 (4.62%) SQL Server Analysis Services
5 6 (4.62%) SQL Server Reporting Services
6 3 (2.31%) MySQL
6 3 (2.31%) NoSQL
6 3 (2.31%) PostgreSQL
7 2 (1.54%) Azure SQL Database
7 2 (1.54%) DynamoDB
7 2 (1.54%) MariaDB
7 2 (1.54%) MongoDB
7 2 (1.54%) Redis
8 1 (0.77%) Amazon QuickSight
8 1 (0.77%) DB2
8 1 (0.77%) Relational Database
8 1 (0.77%) Tableau
Development Applications
1 7 (5.38%) GitLab
2 3 (2.31%) JIRA
3 2 (1.54%) Jenkins
3 2 (1.54%) Octopus Deploy
4 1 (0.77%) Git
4 1 (0.77%) IBM UrbanCode
4 1 (0.77%) Selenium
General
1 57 (43.85%) Social Skills
2 50 (38.46%) Finance
3 15 (11.54%) Banking
4 9 (6.92%) Back Office
5 6 (4.62%) Public Sector
6 5 (3.85%) Analytical Skills
7 4 (3.08%) Organisational Skills
8 3 (2.31%) Inclusion and Diversity
8 3 (2.31%) Influencing Skills
8 3 (2.31%) Marketing
8 3 (2.31%) Presentation Skills
9 1 (0.77%) Billing
9 1 (0.77%) Investment Banking
Job Titles
1 32 (24.62%) Lead
2 30 (23.08%) Senior
3 15 (11.54%) Service Manager
3 15 (11.54%) Software Engineer
4 12 (9.23%) Full-Stack Engineer
5 11 (8.46%) Consultant
5 11 (8.46%) Full-Stack Software Engineer
6 9 (6.92%) Developer
7 8 (6.15%) Infrastructure Consultant
7 8 (6.15%) Senior Consultant
7 8 (6.15%) Senior Infrastructure Consultant
7 8 (6.15%) Service Desk Manager
7 8 (6.15%) Technical Engineer
8 7 (5.38%) Applications Manager
8 7 (5.38%) DevOps Engineer
8 7 (5.38%) Senior Developer
9 6 (4.62%) Cloud Engineer
9 6 (4.62%) Microsoft Developer
9 6 (4.62%) SaaS Developer
9 6 (4.62%) SQL Developer
Libraries, Frameworks & Software Standards
1 18 (13.85%) .NET
2 17 (13.08%) React
3 4 (3.08%) .NET Core
3 4 (3.08%) Spring Boot
4 3 (2.31%) .NET Framework
4 3 (2.31%) AngularJS
4 3 (2.31%) Dapper ORM
4 3 (2.31%) Entity Framework
4 3 (2.31%) Kafka
4 3 (2.31%) OAuth
5 2 (1.54%) Elastic Stack
5 2 (1.54%) Middleware
5 2 (1.54%) REST
5 2 (1.54%) RESTful
5 2 (1.54%) SAML
5 2 (1.54%) Spring
5 2 (1.54%) Vue
6 1 (0.77%) ARM Templates
6 1 (0.77%) Keycloak
6 1 (0.77%) Web Services
Miscellaneous
1 26 (20.00%) Public Cloud
2 24 (18.46%) Management Information System
3 14 (10.77%) Client/Server
4 11 (8.46%) Data Centre
5 9 (6.92%) Product Ownership
6 6 (4.62%) Cloud Native
6 6 (4.62%) Tandem
7 5 (3.85%) Hybrid Cloud
8 4 (3.08%) PKI
9 3 (2.31%) Enterprise Software
9 3 (2.31%) Team-Oriented Environment
10 2 (1.54%) Driving Licence
11 1 (0.77%) Algorithms
11 1 (0.77%) CMDB
11 1 (0.77%) Data Protection Act
11 1 (0.77%) e-Learning
11 1 (0.77%) EMC VMAX
11 1 (0.77%) Mainframe
11 1 (0.77%) Onboarding
11 1 (0.77%) Operational Technology
Operating Systems
1 28 (21.54%) Windows
2 17 (13.08%) Windows Server
3 8 (6.15%) Android
3 8 (6.15%) Linux
3 8 (6.15%) Windows 10
4 1 (0.77%) Debian
4 1 (0.77%) Windows Server 2012
4 1 (0.77%) Windows Server 2016
4 1 (0.77%) Windows Server 2019
4 1 (0.77%) zOS
Processes & Methodologies
1 42 (32.31%) Problem-Solving
2 37 (28.46%) ITIL
3 34 (26.15%) Software Engineering
4 33 (25.38%) Agile
5 32 (24.62%) DevOps
6 31 (23.85%) CI/CD
7 29 (22.31%) Roadmaps
8 24 (18.46%) Information Security
9 23 (17.69%) Continuous Improvement
10 22 (16.92%) Service Management
11 20 (15.38%) Change Management
11 20 (15.38%) Continuous Integration
11 20 (15.38%) Full-Stack Development
12 18 (13.85%) Commercial Awareness
12 18 (13.85%) Containerisation
12 18 (13.85%) Mentoring
13 16 (12.31%) Customer-Centricity
14 15 (11.54%) Configuration Management
14 15 (11.54%) Infrastructure Engineering
14 15 (11.54%) Security Management
Programming Languages
1 32 (24.62%) Python
2 28 (21.54%) Java
3 23 (17.69%) PowerShell
4 15 (11.54%) JavaScript
4 15 (11.54%) SQL
5 14 (10.77%) C#
6 12 (9.23%) Bash
7 6 (4.62%) T-SQL
8 4 (3.08%) TypeScript
9 1 (0.77%) Bicep
9 1 (0.77%) JCL
Qualifications
1 25 (19.23%) Security Cleared
2 20 (15.38%) SC Cleared
3 14 (10.77%) ITIL Certification
4 10 (7.69%) Cisco Certification
4 10 (7.69%) Microsoft Certification
5 9 (6.92%) CCNA
5 9 (6.92%) Degree
6 8 (6.15%) Network+ Certification
7 5 (3.85%) DV Cleared
8 3 (2.31%) Azure Certification
9 2 (1.54%) AWS Certification
10 1 (0.77%) (ISC)2 CCSP
10 1 (0.77%) AWS Certified Solutions Architect
10 1 (0.77%) CCSP
10 1 (0.77%) CEH
10 1 (0.77%) CISM
10 1 (0.77%) CISSP
10 1 (0.77%) MCSE
10 1 (0.77%) OSCP
10 1 (0.77%) VMware Certified Professional (VCP)
Quality Assurance & Compliance
1 14 (10.77%) SLA
2 11 (8.46%) COBIT
3 10 (7.69%) ISO/IEC 27001
4 1 (0.77%) NIST
4 1 (0.77%) PCI DSS
System Software
1 24 (18.46%) Docker
2 22 (16.92%) VMware Infrastructure
3 14 (10.77%) Virtual Desktop
4 13 (10.00%) Active Directory
5 12 (9.23%) Hyper-V
6 8 (6.15%) VMware ESXi
Systems Management
1 23 (17.69%) Kubernetes
2 9 (6.92%) SCCM
3 8 (6.15%) Microsoft Intune
3 8 (6.15%) Terraform
3 8 (6.15%) WSUS
4 6 (4.62%) Failover Clustering
5 4 (3.08%) Ansible
6 2 (1.54%) Active Directory Federation Services
6 2 (1.54%) Podman
6 2 (1.54%) Proxmox
7 1 (0.77%) CA Service Virtualization
7 1 (0.77%) Grafana
7 1 (0.77%) Progress Chef
7 1 (0.77%) Prometheus
7 1 (0.77%) Puppet
7 1 (0.77%) vRealize
7 1 (0.77%) VxRail
Vendors
1 61 (46.92%) Microsoft
2 24 (18.46%) VMware
3 17 (13.08%) Oracle
4 16 (12.31%) Citrix
5 14 (10.77%) Cisco
6 8 (6.15%) Veeam
7 7 (5.38%) Google
8 3 (2.31%) IBM
8 3 (2.31%) SAP
9 2 (1.54%) Graphcore
9 2 (1.54%) HP
10 1 (0.77%) Arista
10 1 (0.77%) Brocade
10 1 (0.77%) Databricks
10 1 (0.77%) Dell
10 1 (0.77%) EMC
10 1 (0.77%) Juniper
10 1 (0.77%) LogicMonitor
10 1 (0.77%) SolarWinds
10 1 (0.77%) Thales