Unit Testing Jobs in London

Unit Testing
England > London

The table below provides summary statistics for permanent job vacancies advertised in London requiring Unit Testing skills. It includes a benchmarking guide to the annual salaries offered in vacancies that cited Unit Testing over the 6 months leading up to 26 July 2024, comparing them to the same period in the previous two years.

6 months to
26 Jul 2024
Same period 2023 Same period 2022
Rank 251 195 119
Rank change year-on-year -56 -76 +4
Permanent jobs citing Unit Testing 252 483 2,627
As % of all permanent jobs advertised in London 1.22% 1.78% 3.50%
As % of the Processes & Methodologies category 1.36% 1.88% 3.61%
Number of salaries quoted 134 378 762
10th Percentile £38,750 £52,500 £50,000
25th Percentile £60,000 £57,500 £58,750
Median annual salary (50th Percentile) £72,500 £77,500 £78,750
Median % change year-on-year -6.45% -1.59% +12.50%
75th Percentile £88,438 £95,000 £97,290
90th Percentile £111,750 £107,500 £110,000
England median annual salary £60,000 £60,000 £65,000
% change year-on-year - -7.69% +13.04%

All Process and Methodology Skills
London

Unit Testing falls under the Processes and Methodologies category. For comparison with the information above, the following table provides summary statistics for all permanent job vacancies requiring process or methodology skills in London.

Permanent vacancies with a requirement for process or methodology skills 18,545 25,706 72,795
As % of all permanent jobs advertised in London 89.42% 94.78% 97.04%
Number of salaries quoted 12,808 20,124 35,328
10th Percentile £39,500 £42,500 £42,500
25th Percentile £52,500 £55,000 £53,750
Median annual salary (50th Percentile) £72,500 £74,000 £70,000
Median % change year-on-year -2.03% +5.71% -
75th Percentile £95,000 £95,000 £91,732
90th Percentile £120,000 £116,250 £110,000
England median annual salary £55,000 £62,000 £60,000
% change year-on-year -11.29% +3.33% +4.35%

Unit Testing
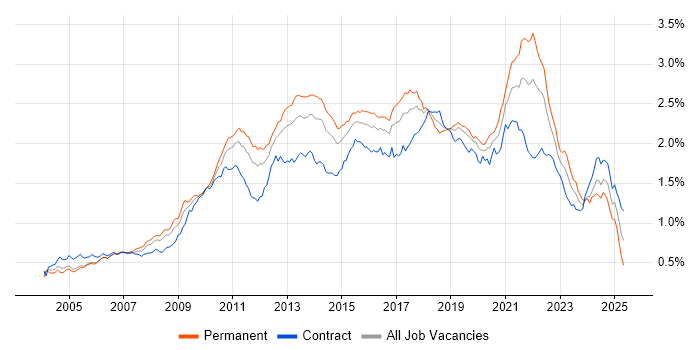
Job Vacancy Trend in London

Job postings citing Unit Testing as a proportion of all IT jobs advertised in London.

Job vacancy trend for Unit Testing in London

Unit Testing
Salary Trend in London

3-month moving average salary quoted in jobs citing Unit Testing in London.

Salary trend for Unit Testing in London

Unit Testing
Salary Histogram in London

Salary distribution for jobs citing Unit Testing in London over the 6 months to 26 July 2024.

Salary histogram for Unit Testing in London

Unit Testing
Job Locations in London

The table below looks at the demand and provides a guide to the median salaries quoted in IT jobs citing Unit Testing within the London region over the 6 months to 26 July 2024. The 'Rank Change' column provides an indication of the change in demand within each location based on the same 6 month period last year.

Location Rank Change
on Same Period
Last Year
Matching
Permanent
IT Job Ads
Median Salary
Past 6 Months
Median Salary
% Change
on Same Period
Last Year
Live
Jobs
Central London +19 65 £85,000 - 7
South London -28 4 £72,500 -19.44%
West London -26 2 £33,750 -37.45% 1
Unit Testing
England

Unit Testing
Co-occurring Skills and Capabilities in London by Category

The follow tables expand on the table above by listing co-occurrences grouped by category. The same employment type, locality and period is covered with up to 20 co-occurrences shown in each of the following categories:

Application Platforms
1 33 (13.10%) CMS
2 5 (1.98%) Confluence
3 4 (1.59%) Apache Spark
3 4 (1.59%) Cloud Foundry
3 4 (1.59%) IIS
4 2 (0.79%) nginx
4 2 (0.79%) Tomcat
5 1 (0.40%) Camunda
5 1 (0.40%) DataSynapse
Applications
1 17 (6.75%) Photoshop
2 6 (2.38%) Spreadsheet
3 1 (0.40%) Microsoft Office
Business Applications
1 33 (13.10%) SDL Web 8
2 4 (1.59%) Dynamics CRM
3 1 (0.40%) Endur
3 1 (0.40%) SAP S/4HANA
Cloud Services
1 70 (27.78%) Azure
2 62 (24.60%) AWS
3 29 (11.51%) Azure DevOps
3 29 (11.51%) Serverless
4 17 (6.75%) Adobe Creative Cloud
4 17 (6.75%) NuGet
5 15 (5.95%) Power Platform
6 14 (5.56%) PowerApps
7 13 (5.16%) Dynamics 365
8 11 (4.37%) AWS Lambda
8 11 (4.37%) SaaS
9 10 (3.97%) Azure Logic Apps
10 9 (3.57%) Amazon SQS
10 9 (3.57%) Azure Functions
10 9 (3.57%) Azure Service Bus
10 9 (3.57%) Power Automate
11 7 (2.78%) GCP
12 6 (2.38%) Amazon Cognito
12 6 (2.38%) Amazon EC2
12 6 (2.38%) Amazon EKS
Communications & Networking
1 6 (2.38%) HTTP
Database & Business Intelligence
1 71 (28.17%) SQL Server
2 25 (9.92%) PostgreSQL
3 19 (7.54%) NoSQL
4 15 (5.95%) SQL Server Integration Services
5 11 (4.37%) SQL Server Reporting Services
6 10 (3.97%) DynamoDB
7 8 (3.17%) Amazon RDS
8 7 (2.78%) MongoDB
9 6 (2.38%) Amazon Aurora
9 6 (2.38%) Elasticsearch
9 6 (2.38%) Relational Database
10 5 (1.98%) Power BI
10 5 (1.98%) Redis
11 4 (1.59%) BigQuery
11 4 (1.59%) Data Warehouse
11 4 (1.59%) RDBMS
12 3 (1.19%) MySQL
12 3 (1.19%) Oracle BI Publisher
12 3 (1.19%) Oracle Reports
12 3 (1.19%) SQL Server Analysis Services
Development Applications
1 100 (39.68%) Git
2 41 (16.27%) Moq
3 40 (15.87%) JIRA
4 38 (15.08%) NUnit
5 34 (13.49%) TeamCity
6 26 (10.32%) JUnit
7 23 (9.13%) Visual Studio
8 22 (8.73%) GitLab
9 20 (7.94%) Jenkins
9 20 (7.94%) JMeter
9 20 (7.94%) Octopus Deploy
10 17 (6.75%) git-flow
10 17 (6.75%) Sourcetree
10 17 (6.75%) SpecFlow
11 10 (3.97%) MSTest
11 10 (3.97%) Postman
12 6 (2.38%) Cypress.io
12 6 (2.38%) Maven
13 5 (1.98%) Mockito
13 5 (1.98%) Team Foundation Server
General
1 75 (29.76%) Social Skills
2 67 (26.59%) Finance
3 46 (18.25%) Marketing
4 21 (8.33%) Analytical Skills
5 12 (4.76%) Front Office
5 12 (4.76%) Public Sector
6 11 (4.37%) Retail
7 8 (3.17%) Documentation Skills
7 8 (3.17%) Legal
8 5 (1.98%) Banking
8 5 (1.98%) Manufacturing
8 5 (1.98%) Multimedia
8 5 (1.98%) Publishing
9 3 (1.19%) Advertising
9 3 (1.19%) Games
9 3 (1.19%) Investment Banking
10 2 (0.79%) Inclusion and Diversity
11 1 (0.40%) Agriculture
11 1 (0.40%) Health Technology
11 1 (0.40%) iGaming
Job Titles
1 145 (57.54%) Developer
2 67 (26.59%) Senior
3 52 (20.63%) Lead
4 50 (19.84%) Senior Developer
5 44 (17.46%) C# Developer
6 40 (15.87%) Full Stack Developer
7 34 (13.49%) Software Engineer
8 30 (11.90%) .NET Developer
9 27 (10.71%) Senior C# Developer
10 19 (7.54%) Lead Developer
11 18 (7.14%) Angular Developer
11 18 (7.14%) Senior Full Stack Developer
12 17 (6.75%) Full-Stack C# Developer
13 14 (5.56%) C# .NET Developer
14 12 (4.76%) Senior .NET Developer
14 12 (4.76%) Senior Software Engineer
14 12 (4.76%) SQL Developer
15 11 (4.37%) Architect
16 10 (3.97%) Junior
16 10 (3.97%) Junior Developer
Libraries, Frameworks & Software Standards
1 105 (41.67%) .NET
2 63 (25.00%) CSS
3 61 (24.21%) RESTful
4 57 (22.62%) ASP.NET
5 56 (22.22%) HTML
6 54 (21.43%) Web Services
7 49 (19.44%) AngularJS
7 49 (19.44%) React
8 46 (18.25%) .NET Framework
8 46 (18.25%) ASP.NET MVC
9 44 (17.46%) Entity Framework
10 41 (16.27%) jQuery
11 37 (14.68%) SOAP
12 33 (13.10%) ASP.NET MVC 5
12 33 (13.10%) Semantic HTML
13 32 (12.70%) XML
14 26 (10.32%) REST
15 19 (7.54%) .NET Core
16 17 (6.75%) Autofac
16 17 (6.75%) Code First Entity Framework
Miscellaneous
1 33 (13.10%) Legacy Code
2 28 (11.11%) Greenfield Project
3 19 (7.54%) Distributed Systems
4 14 (5.56%) Data Structures
4 14 (5.56%) Foreign Exchange (FX)
5 12 (4.76%) Product Ownership
6 9 (3.57%) Algorithms
7 8 (3.17%) Hedge funds
8 7 (2.78%) Self-Motivation
9 6 (2.38%) Distributed Computing
10 5 (1.98%) Fixed Income
10 5 (1.98%) Mobile App
11 4 (1.59%) Cloud Native
11 4 (1.59%) Equities
11 4 (1.59%) Reinsurance
12 3 (1.19%) Client/Server
13 2 (0.79%) Derivative
13 2 (0.79%) Enterprise Software
13 2 (0.79%) Life Science
13 2 (0.79%) Mobile Games
Operating Systems
1 16 (6.35%) Linux
2 11 (4.37%) Unix
3 5 (1.98%) Windows
4 3 (1.19%) Android
4 3 (1.19%) Apple iOS
Processes & Methodologies
1 144 (57.14%) Agile
2 89 (35.32%) Computer Science
3 88 (34.92%) DevOps
4 83 (32.94%) TDD
5 82 (32.54%) Problem-Solving
6 69 (27.38%) OO
7 67 (26.59%) Test Automation
8 62 (24.60%) Full Stack Development
9 57 (22.62%) Software Engineering
10 54 (21.43%) MVC
11 53 (21.03%) Microservices
12 48 (19.05%) CI/CD
13 46 (18.25%) Scrum
14 44 (17.46%) E-Commerce
15 40 (15.87%) Mentoring
15 40 (15.87%) SOLID
16 39 (15.48%) OOP
17 35 (13.89%) Performance Tuning
18 33 (13.10%) Issue Tracking
18 33 (13.10%) Responsive Web Design
Programming Languages
1 130 (51.59%) C#
2 99 (39.29%) JavaScript
3 98 (38.89%) SQL
4 72 (28.57%) Java
5 37 (14.68%) Python
6 34 (13.49%) T-SQL
7 21 (8.33%) TypeScript
8 17 (6.75%) XPath
9 14 (5.56%) PHP
10 11 (4.37%) C++
11 10 (3.97%) PL/SQL
12 8 (3.17%) Rust
13 6 (2.38%) Scala
14 5 (1.98%) C
14 5 (1.98%) Go
15 3 (1.19%) Data Analysis Expressions
16 2 (0.79%) Kotlin
16 2 (0.79%) Ruby
16 2 (0.79%) XQuery
17 1 (0.40%) VB.NET
Qualifications
1 88 (34.92%) Degree
2 43 (17.06%) Computer Science Degree
3 13 (5.16%) Security Cleared
4 8 (3.17%) DV Cleared
4 8 (3.17%) Master's Degree
4 8 (3.17%) Microsoft Certification
4 8 (3.17%) SC Cleared
5 3 (1.19%) BPSS Clearance
5 3 (1.19%) DBS Check
6 2 (0.79%) Azure Certification
7 1 (0.40%) AWS Certification
7 1 (0.40%) AWS Certified Solutions Architect
7 1 (0.40%) Numerate Degree
7 1 (0.40%) TOGAF Certification
Quality Assurance & Compliance
1 32 (12.70%) QA
2 8 (3.17%) MiFID
3 4 (1.59%) Accessibility
4 1 (0.40%) Data Quality
4 1 (0.40%) ISO/IEC 27001
4 1 (0.40%) NCSC
System Software
1 35 (13.89%) Docker
2 5 (1.98%) Firmware
3 3 (1.19%) Active Directory
4 1 (0.40%) Slurm Workload Manager
Systems Management
1 24 (9.52%) Kubernetes
2 16 (6.35%) Terraform
3 6 (2.38%) Ansible
4 5 (1.98%) Packer
5 3 (1.19%) Consul
6 2 (0.79%) Active Directory Federation Services
6 2 (0.79%) Kustomize
7 1 (0.40%) Grafana
7 1 (0.40%) Kibana
7 1 (0.40%) Prometheus
Vendors
1 44 (17.46%) Microsoft
2 17 (6.75%) Adobe
2 17 (6.75%) Cognizant
3 11 (4.37%) Oracle
4 6 (2.38%) Google
5 4 (1.59%) Sybase
6 3 (1.19%) Cloudera
6 3 (1.19%) Hortonworks
6 3 (1.19%) SAP
7 2 (0.79%) Facebook
7 2 (0.79%) Guidewire
7 2 (0.79%) Red Hat
7 2 (0.79%) Salesforce
7 2 (0.79%) Twitter
8 1 (0.40%) Capita
8 1 (0.40%) ION Trading
8 1 (0.40%) Murex
8 1 (0.40%) OpenLink
8 1 (0.40%) Progress
8 1 (0.40%) Tradeweb