SharePoint Jobs in the South East

Microsoft SharePoint
England > South East

The table below provides summary statistics for permanent job vacancies advertised in the South East requiring SharePoint skills. It includes a benchmarking guide to the annual salaries offered in vacancies that cited SharePoint over the 6 months leading up to 28 May 2025, comparing them to the same period in the previous two years.

6 months to
28 May 2025
Same period 2024 Same period 2023
Rank 151 95 112
Rank change year-on-year -56 +17 +37
Permanent jobs citing SharePoint 179 483 405
As % of all permanent jobs advertised in the South East 1.89% 2.79% 2.86%
As % of the Application Platforms category 29.01% 31.90% 25.54%
Number of salaries quoted 129 384 329
10th Percentile £28,450 £26,250 £27,500
25th Percentile £32,500 £31,250 £30,500
Median annual salary (50th Percentile) £42,500 £42,500 £42,500
Median % change year-on-year - - +6.25%
75th Percentile £60,000 £53,750 £62,500
90th Percentile £72,500 £65,000 £77,500
England median annual salary £45,628 £42,500 £50,000
% change year-on-year +7.36% -15.00% -

All Application Platform Skills
South East

SharePoint falls under the Application Platforms category. For comparison with the information above, the following table provides summary statistics for all permanent job vacancies requiring application platform skills in the South East.

Permanent vacancies with a requirement for application platform skills 617 1,514 1,586
As % of all permanent jobs advertised in the South East 6.52% 8.74% 11.21%
Number of salaries quoted 341 1,051 1,124
10th Percentile £30,000 £27,000 £29,400
25th Percentile £36,250 £31,250 £35,000
Median annual salary (50th Percentile) £50,000 £42,500 £50,000
Median % change year-on-year +17.65% -15.00% +5.26%
75th Percentile £63,250 £59,000 £65,000
90th Percentile £73,750 £67,500 £77,500
England median annual salary £55,000 £50,000 £57,283
% change year-on-year +10.00% -12.71% +4.15%

SharePoint
Job Vacancy Trend in the South East

Job postings citing SharePoint as a proportion of all IT jobs advertised in the South East.
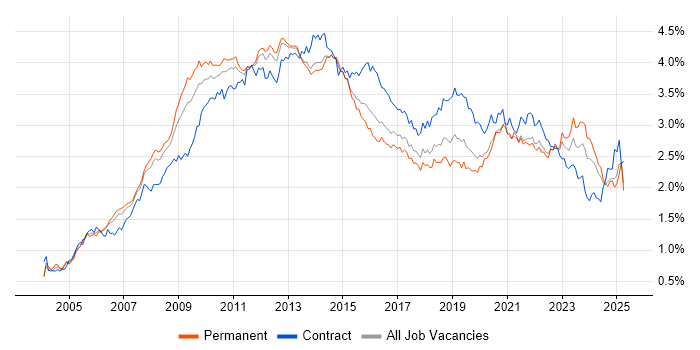
Job vacancy trend for SharePoint in the South East

SharePoint
Salary Trend in the South East

3-month moving average salary quoted in jobs citing SharePoint in the South East.

Salary trend for SharePoint in the South East

SharePoint
Salary Histogram in the South East

Salary distribution for jobs citing SharePoint in the South East over the 6 months to 28 May 2025.

Salary histogram for SharePoint in the South East

SharePoint
Job Locations in the South East

The table below looks at the demand and provides a guide to the median salaries quoted in IT jobs citing SharePoint within the South East region over the 6 months to 28 May 2025. The 'Rank Change' column provides an indication of the change in demand within each location based on the same 6 month period last year.

Location Rank Change
on Same Period
Last Year
Matching
Permanent
IT Job Ads
Median Salary
Past 6 Months
Median Salary
% Change
on Same Period
Last Year
Live
Jobs
Thames Valley -11 94 £37,500 -11.76% 178
Berkshire +7 53 £37,500 -11.76% 113
Buckinghamshire +13 26 £45,000 +28.57% 38
Surrey -5 23 £45,000 -5.26% 43
Hampshire +5 21 £35,000 -17.65% 62
East Sussex +35 20 £55,000 +4.76% 11
Oxfordshire -6 15 £60,000 +39.53% 34
Middlesex - 10 - - 3
Kent -19 8 £31,500 - 32
Sussex +20 3 £42,500 +21.43% 4
SharePoint
England

SharePoint
Co-occurring Skills and Capabilities in the South East by Category

The follow tables expand on the table above by listing co-occurrences grouped by category. The same employment type, locality and period is covered with up to 20 co-occurrences shown in each of the following categories:

Application Platforms
1 45 (25.14%) Microsoft Exchange
2 8 (4.47%) Confluence
3 5 (2.79%) Skype for Business
4 4 (2.23%) Exchange Server 2013
5 3 (1.68%) Exchange Server 2007
5 3 (1.68%) Exchange Server 2010
5 3 (1.68%) Office Communications Server
6 2 (1.12%) SharePoint Server
7 1 (0.56%) Exchange Server 2003
7 1 (0.56%) SharePoint 2010
Applications
1 13 (7.26%) Microsoft Office
2 7 (3.91%) Microsoft Excel
3 2 (1.12%) Adobe Creative Suite
3 2 (1.12%) Microsoft PowerPoint
3 2 (1.12%) Spreadsheet
4 1 (0.56%) Microsoft Project
Business Applications
1 6 (3.35%) Dynamics CRM
2 2 (1.12%) Sage 1000
3 1 (0.56%) Sage 200
Cloud Services
1 112 (62.57%) Microsoft 365
2 89 (49.72%) Azure
3 69 (38.55%) Power Platform
4 55 (30.73%) Power Automate
5 47 (26.26%) PowerApps
6 22 (12.29%) Entra ID
7 16 (8.94%) OneDrive
8 13 (7.26%) Azure DevOps
9 10 (5.59%) PaaS
10 7 (3.91%) SaaS
11 6 (3.35%) Azure App Service
11 6 (3.35%) Azure Synapse Analytics
11 6 (3.35%) Dynamics 365
11 6 (3.35%) GitHub
11 6 (3.35%) GitHub Actions
12 5 (2.79%) Azure Cosmos DB
12 5 (2.79%) Azure Functions
12 5 (2.79%) Azure Logic Apps
12 5 (2.79%) Azure Service Bus
12 5 (2.79%) Serverless
Communications & Networking
1 24 (13.41%) Firewall
2 16 (8.94%) DNS
3 11 (6.15%) VoIP
4 9 (5.03%) DHCP
5 8 (4.47%) Remote Desktop
6 7 (3.91%) IP Telephony
7 5 (2.79%) VPN
7 5 (2.79%) Wi-Fi
8 4 (2.23%) VLAN
9 3 (1.68%) TCP/IP
10 2 (1.12%) Intranet
10 2 (1.12%) LAN
10 2 (1.12%) WAN
11 1 (0.56%) ADSL
11 1 (0.56%) Internet
11 1 (0.56%) Network Security
11 1 (0.56%) SAN
Database & Business Intelligence
1 48 (26.82%) Power BI
2 33 (18.44%) SQL Server
3 26 (14.53%) Big Data
3 26 (14.53%) Data Lake
3 26 (14.53%) Tableau
4 10 (5.59%) Data Warehouse
5 8 (4.47%) Amazon RDS
6 7 (3.91%) Azure SQL Database
7 6 (3.35%) Microsoft Analysis Services
8 3 (1.68%) Relational Database
9 2 (1.12%) SQL Server Integration Services
9 2 (1.12%) SQL Server Reporting Services
Development Applications
1 12 (6.70%) JIRA
General
1 61 (34.08%) Social Skills
2 29 (16.20%) Finance
3 28 (15.64%) Law
4 18 (10.06%) Inclusion and Diversity
5 13 (7.26%) Retail
6 12 (6.70%) Analytical Skills
7 11 (6.15%) Public Sector
7 11 (6.15%) Telecoms
8 10 (5.59%) Automotive
8 10 (5.59%) Manufacturing
9 6 (3.35%) Legal
10 5 (2.79%) Front Office
10 5 (2.79%) Presentation Skills
11 4 (2.23%) Marketing
11 4 (2.23%) Organisational Skills
12 3 (1.68%) Electronics
13 2 (1.12%) Advertising
13 2 (1.12%) Influencing Skills
13 2 (1.12%) Social Housing
13 2 (1.12%) Swedish Language
Job Titles
1 36 (20.11%) Support Engineer
2 28 (15.64%) Lead
3 25 (13.97%) IT Support
4 23 (12.85%) Analyst
4 23 (12.85%) Developer
5 20 (11.17%) Senior
6 17 (9.50%) Support Analyst
7 16 (8.94%) Microsoft 365 Engineer
8 13 (7.26%) IT Engineer
8 13 (7.26%) Technical Support
9 12 (6.70%) Support Technician
10 11 (6.15%) 2nd Line Support
10 11 (6.15%) IT Support Engineer
10 11 (6.15%) SharePoint Engineer
10 11 (6.15%) SharePoint Support
11 8 (4.47%) .NET Developer
12 7 (3.91%) Help Desk Engineer
12 7 (3.91%) Help Desk Support
12 7 (3.91%) Help Desk Support Engineer
12 7 (3.91%) Service Desk Support
Libraries, Frameworks & Software Standards
1 24 (13.41%) .NET
2 14 (7.82%) CSS
2 14 (7.82%) HTML
3 11 (6.15%) React
4 10 (5.59%) .NET Framework
5 6 (3.35%) AngularJS
5 6 (3.35%) ASP.NET
6 4 (2.23%) HTML5
6 4 (2.23%) SPFx
6 4 (2.23%) XML
7 3 (1.68%) HTML5 Canvas
8 1 (0.56%) ADO
8 1 (0.56%) EDI
Miscellaneous
1 19 (10.61%) Onboarding
2 16 (8.94%) Driving Licence
3 8 (4.47%) Product Ownership
4 4 (2.23%) AS400
4 4 (2.23%) iSeries
4 4 (2.23%) Mainframe
5 3 (1.68%) Data Structures
5 3 (1.68%) Replication
6 2 (1.12%) Cloud Native
6 2 (1.12%) Enterprise Software
6 2 (1.12%) FMCG
6 2 (1.12%) Management Information System
7 1 (0.56%) Clustering
7 1 (0.56%) Cyber Threat
7 1 (0.56%) Operational Technology
7 1 (0.56%) Public Cloud
7 1 (0.56%) Renewable Energy
7 1 (0.56%) Smartphone
7 1 (0.56%) Social Media
7 1 (0.56%) Team-Oriented Environment
Operating Systems
1 53 (29.61%) Windows
2 27 (15.08%) Windows Server
3 17 (9.50%) Mac OS
4 13 (7.26%) Windows 10
5 8 (4.47%) Windows Server 2012
6 5 (2.79%) Unix
7 4 (2.23%) Android
8 3 (1.68%) Apple iOS
8 3 (1.68%) Windows Server 2016
9 2 (1.12%) VMS
9 2 (1.12%) Windows Server 2003
10 1 (0.56%) OpenBSD
10 1 (0.56%) Windows 7
10 1 (0.56%) Windows Vista
10 1 (0.56%) Windows XP
Processes & Methodologies
1 53 (29.61%) Business Intelligence
2 51 (28.49%) Problem-Solving
3 45 (25.14%) Mentoring
4 39 (21.79%) Project Management
5 38 (21.23%) Service Management
6 33 (18.44%) Data Analysis
7 32 (17.88%) Analytics
7 32 (17.88%) Computer Science
7 32 (17.88%) Data Analytics
7 32 (17.88%) Data Engineering
7 32 (17.88%) Data Science
8 28 (15.64%) Business Strategy
8 28 (15.64%) Data Integration
8 28 (15.64%) ITSM
9 27 (15.08%) Data Management
9 27 (15.08%) Stakeholder Management
10 26 (14.53%) Data Governance
10 26 (14.53%) Storytelling
11 25 (13.97%) Agile
12 21 (11.73%) ITIL
Programming Languages
1 39 (21.79%) SQL
2 30 (16.76%) C#
3 22 (12.29%) PowerShell
4 19 (10.61%) JavaScript
5 7 (3.91%) Python
6 6 (3.35%) Data Analysis Expressions
7 5 (2.79%) Bicep
8 4 (2.23%) RPG
8 4 (2.23%) TypeScript
8 4 (2.23%) VBA
9 2 (1.12%) T-SQL
9 2 (1.12%) VB.NET
10 1 (0.56%) VBScript
Qualifications
1 53 (29.61%) Degree
2 10 (5.59%) Azure Certification
2 10 (5.59%) Microsoft Certification
3 7 (3.91%) MCP
4 5 (2.79%) MCSA
4 5 (2.79%) SC Cleared
4 5 (2.79%) Security Cleared
5 4 (2.23%) DBS Check
5 4 (2.23%) DV Cleared
6 2 (1.12%) MCSE
7 1 (0.56%) BPSS Clearance
7 1 (0.56%) Computer Science Degree
7 1 (0.56%) ITIL Certification
7 1 (0.56%) Master's Degree
Quality Assurance & Compliance
1 32 (17.88%) Data Quality
2 3 (1.68%) Cyber Essentials
2 3 (1.68%) PMO
3 2 (1.12%) GDPR
4 1 (0.56%) ISO 22301
4 1 (0.56%) SLA
System Software
1 40 (22.35%) Active Directory
2 13 (7.26%) Hyper-V
3 9 (5.03%) VMware Infrastructure
4 8 (4.47%) Virtual Desktop
5 7 (3.91%) Terminal Services
6 6 (3.35%) VMware ESXi
7 3 (1.68%) ISA Server
Systems Management
1 19 (10.61%) Microsoft Intune
2 5 (2.79%) vCenter Server
3 2 (1.12%) Active Directory Federation Services
3 2 (1.12%) Jamf Pro
4 1 (0.56%) FortiGate
4 1 (0.56%) Kubernetes
4 1 (0.56%) PaperCut
Vendors
1 138 (77.09%) Microsoft
2 26 (14.53%) ServiceNow
3 14 (7.82%) Apple
4 11 (6.15%) VMware
5 9 (5.03%) Sophos
6 6 (3.35%) Databricks
7 5 (2.79%) Oracle
7 5 (2.79%) Ubiquiti
8 4 (2.23%) Cisco
8 4 (2.23%) Sage
8 4 (2.23%) SAP
9 3 (1.68%) Citrix
9 3 (1.68%) Meraki
9 3 (1.68%) Salesforce
9 3 (1.68%) SonicWALL
10 2 (1.12%) Datto
10 2 (1.12%) HubSpot
10 2 (1.12%) IFS
10 2 (1.12%) Infor
10 2 (1.12%) WatchGuard