Computer Science Jobs in the UK excluding London

Computer Science
UK > UK excluding London

The following table provides summary statistics for permanent job vacancies advertised in the UK excluding London with a requirement for Computer Science skills. Included is a benchmarking guide to the salaries offered in vacancies that have cited Computer Science over the 6 months to 1 December 2023 with a comparison to the same period in the previous 2 years.

6 months to
1 Dec 2023
Same period 2022 Same period 2021
Rank 53 45 53
Rank change year-on-year -8 +8 +30
Permanent jobs citing Computer Science 1,609 4,163 3,437
As % of all permanent jobs advertised in the UK excluding London 5.06% 6.24% 5.23%
As % of the Processes & Methodologies category 5.37% 6.53% 5.51%
Number of salaries quoted 1,072 1,385 1,686
10th Percentile £30,000 £29,000 £27,500
25th Percentile £43,750 £37,075 £34,990
Median annual salary (50th Percentile) £60,000 £50,000 £47,500
Median % change year-on-year +20.00% +5.26% -5.00%
75th Percentile £70,875 £66,000 £63,750
90th Percentile £84,875 £80,000 £72,500
UK median annual salary £65,000 £60,000 £60,000
% change year-on-year +8.33% - +4.35%

All Process and Methodology Skills
UK excluding London

Computer Science is in the Processes and Methodologies category. The following table is for comparison with the above and provides summary statistics for all permanent job vacancies advertised in the UK excluding London with a requirement for process or methodology skills.

Permanent vacancies with a requirement for process or methodology skills 29,969 63,744 62,376
As % of all permanent jobs advertised in the UK excluding London 94.32% 95.54% 94.91%
Number of salaries quoted 20,494 36,420 42,340
10th Percentile £28,500 £30,780 £29,750
25th Percentile £38,838 £40,000 £37,500
Median annual salary (50th Percentile) £52,500 £53,000 £50,000
Median % change year-on-year -0.94% +6.00% +4.17%
75th Percentile £67,500 £69,000 £65,000
90th Percentile £82,000 £82,500 £78,750
UK median annual salary £60,000 £60,000 £60,000
% change year-on-year - - +9.09%

Computer Science
Job Vacancy Trend in the UK excluding London

Job postings citing Computer Science as a proportion of all IT jobs advertised in the UK excluding London.
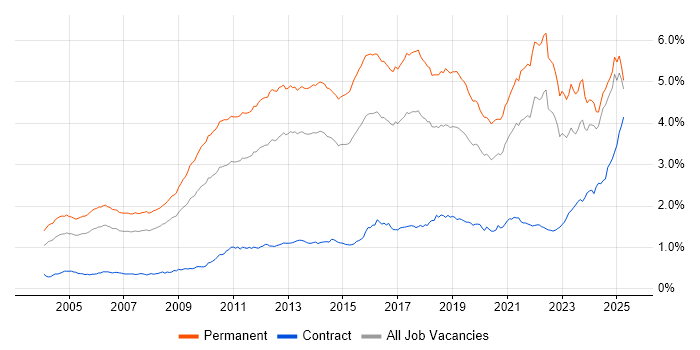
Job vacancy trend for Computer Science in the UK excluding London

Computer Science
Salary Trend in the UK excluding London

3-month moving average salary quoted in jobs citing Computer Science in the UK excluding London.

Salary trend for Computer Science in the UK excluding London

Computer Science
Salary Histogram in the UK excluding London

Salary distribution for jobs citing Computer Science in the UK excluding London over the 6 months to 1 December 2023.

Salary histogram for Computer Science in the UK excluding London

Computer Science
Job Locations in the UK excluding London

The table below looks at the demand and provides a guide to the median salaries quoted in IT jobs citing Computer Science within the UK excluding London region over the 6 months to 1 December 2023. The 'Rank Change' column provides an indication of the change in demand within each location based on the same 6 month period last year.

Location Rank Change
on Same Period
Last Year
Matching
Permanent
IT Job Ads
Median Salary
Past 6 Months
Median Salary
% Change
on Same Period
Last Year
Live
Jobs
South East -4 502 £60,000 +14.29% 421
North of England +43 331 £57,500 +21.69% 248
Midlands +1 212 £55,000 +12.24% 141
South West -25 195 £60,000 +20.00% 117
Yorkshire +29 171 £57,125 +8.81% 85
Scotland -17 157 £55,000 - 100
North West +76 141 £57,500 +27.78% 140
West Midlands +16 136 £55,000 +12.24% 97
East of England -12 129 £65,000 +18.18% 176
East Midlands -6 76 £57,500 +27.78% 44
Wales -31 60 £42,500 -2.08% 40
Northern Ireland -23 28 £55,000 +29.41% 21
North East -9 19 £60,000 +50.00% 26
Channel Islands - 1 - -
Computer Science
UK

Computer Science
Co-occurring Skills and Capabilities in the UK excluding London by Category

The follow tables expand on the table above by listing co-occurrences grouped by category. The same employment type, locality and period is covered with up to 20 co-occurrences shown in each of the following categories:

Application Platforms
1 93 (5.78%) SAS
2 32 (1.99%) Confluence
3 28 (1.74%) SharePoint
4 26 (1.62%) Apache Spark
5 20 (1.24%) Apache
6 15 (0.93%) Tomcat
7 13 (0.81%) Jupyter
8 9 (0.56%) Apache Airflow
9 5 (0.31%) CMS
9 5 (0.31%) ColdFusion
9 5 (0.31%) IIS
9 5 (0.31%) Luigi
9 5 (0.31%) ThingWorx
10 4 (0.25%) OpenEdge
10 4 (0.25%) SharePoint Server
11 3 (0.19%) Adobe Experience Manager
11 3 (0.19%) nginx
12 2 (0.12%) Alfresco
12 2 (0.12%) Captiva
12 2 (0.12%) WordPress
Applications
1 34 (2.11%) Microsoft Office
2 13 (0.81%) Microsoft Excel
3 5 (0.31%) Simulink
4 4 (0.25%) MS Visio
4 4 (0.25%) Spreadsheet
4 4 (0.25%) Trello
5 2 (0.12%) Acrobat
5 2 (0.12%) ArcView
5 2 (0.12%) AutoCAD
5 2 (0.12%) Fireworks
5 2 (0.12%) Mathcad
5 2 (0.12%) Photoshop
5 2 (0.12%) RoboHelp
6 1 (0.062%) Microsoft PowerPoint
6 1 (0.062%) Microsoft Project
6 1 (0.062%) SPSS
Business Applications
1 18 (1.12%) Dynamics CRM
2 9 (0.56%) NetSuite
2 9 (0.56%) ProductWriter
3 4 (0.25%) Dynamics AX
4 3 (0.19%) SAP S/4HANA
4 3 (0.19%) Sparx Enterprise Architect
5 1 (0.062%) Dynamics NAV
5 1 (0.062%) JDE EnterpriseOne
5 1 (0.062%) Magento
5 1 (0.062%) Remedy ITSM
5 1 (0.062%) Sage 200
5 1 (0.062%) SAP HCM
5 1 (0.062%) SAP PP
5 1 (0.062%) SAP SCM
Cloud Services
1 321 (19.95%) Azure
2 301 (18.71%) AWS
3 156 (9.70%) GCP
4 88 (5.47%) Power Platform
5 84 (5.22%) SaaS
6 83 (5.16%) GitHub
7 64 (3.98%) Azure DevOps
8 48 (2.98%) Cloud Computing
9 39 (2.42%) Microsoft 365
10 38 (2.36%) Dynamics 365
11 36 (2.24%) Amazon EC2
12 35 (2.18%) PowerApps
13 33 (2.05%) Power Automate
14 26 (1.62%) Serverless
15 21 (1.31%) PaaS
16 20 (1.24%) IaaS
17 19 (1.18%) AWS Lambda
18 17 (1.06%) Amazon S3
19 14 (0.87%) AWS CloudFormation
20 13 (0.81%) OpenShift
Communications & Networking
1 67 (4.16%) Firewall
2 50 (3.11%) Internet
3 35 (2.18%) Network Security
4 29 (1.80%) VPN
5 28 (1.74%) Wireless
6 27 (1.68%) DNS
6 27 (1.68%) TCP/IP
7 24 (1.49%) DHCP
8 20 (1.24%) WAN
9 15 (0.93%) Intrusion Detection
10 13 (0.81%) HTTP
10 13 (0.81%) VLAN
11 11 (0.68%) SAN
11 11 (0.68%) SD-WAN
11 11 (0.68%) SNMP
11 11 (0.68%) VoIP
12 10 (0.62%) IPv4
12 10 (0.62%) OSPF
13 9 (0.56%) 5G
13 9 (0.56%) MPLS
Database & Business Intelligence
1 119 (7.40%) SQL Server
2 104 (6.46%) MySQL
3 89 (5.53%) Big Data
4 83 (5.16%) Base SAS
5 76 (4.72%) Power BI
6 70 (4.35%) Metadata
7 67 (4.16%) NoSQL
8 65 (4.04%) PostgreSQL
9 54 (3.36%) Relational Database
10 41 (2.55%) Data Warehouse
11 34 (2.11%) Data Lake
12 32 (1.99%) Amazon RDS
13 27 (1.68%) Tableau
14 17 (1.06%) SQL Server Reporting Services
15 14 (0.87%) Geospatial Data
16 13 (0.81%) SQL Server Integration Services
17 12 (0.75%) Data Mining
17 12 (0.75%) DynamoDB
17 12 (0.75%) Oracle Database
18 11 (0.68%) Amazon Redshift
Development Applications
1 229 (14.23%) Git
2 72 (4.47%) Jenkins
3 61 (3.79%) JIRA
4 38 (2.36%) Maven
5 34 (2.11%) Selenium
6 26 (1.62%) IntelliJ
7 24 (1.49%) Cypress.io
8 17 (1.06%) Team Foundation Server
9 16 (0.99%) Subversion
10 15 (0.93%) Bitbucket
10 15 (0.93%) Visual Studio Team System
11 13 (0.81%) CMake
12 12 (0.75%) GitLab
13 11 (0.68%) Visual Studio
14 7 (0.44%) Cucumber
14 7 (0.44%) Oracle APEX
14 7 (0.44%) Rational DOORS
15 5 (0.31%) JUnit
15 5 (0.31%) Oracle Forms
16 4 (0.25%) TestComplete
General
1 527 (32.75%) Social Skills
2 256 (15.91%) Finance
3 236 (14.67%) Analytical Skills
4 199 (12.37%) Inclusion and Diversity
5 122 (7.58%) Telecoms
6 89 (5.53%) Manufacturing
7 85 (5.28%) Pharmaceutical
8 73 (4.54%) Marketing
9 68 (4.23%) Electronics
10 57 (3.54%) Public Sector
11 39 (2.42%) Presentation Skills
12 37 (2.30%) Automotive
13 29 (1.80%) Retail
14 24 (1.49%) Games
14 24 (1.49%) Law
15 21 (1.31%) Aerospace
16 20 (1.24%) Legal
17 19 (1.18%) Multimedia
18 18 (1.12%) Military
19 14 (0.87%) Banking
Job Titles
1 373 (23.18%) Developer
2 367 (22.81%) Senior
3 167 (10.38%) Software Engineer
4 133 (8.27%) Project Manager
5 124 (7.71%) Architect
6 115 (7.15%) Senior Developer
7 104 (6.46%) Analyst
7 104 (6.46%) Senior Manager
8 99 (6.15%) Senior Project Manager
9 90 (5.59%) Lead
10 89 (5.53%) Software Developer
10 89 (5.53%) Solutions Architect
11 75 (4.66%) Enterprise Architect
11 75 (4.66%) Enterprise Solutions Architect
11 75 (4.66%) Programmer
12 69 (4.29%) Graduate
13 66 (4.10%) SAS Programmer
13 66 (4.10%) SAS Statistical Programmer
13 66 (4.10%) Statistical Programmer
14 59 (3.67%) Data Engineer
Libraries, Frameworks & Software Standards
1 223 (13.86%) HTML
2 183 (11.37%) React
3 174 (10.81%) CSS
4 172 (10.69%) .NET
5 94 (5.84%) AngularJS
6 91 (5.66%) XML
7 70 (4.35%) RESTful
8 58 (3.60%) HTML5
9 54 (3.36%) Vue
10 46 (2.86%) ASP.NET
11 42 (2.61%) CSS3
12 41 (2.55%) Spring
13 40 (2.49%) jQuery
13 40 (2.49%) Node.js
14 37 (2.30%) OpenGL ES
14 37 (2.30%) Vulkan
15 34 (2.11%) OpenGL
15 34 (2.11%) PyTorch
15 34 (2.11%) REST
16 29 (1.80%) J2EE
Miscellaneous
1 216 (13.42%) Management Information System
2 141 (8.76%) Algorithms
3 123 (7.64%) Virtual Team
4 106 (6.59%) Onboarding
4 106 (6.59%) Self-Motivation
5 98 (6.09%) Life Science
6 53 (3.29%) Product Ownership
7 50 (3.11%) IoT
8 45 (2.80%) Smartphone
9 43 (2.67%) Data Structures
10 42 (2.61%) Cyberattack
11 34 (2.11%) Greenfield Project
11 34 (2.11%) Mali
12 30 (1.86%) Legacy Systems
13 23 (1.43%) Analytical Mindset
14 21 (1.31%) Enterprise Software
14 21 (1.31%) Renewable Energy
15 19 (1.18%) Embedded Systems
16 18 (1.12%) 3D Graphics
17 16 (0.99%) Handset
Operating Systems
1 157 (9.76%) Linux
2 119 (7.40%) Windows
3 50 (3.11%) Android
4 33 (2.05%) Windows Server
5 28 (1.74%) Mac OS
6 26 (1.62%) Unix
7 14 (0.87%) Windows Server 2012
8 10 (0.62%) Windows Server 2019
9 9 (0.56%) Windows Server 2016
10 7 (0.44%) Apple iOS
11 5 (0.31%) FreeRTOS
11 5 (0.31%) Windows 2000
11 5 (0.31%) Windows Server 2003
12 4 (0.25%) Mac OS X
12 4 (0.25%) Ubuntu
12 4 (0.25%) Windows 10
13 2 (0.12%) CentOS
13 2 (0.12%) Embedded Linux
13 2 (0.12%) Kali Linux
13 2 (0.12%) Red Hat Enterprise Linux
Processes & Methodologies
1 624 (38.78%) Problem-Solving
2 509 (31.63%) Agile
3 422 (26.23%) Mathematics
4 377 (23.43%) Software Engineering
5 297 (18.46%) Project Management
6 261 (16.22%) DevOps
7 192 (11.93%) SDLC
8 191 (11.87%) Scrum
9 185 (11.50%) Statistics
10 181 (11.25%) Machine Learning
11 176 (10.94%) Mentoring
12 174 (10.81%) Artificial Intelligence
13 166 (10.32%) Cybersecurity
14 164 (10.19%) Physics
15 163 (10.13%) Project Delivery
16 156 (9.70%) Collaborative Working
17 153 (9.51%) ERP
18 145 (9.01%) Decision-Making
19 142 (8.83%) Actionable Insight
20 141 (8.76%) Analytics
Programming Languages
1 377 (23.43%) Python
2 367 (22.81%) JavaScript
3 302 (18.77%) SQL
4 241 (14.98%) C#
5 196 (12.18%) Java
6 166 (10.32%) C++
7 147 (9.14%) C
8 125 (7.77%) TypeScript
9 93 (5.78%) Bash
10 83 (5.16%) SAS Macro
11 77 (4.79%) PowerShell
12 65 (4.04%) PHP
13 55 (3.42%) R
14 44 (2.73%) Go
15 33 (2.05%) Ruby
16 32 (1.99%) Rust
17 31 (1.93%) Perl
18 28 (1.74%) Embedded C
19 25 (1.55%) VB.NET
20 19 (1.18%) Fortran
Qualifications
1 1,503 (93.41%) Degree
2 889 (55.25%) Computer Science Degree
3 212 (13.18%) Security Cleared
4 181 (11.25%) Master's Degree
5 114 (7.09%) SC Cleared
6 76 (4.72%) TOGAF Certification
7 65 (4.04%) DV Cleared
8 61 (3.79%) Numerate Degree
9 59 (3.67%) PhD
10 30 (1.86%) CISSP
11 26 (1.62%) DBS Check
12 23 (1.43%) Microsoft Certification
13 22 (1.37%) Azure Certification
14 21 (1.31%) HNC
15 20 (1.24%) HND
16 19 (1.18%) Cisco Certification
17 18 (1.12%) AWS Certification
18 17 (1.06%) CISM
18 17 (1.06%) PMP
19 14 (0.87%) CRISC
Quality Assurance & Compliance
1 146 (9.07%) QA
2 83 (5.16%) CDISC
3 31 (1.93%) ISO/IEC 27001
4 29 (1.80%) Data Quality
5 22 (1.37%) GDPR
5 22 (1.37%) NIST
5 22 (1.37%) WCAG
6 12 (0.75%) Accessibility
7 11 (0.68%) SLA
8 10 (0.62%) Cyber Essentials
8 10 (0.62%) GRC
8 10 (0.62%) HIPAA
8 10 (0.62%) Sarbanes-Oxley
9 9 (0.56%) JSP 440
10 8 (0.50%) MISRA
11 7 (0.44%) IEC 61508
11 7 (0.44%) RMADS
12 6 (0.37%) PCI DSS
12 6 (0.37%) PMO
13 5 (0.31%) Disclosure Scotland
System Software
1 215 (13.36%) Docker
2 53 (3.29%) Firmware
3 48 (2.98%) Active Directory
4 30 (1.86%) VMware Infrastructure
5 17 (1.06%) Hyper-V
6 10 (0.62%) Embedded Firmware
7 9 (0.56%) vSphere
8 6 (0.37%) KVM
8 6 (0.37%) VMware ESXi
9 4 (0.25%) Virtual Desktop
9 4 (0.25%) Virtual Machines
10 1 (0.062%) BitLocker
10 1 (0.062%) QEMU
10 1 (0.062%) Terminal Services
10 1 (0.062%) XenApp
Systems Management
1 173 (10.75%) Kubernetes
2 39 (2.42%) Ansible
3 37 (2.30%) Terraform
4 16 (0.99%) Puppet
5 9 (0.56%) Progress Chef
6 6 (0.37%) Grafana
7 5 (0.31%) McAfee ePO
7 5 (0.31%) Microsoft Clustering
7 5 (0.31%) vCenter Server
8 4 (0.25%) SCCM
8 4 (0.25%) vRealize
8 4 (0.25%) vRealize Orchestrator
9 3 (0.19%) Microsoft Intune
9 3 (0.19%) Nessus
9 3 (0.19%) Single Sign-On
10 2 (0.12%) Jamf Pro
10 2 (0.12%) Nmap
10 2 (0.12%) SCOM
10 2 (0.12%) Systems Management Server (SMS)
10 2 (0.12%) WSUS
Vendors
1 139 (8.64%) Microsoft
2 121 (7.52%) Salesforce
3 98 (6.09%) NEC
4 50 (3.11%) Oracle
5 45 (2.80%) Google
5 45 (2.80%) VMware
6 38 (2.36%) SAP
7 23 (1.43%) Databricks
8 12 (0.75%) ESRI
8 12 (0.75%) ServiceNow
9 11 (0.68%) Atlassian
9 11 (0.68%) Cadence
9 11 (0.68%) Cisco
9 11 (0.68%) Citrix
10 9 (0.56%) JD Edwards
10 9 (0.56%) Splunk
11 7 (0.44%) Juniper
12 6 (0.37%) Adobe
12 6 (0.37%) HP
12 6 (0.37%) TOWER Software