Developer/Software Engineer Job Trends

Software Engineer/Developer
UK

The median Software Engineer/Developer salary in the UK is £130,000 per year, according to job vacancies posted during the 6 months leading to 16 September 2025.

The table below provides salary benchmarking and summary statistics, comparing them to the same period in the previous two years.

6 months to
16 Sep 2025
Same period 2024 Same period 2023
Rank 496 477 445
Rank change year-on-year -19 -32 +86
Permanent jobs requiring a Developer/Software Engineer 181 335 362
As % of all permanent jobs advertised in the UK 0.37% 0.43% 0.59%
As % of the Job Titles category 0.41% 0.45% 0.63%
Number of salaries quoted 152 299 354
10th Percentile - £71,250 £68,550
25th Percentile £100,000 £87,500 £85,000
Median annual salary (50th Percentile) £130,000 £110,000 £105,000
Median % change year-on-year +18.18% +4.76% +2.44%
75th Percentile £137,500 £142,500 £138,750
90th Percentile £142,500 £165,000 £143,750
UK excluding London median annual salary £60,000 £70,000 £55,000
% change year-on-year -14.29% +27.27% -10.20%

All Permanent IT Job Vacancies
UK

For comparison with the information above, the following table provides summary statistics for all permanent IT job vacancies. Most job vacancies include a discernible job title that can be normalized. As such, the figures in the second row provide an indication of the number of permanent jobs in our overall sample.

Permanent vacancies in the UK with a recognized job title 44,155 74,074 57,839
% of permanent jobs with a recognized job title 89.61% 95.25% 94.01%
Number of salaries quoted 25,862 44,536 44,785
10th Percentile £28,250 £30,000 £32,500
25th Percentile £36,250 £40,000 £43,750
Median annual salary (50th Percentile) £55,000 £55,000 £60,000
Median % change year-on-year - -8.33% -
75th Percentile £75,000 £73,750 £80,000
90th Percentile £95,000 £92,500 £97,500
UK excluding London median annual salary £47,500 £50,000 £52,500
% change year-on-year -5.00% -4.76% -

Developer/Software Engineer
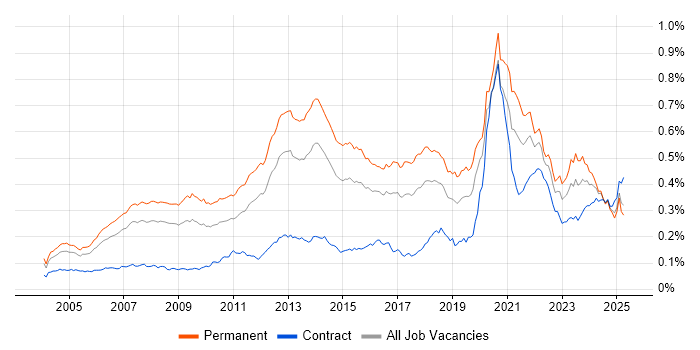
Job Vacancy Trend

Job postings that featured Developer/Software Engineer in the job title as a proportion of all IT jobs advertised.

Job vacancy trend for Developer/Software Engineer in the UK

Developer/Software Engineer
Salary Trend

Salary distribution trend for Developer/Software Engineer job vacancies in the UK.

Salary distribution trend for Developer/Software Engineer job vacancies in the UK

Developer/Software Engineer
Salary Histogram

Salary distribution for jobs citing Developer/Software Engineer over the 6 months to 16 September 2025.

Salary histogram for Developer/Software Engineer in the UK

Developer/Software Engineer
Top 8 Job Locations

The table below looks at the demand and provides a guide to the median salaries quoted in IT jobs citing Developer/Software Engineer within the UK over the 6 months to 16 September 2025. The 'Rank Change' column provides an indication of the change in demand within each location based on the same 6 month period last year.

Location Rank Change
on Same Period
Last Year
Matching
Permanent
IT Job Ads
Median Salary
Past 6 Months
Median Salary
% Change
on Same Period
Last Year
Live
Jobs
England -24 163 £130,000 +18.18% 6
London -22 160 £130,000 +18.18% 1
Work from Home +16 148 £130,000 +18.18% 4
UK excluding London +66 17 £60,000 -14.29% 5
Scotland +47 14 - -
North of England +54 2 £60,000 +26.32% 2
Yorkshire - 2 £60,000 - 2
South East +42 1 £65,000 +62.50% 2

Developer/Software Engineer Skill Set
Top 30 Co-occurring Skills and Capabilities

For the 6 months to 16 September 2025, Developer/Software Engineer job roles required the following skills and capabilities in order of popularity. The figures indicate the absolute number co-occurrences and as a proportion of all permanent job ads featuring Developer/Software Engineer in the job title.

1 181 (100.00%) Software Engineering
2 175 (96.69%) Agile
3 174 (96.13%) Finance
4 165 (91.16%) React
5 163 (90.06%) AWS
6 157 (86.74%) JavaScript
7 156 (86.19%) TypeScript
8 149 (82.32%) Investment Management
9 145 (80.11%) Front Office
9 145 (80.11%) Fixed Income
10 139 (76.80%) Node.js
11 127 (70.17%) GCP
12 122 (67.40%) Asset Management
13 119 (65.75%) Order Management
14 118 (65.19%) Fintech
14 118 (65.19%) Equities
14 118 (65.19%) Foreign Exchange (FX)
15 116 (64.09%) Python
16 115 (63.54%) AngularJS
17 112 (61.88%) PostgreSQL
18 111 (61.33%) Vue
19 99 (54.70%) Amazon Athena
20 95 (52.49%) Apache Airflow
20 95 (52.49%) Performance Attribution
20 95 (52.49%) dbt
20 95 (52.49%) Dremio
20 95 (52.49%) Apache Arrow
20 95 (52.49%) Apache Iceberg
20 95 (52.49%) Risk Management
20 95 (52.49%) Pandas

Developer/Software Engineer Skill Set
Co-occurring Skills and Capabilities by Category

The follow tables expand on the table above by listing co-occurrences grouped by category. The same employment type, locality and period is covered with up to 20 co-occurrences shown in each of the following categories:

Application Platforms
1 95 (52.49%) Apache Airflow
2 5 (2.76%) Apache Spark
Cloud Services
1 163 (90.06%) AWS
2 127 (70.17%) GCP
3 95 (52.49%) dbt
4 13 (7.18%) Azure
5 4 (2.21%) Amazon EC2
5 4 (2.21%) Amazon ECS
5 4 (2.21%) Amazon EMR
5 4 (2.21%) Amazon MSK
5 4 (2.21%) Amazon S3
5 4 (2.21%) AWS Lambda
5 4 (2.21%) GitHub
5 4 (2.21%) Serverless
6 3 (1.66%) Figma
Database & Business Intelligence
1 112 (61.88%) PostgreSQL
2 99 (54.70%) Amazon Athena
3 95 (52.49%) Apache Arrow
3 95 (52.49%) Apache Iceberg
3 95 (52.49%) Dremio
4 5 (2.76%) Apache Hive
4 5 (2.76%) Big Data
4 5 (2.76%) Hadoop
4 5 (2.76%) HBase
5 4 (2.21%) Amazon RDS
5 4 (2.21%) Electronic Patient Records
5 4 (2.21%) Oracle Database
5 4 (2.21%) Relational Database
Development Applications
1 9 (4.97%) Git
1 9 (4.97%) Maven
2 8 (4.42%) Jenkins
3 5 (2.76%) Gradle
4 4 (2.21%) Vite
5 3 (1.66%) Spinnaker
General
1 174 (96.13%) Finance
2 145 (80.11%) Front Office
3 33 (18.23%) Banking
4 29 (16.02%) Inclusion and Diversity
4 29 (16.02%) Law
5 12 (6.63%) Marketing
6 9 (4.97%) Analytical Skills
7 6 (3.31%) Social Skills
8 4 (2.21%) Legal
8 4 (2.21%) Private Banking
Libraries, Frameworks & Software Standards
1 165 (91.16%) React
2 139 (76.80%) Node.js
3 115 (63.54%) AngularJS
4 111 (61.33%) Vue
5 95 (52.49%) NumPy
5 95 (52.49%) Pandas
5 95 (52.49%) SciPy
6 50 (27.62%) Redux
7 32 (17.68%) Kafka
8 24 (13.26%) GraphQL
9 20 (11.05%) Spring
10 11 (6.08%) Spring Boot
11 9 (4.97%) REST
12 5 (2.76%) JPA
13 4 (2.21%) CSS
13 4 (2.21%) D3.js
13 4 (2.21%) Highcharts JS
13 4 (2.21%) JMS
13 4 (2.21%) jQuery
13 4 (2.21%) RESTful
Miscellaneous
1 145 (80.11%) Fixed Income
2 118 (65.19%) Equities
2 118 (65.19%) Foreign Exchange (FX)
3 12 (6.63%) Cloud Native
4 10 (5.52%) Hedge funds
5 7 (3.87%) Product Ownership
6 5 (2.76%) Algorithms
6 5 (2.76%) Legacy Systems
7 4 (2.21%) Derivative
7 4 (2.21%) Distributed Applications
7 4 (2.21%) Market Risk
8 3 (1.66%) Greenfield Project
8 3 (1.66%) Virtual Team
9 2 (1.10%) Mobile App
Operating Systems
1 5 (2.76%) Unix
2 1 (0.55%) Apple iOS
Processes & Methodologies
1 181 (100.00%) Software Engineering
2 175 (96.69%) Agile
3 149 (82.32%) Investment Management
4 122 (67.40%) Asset Management
5 119 (65.75%) Order Management
6 118 (65.19%) Fintech
7 95 (52.49%) Performance Attribution
7 95 (52.49%) Risk Management
8 40 (22.10%) Full-Stack Development
9 27 (14.92%) Problem-Solving
10 25 (13.81%) Operational Stability
11 24 (13.26%) Portfolio Management
11 24 (13.26%) SDLC
12 20 (11.05%) CI/CD
12 20 (11.05%) TDD
12 20 (11.05%) User Experience
13 17 (9.39%) Computer Science
14 13 (7.18%) Artificial Intelligence
14 13 (7.18%) Decision-Making
14 13 (7.18%) Machine Learning
Programming Languages
1 157 (86.74%) JavaScript
2 156 (86.19%) TypeScript
3 116 (64.09%) Python
4 68 (37.57%) Java
5 24 (13.26%) Go
6 9 (4.97%) SQL
7 5 (2.76%) PL/SQL
8 3 (1.66%) C#
9 2 (1.10%) C
10 1 (0.55%) Objective-C
10 1 (0.55%) Swift
Qualifications
1 4 (2.21%) Computer Science Degree
1 4 (2.21%) Degree
Quality Assurance & Compliance
1 4 (2.21%) Accessibility
1 4 (2.21%) QA
System Software
1 5 (2.76%) HDFS
Systems Management
1 7 (3.87%) Kubernetes
2 4 (2.21%) Terraform
3 3 (1.66%) Argo
Vendors
1 8 (4.42%) Oracle
2 5 (2.76%) Cloudera
2 5 (2.76%) Databricks
3 2 (1.10%) Xamarin
4 1 (0.55%) Microsoft