Electronic Patient Records Job Trends

Electronic Patient/Health/Medical Records (EPR, EHR, EMR)
UK

The table below provides summary statistics and salary benchmarking for jobs requiring Electronic Patient Records skills. It covers vacancies from the 6 months leading up to 18 September 2025, with comparisons to the same periods in the previous two years.

6 months to
18 Sep 2025
Same period 2024 Same period 2023
Rank 619 744 580
Rank change year-on-year +125 -164 +316
Permanent jobs citing Electronic Patient Records 57 52 199
As % of all permanent jobs advertised in the UK 0.12% 0.067% 0.33%
As % of the Database & Business Intelligence category 0.79% 0.43% 1.56%
Number of salaries quoted 28 19 25
10th Percentile £39,400 £36,850 £42,750
25th Percentile £64,375 £41,724 £46,000
Median annual salary (50th Percentile) £70,000 £60,000 £75,000
Median % change year-on-year +16.67% -20.00% +9.09%
75th Percentile £77,188 £96,250 £88,738
90th Percentile £80,750 £97,500 £105,995
UK excluding London median annual salary £70,000 £44,503 £85,690
% change year-on-year +57.29% -48.07% +22.41%

All Database and Business Intelligence Skills
UK

Electronic Patient Records falls under the Databases and Business Intelligence category. For comparison with the information above, the following table provides summary statistics for all permanent job vacancies requiring database or business intelligence skills.

Permanent vacancies with a requirement for database or business intelligence skills 7,208 12,022 12,761
As % of all permanent jobs advertised in the UK 14.57% 15.39% 21.18%
Number of salaries quoted 4,535 7,174 10,178
10th Percentile £33,750 £37,500 £37,500
25th Percentile £45,000 £46,306 £47,500
Median annual salary (50th Percentile) £60,000 £63,500 £62,500
Median % change year-on-year -5.51% +1.60% +4.17%
75th Percentile £80,000 £86,250 £80,000
90th Percentile £107,500 £115,000 £97,290
UK excluding London median annual salary £53,000 £52,500 £55,000
% change year-on-year +0.95% -4.55% +2.80%

Electronic Patient Records
Job Vacancy Trend

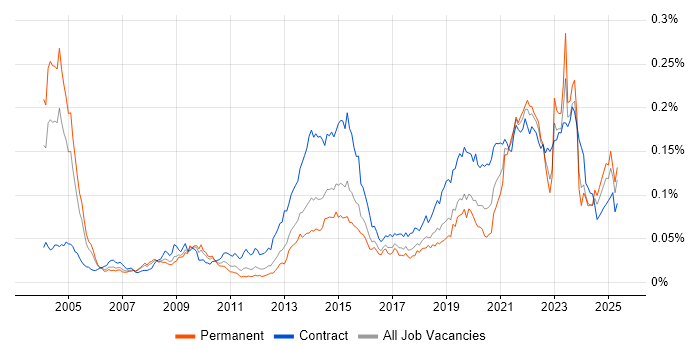
Job postings citing Electronic Patient Records as a proportion of all IT jobs advertised.

Job vacancy trend for Electronic Patient Records in the UK

Electronic Patient Records
Salary Trend

Salary distribution trend for jobs in the UK citing Electronic Patient Records.

Salary distribution trend for jobs in the UK citing Electronic Patient Records

Electronic Patient Records
Salary Histogram

Salary distribution for jobs citing Electronic Patient Records over the 6 months to 18 September 2025.

Salary histogram for Electronic Patient Records in the UK

Electronic Patient Records
Top 11 Job Locations

The table below looks at the demand and provides a guide to the median salaries quoted in IT jobs citing Electronic Patient Records within the UK over the 6 months to 18 September 2025. The 'Rank Change' column provides an indication of the change in demand within each location based on the same 6 month period last year.

Location Rank Change
on Same Period
Last Year
Matching
Permanent
IT Job Ads
Median Salary
Past 6 Months
Median Salary
% Change
on Same Period
Last Year
Live
Jobs
England +113 37 £70,000 -6.67% 79
UK excluding London +104 21 £70,000 +57.29% 60
London +61 12 £72,500 -21.62% 23
South East +58 9 £75,000 -44.44% 11
Work from Home +57 6 £71,250 -5.00% 36
Midlands +55 5 £21,500 -71.33% 8
East Midlands - 5 £21,500 - 4
Scotland +30 4 - - 1
North of England +19 2 £59,000 -5.60% 15
North West +11 2 £59,000 +18.00% 9
South West +70 1 £40,000 +2.89% 8

Electronic Patient Records
Co-occurring Skills and Capabilities by Category

The follow tables expand on the table above by listing co-occurrences grouped by category. The same employment type, locality and period is covered with up to 20 co-occurrences shown in each of the following categories:

Application Platforms
1 6 (10.53%) Apache Spark
2 4 (7.02%) Apache Airflow
3 1 (1.75%) Confluence
Applications
1 5 (8.77%) Microsoft Office
Business Applications
1 1 (1.75%) Lorenzo
1 1 (1.75%) SystmOne
Cloud Services
1 15 (26.32%) AWS
2 13 (22.81%) Amazon EMR
3 11 (19.30%) Azure
4 9 (15.79%) Amazon ECS
4 9 (15.79%) Serverless
5 8 (14.04%) Amazon EC2
5 8 (14.04%) AWS Lambda
6 5 (8.77%) GCP
7 4 (7.02%) Amazon Bedrock
7 4 (7.02%) Amazon EKS
7 4 (7.02%) Amazon Kinesis
7 4 (7.02%) Amazon MSK
7 4 (7.02%) Amazon S3
7 4 (7.02%) Amazon SageMaker
7 4 (7.02%) Amazon SQS
8 3 (5.26%) SaaS
9 2 (3.51%) GitHub
9 2 (3.51%) Power Platform
10 1 (1.75%) Pulumi
10 1 (1.75%) Snowflake
Communications & Networking
1 6 (10.53%) SSL
2 1 (1.75%) 4G
Database & Business Intelligence
1 8 (14.04%) Amazon RDS
1 8 (14.04%) MySQL
2 4 (7.02%) Amazon Athena
2 4 (7.02%) Amazon Aurora
2 4 (7.02%) Apache Iceberg
2 4 (7.02%) DynamoDB
2 4 (7.02%) Flink
2 4 (7.02%) PostgreSQL
2 4 (7.02%) Relational Database
3 3 (5.26%) Data Warehouse
4 2 (3.51%) Big Data
4 2 (3.51%) Power BI
5 1 (1.75%) Data Lake
5 1 (1.75%) QlikView
5 1 (1.75%) SQL Server
5 1 (1.75%) SQL Server Reporting Services
5 1 (1.75%) Tableau
Development Applications
1 4 (7.02%) Git
1 4 (7.02%) Jenkins
1 4 (7.02%) Maven
1 4 (7.02%) Terragrunt
2 2 (3.51%) Rational Rhapsody
3 1 (1.75%) JIRA
General
1 27 (47.37%) Health Technology
2 17 (29.82%) Inclusion and Diversity
2 17 (29.82%) Social Skills
3 15 (26.32%) Law
4 14 (24.56%) Marketing
5 13 (22.81%) Finance
6 12 (21.05%) Analytical Skills
7 8 (14.04%) Banking
8 7 (12.28%) Pharmaceutical
9 3 (5.26%) Digital Health
9 3 (5.26%) Digital Healthcare
10 2 (3.51%) Public Sector
11 1 (1.75%) Games
11 1 (1.75%) Influencing Skills
11 1 (1.75%) Retail
Job Titles
1 17 (29.82%) Senior
2 9 (15.79%) Lead
3 8 (14.04%) Software Engineer
4 7 (12.28%) Configuration Manager
5 6 (10.53%) Delivery Manager
5 6 (10.53%) Developer
5 6 (10.53%) Integration Specialist
5 6 (10.53%) Senior Delivery Manager
5 6 (10.53%) Senior Manager
6 5 (8.77%) Sales Executive
6 5 (8.77%) Senior Sales Executive
6 5 (8.77%) Software Developer
6 5 (8.77%) Solutions Sales Executive
7 4 (7.02%) Consultant
7 4 (7.02%) Developer/Software Engineer
7 4 (7.02%) Java Developer
7 4 (7.02%) Java Engineer
7 4 (7.02%) Java Software Developer
7 4 (7.02%) Java Software Engineer
7 4 (7.02%) Senior Software Engineer
Libraries, Frameworks & Software Standards
1 21 (36.84%) FHIR
2 7 (12.28%) JSON
2 7 (12.28%) XML
3 5 (8.77%) HTML
3 5 (8.77%) Lightning Web Components
3 5 (8.77%) RESTful
4 4 (7.02%) AngularJS
4 4 (7.02%) FastAPI
4 4 (7.02%) jQuery
4 4 (7.02%) JSON Web Signature
4 4 (7.02%) Kafka
4 4 (7.02%) LangChain
4 4 (7.02%) LangGraph
4 4 (7.02%) OAuth
4 4 (7.02%) OpenID
4 4 (7.02%) PyTorch
4 4 (7.02%) React
4 4 (7.02%) Spring
4 4 (7.02%) Spring Boot
4 4 (7.02%) TensorFlow
Miscellaneous
1 29 (50.88%) NHS
2 5 (8.77%) Management Information System
2 5 (8.77%) PACS
3 4 (7.02%) AI Agents
3 4 (7.02%) Cloud Native
3 4 (7.02%) Data Structures
3 4 (7.02%) Distributed Systems
3 4 (7.02%) Mobile Banking
3 4 (7.02%) Public Cloud
4 3 (5.26%) Linux Command Line
5 2 (3.51%) LIMS
5 2 (3.51%) Onboarding
6 1 (1.75%) Enterprise Software
6 1 (1.75%) Hackathon
6 1 (1.75%) Legacy Code
6 1 (1.75%) Smart Home
6 1 (1.75%) SystemC
Operating Systems
1 3 (5.26%) Linux
Processes & Methodologies
1 17 (29.82%) Agile
2 14 (24.56%) Analytics
3 13 (22.81%) Problem-Solving
3 13 (22.81%) Project Delivery
4 12 (21.05%) Software Engineering
5 11 (19.30%) Computer Science
5 11 (19.30%) Risk Management
6 10 (17.54%) Stakeholder Management
7 9 (15.79%) Decision-Making
7 9 (15.79%) Strategic Planning
7 9 (15.79%) User Acceptance Testing
8 8 (14.04%) Containerisation
8 8 (14.04%) Test Automation
9 7 (12.28%) Continuous Improvement
9 7 (12.28%) Data Analytics
9 7 (12.28%) Machine Learning
10 6 (10.53%) API Integration
10 6 (10.53%) Business Strategy
10 6 (10.53%) People Management
10 6 (10.53%) Resource Allocation
Programming Languages
1 22 (38.60%) SQL
2 11 (19.30%) Python
3 8 (14.04%) Java
3 8 (14.04%) JavaScript
4 4 (7.02%) Rust
5 3 (5.26%) R
6 2 (3.51%) C#
7 1 (1.75%) C
7 1 (1.75%) Perl
7 1 (1.75%) TypeScript
Qualifications
1 14 (24.56%) Degree
2 5 (8.77%) Computer Science Degree
3 2 (3.51%) Master's Degree
3 2 (3.51%) PhD
4 1 (1.75%) City & Guilds
4 1 (1.75%) DBS Check
4 1 (1.75%) NVQ Level 3
4 1 (1.75%) PMP
4 1 (1.75%) SC Cleared
4 1 (1.75%) Security Cleared
Quality Assurance & Compliance
1 21 (36.84%) HL7
2 7 (12.28%) SNOMED CT
3 5 (8.77%) GDPR
3 5 (8.77%) QA
4 2 (3.51%) DICOM
4 2 (3.51%) PMO
5 1 (1.75%) Cyber Essentials
5 1 (1.75%) Cyber Essentials PLUS
5 1 (1.75%) HIPAA
5 1 (1.75%) ISO/IEC 27001
System Software
1 5 (8.77%) Docker
2 2 (3.51%) IAG
Systems Management
1 8 (14.04%) Kubernetes
2 5 (8.77%) Terraform
3 4 (7.02%) Single Sign-On
Vendors
1 6 (10.53%) Microsoft
2 5 (8.77%) Salesforce
3 4 (7.02%) OpenAI
3 4 (7.02%) Oracle
4 2 (3.51%) Cerner
4 2 (3.51%) InterSystems
4 2 (3.51%) MEDITECH
5 1 (1.75%) Foundry
5 1 (1.75%) Google
5 1 (1.75%) Palantir