Go (Golang)
UK

The following table provides summary statistics for permanent job vacancies with a requirement for Go skills. Included is a benchmarking guide to the salaries offered in vacancies that have cited Go over the 6 months to 10 December 2023 with a comparison to the same period in the previous 2 years.

6 months to
10 Dec 2023
Same period 2022 Same period 2021
Rank 272 138 134
Rank change year-on-year -134 -4 +25
Permanent jobs citing Go 633 3,210 3,548
As % of all permanent jobs advertised in the UK 1.21% 2.63% 2.79%
As % of the Programming Languages category 2.97% 5.72% 5.37%
Number of salaries quoted 433 1,360 2,352
10th Percentile £50,000 £51,125 £47,500
25th Percentile £61,250 £61,250 £55,000
Median annual salary (50th Percentile) £80,000 £80,000 £75,000
Median % change year-on-year - +6.67% +7.14%
75th Percentile £107,500 £95,000 £97,500
90th Percentile £139,750 £112,500 £112,500
UK excluding London median annual salary £70,576 £70,000 £70,000
% change year-on-year +0.82% - +16.67%

All Programming Languages
UK

Go is in the Programming Languages category. The following table is for comparison with the above and provides summary statistics for all permanent job vacancies with a requirement for coding skills.

Permanent vacancies with a requirement for coding skills 21,309 56,138 66,040
As % of all permanent jobs advertised in the UK 40.76% 45.93% 51.97%
Number of salaries quoted 16,539 35,840 45,476
10th Percentile £39,740 £38,443 £36,250
25th Percentile £47,845 £47,500 £45,000
Median annual salary (50th Percentile) £65,000 £65,000 £60,000
Median % change year-on-year - +8.33% +9.09%
75th Percentile £85,000 £85,000 £80,000
90th Percentile £106,250 £102,500 £97,500
UK excluding London median annual salary £55,000 £55,000 £50,000
% change year-on-year - +10.00% -

Go
Job Vacancy Trend

Job postings citing Go as a proportion of all IT jobs advertised.
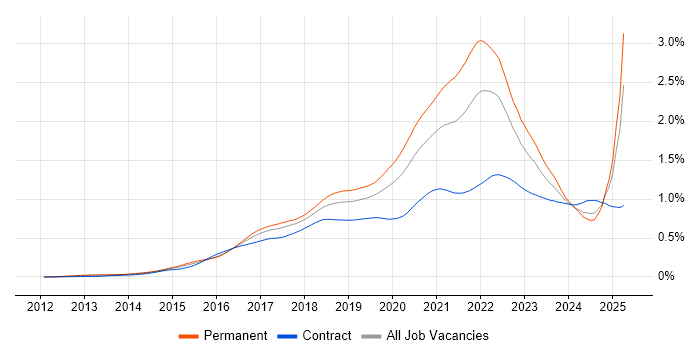
Job vacancy trend for Go in the UK

Go
Salary Trend

3-month moving average salary quoted in jobs citing Go.

Salary trend for Go in the UK

Go
Salary Histogram

Salary distribution for jobs citing Go over the 6 months to 10 December 2023.

Salary histogram for Go in the UK

Go
Top 17 Job Locations

The table below looks at the demand and provides a guide to the median salaries quoted in IT jobs citing Go within the UK over the 6 months to 10 December 2023. The 'Rank Change' column provides an indication of the change in demand within each location based on the same 6 month period last year.

Location Rank Change
on Same Period
Last Year
Matching
Permanent
IT Job Ads
Median Salary
Past 6 Months
Median Salary
% Change
on Same Period
Last Year
Live
Jobs
England -125 536 £80,000 - 385
UK excluding London -125 329 £70,576 +0.82% 203
Work from Home -136 309 £70,000 -6.67% 218
London -92 253 £100,000 +17.65% 243
North of England -84 87 £69,500 -13.13% 46
North West -27 67 £70,500 -11.88% 30
Midlands +39 48 £60,000 -14.29% 13
South East -16 48 £68,500 +9.60% 82
Scotland -68 45 £60,000 - 22
South West -43 41 £70,576 +12.92% 12
East of England +10 37 £85,000 +36.00% 23
West Midlands +65 25 £68,750 -3.51% 5
East Midlands +15 23 £60,000 -14.29% 8
Yorkshire -20 18 £65,000 -18.75% 13
Northern Ireland -26 13 £75,000 +57.89% 5
Wales -6 10 £55,000 -15.38% 2
North East -26 2 £56,250 -25.00% 3

Go
Co-occurring Skills and Capabilities by Category

The follow tables expand on the table above by listing co-occurrences grouped by category. The same employment type, locality and period is covered with up to 20 co-occurrences shown in each of the following categories:

Application Platforms
1 25 (3.95%) Apache Spark
2 11 (1.74%) SharePoint
3 7 (1.11%) IIS
4 5 (0.79%) Confluence
5 4 (0.63%) nginx
6 2 (0.32%) Apache
6 2 (0.32%) Apache Airflow
6 2 (0.32%) Cloud Foundry
6 2 (0.32%) Luigi
7 1 (0.16%) CMS
7 1 (0.16%) JBoss
7 1 (0.16%) OpenStack
7 1 (0.16%) Oracle Application Server
7 1 (0.16%) Tomcat
Business Applications
1 2 (0.32%) Ripple
2 1 (0.16%) Adobe Campaign
Cloud Services
1 310 (48.97%) AWS
2 247 (39.02%) Azure
3 212 (33.49%) GCP
4 141 (22.27%) Serverless
5 79 (12.48%) GitHub
6 61 (9.64%) OpenShift
7 52 (8.21%) AWS CloudFormation
7 52 (8.21%) Azure DevOps
8 47 (7.42%) GitHub Actions
9 36 (5.69%) Amazon S3
10 30 (4.74%) Cloud Computing
10 30 (4.74%) IaaS
11 28 (4.42%) SaaS
12 27 (4.27%) AWS Lambda
13 25 (3.95%) Amazon ECS
13 25 (3.95%) Amazon SQS
13 25 (3.95%) PaaS
14 20 (3.16%) Amazon EC2
15 16 (2.53%) Azure Monitor
16 11 (1.74%) Miro
Communications & Networking
1 17 (2.69%) Firewall
1 17 (2.69%) Internet
2 13 (2.05%) Network Security
3 11 (1.74%) DNS
4 9 (1.42%) HTTP
5 8 (1.26%) WAN
6 6 (0.95%) Intrusion Detection
7 5 (0.79%) TCP/IP
8 4 (0.63%) SMTP
9 3 (0.47%) Cisco Firepower
9 3 (0.47%) VPN
10 2 (0.32%) Cisco ASA
10 2 (0.32%) Cisco ISE
10 2 (0.32%) HTTPS
10 2 (0.32%) NetScaler
10 2 (0.32%) Reverse Proxy
10 2 (0.32%) Software-Defined Networking
11 1 (0.16%) F5 BIG-IP GTM
11 1 (0.16%) F5 BIG-IP LTM
11 1 (0.16%) Multicast
Database & Business Intelligence
1 102 (16.11%) Relational Database
2 88 (13.90%) Oracle Database
3 87 (13.74%) RDBMS
4 68 (10.74%) PostgreSQL
5 49 (7.74%) Amazon Redshift
6 48 (7.58%) MySQL
7 46 (7.27%) Big Data
8 35 (5.53%) NoSQL
9 31 (4.90%) Hadoop
10 26 (4.11%) MongoDB
11 25 (3.95%) Redis
12 22 (3.48%) BigQuery
13 21 (3.32%) Elasticsearch
14 19 (3.00%) Amazon RDS
14 19 (3.00%) Data Lake
15 16 (2.53%) SQL Server
16 14 (2.21%) Data Warehouse
17 11 (1.74%) Scylla
18 8 (1.26%) Flink
19 7 (1.11%) ArangoDB
Development Applications
1 175 (27.65%) Git
2 111 (17.54%) Jenkins
3 62 (9.79%) GitLab
4 36 (5.69%) JDeveloper
5 25 (3.95%) Sonatype Nexus
6 19 (3.00%) Artifactory
7 14 (2.21%) Maven
8 13 (2.05%) SonarQube
9 12 (1.90%) TeamCity
10 11 (1.74%) JIRA
10 11 (1.74%) Octopus Deploy
11 9 (1.42%) Spinnaker
12 7 (1.11%) Bitbucket
12 7 (1.11%) Gradle
12 7 (1.11%) JUnit
13 5 (0.79%) Atlassian Bamboo
13 5 (0.79%) CircleCI
13 5 (0.79%) Gatling
13 5 (0.79%) LoadRunner
13 5 (0.79%) Oracle Forms
General
1 188 (29.70%) Finance
2 108 (17.06%) Social Skills
3 80 (12.64%) Banking
4 52 (8.21%) Inclusion and Diversity
5 51 (8.06%) Front Office
5 51 (8.06%) Police
6 42 (6.64%) Investment Banking
7 31 (4.90%) Law
7 31 (4.90%) Public Sector
8 23 (3.63%) Analytical Skills
9 14 (2.21%) Financial Institution
9 14 (2.21%) Games
10 13 (2.05%) Marketing
11 8 (1.26%) Retail
12 7 (1.11%) Advertising
12 7 (1.11%) Tech for Good
13 6 (0.95%) Aviation
13 6 (0.95%) French Language
14 5 (0.79%) Legal
15 3 (0.47%) Publishing
Job Titles
1 188 (29.70%) Software Engineer
2 145 (22.91%) DevOps Engineer
3 127 (20.06%) Senior
4 103 (16.27%) Developer
5 87 (13.74%) Ruby Engineer
6 74 (11.69%) AWS Engineer
6 74 (11.69%) Lead
7 67 (10.58%) AWS DevOps
7 67 (10.58%) AWS DevOps Engineer
8 45 (7.11%) Cloud Engineer
9 41 (6.48%) Site Reliability Engineer
10 35 (5.53%) Senior Developer
11 26 (4.11%) Full Stack Developer
11 26 (4.11%) Python Engineer
12 23 (3.63%) Senior Software Engineer
13 19 (3.00%) Backend Developer
13 19 (3.00%) Kubernetes Engineer
13 19 (3.00%) Principal Engineer
13 19 (3.00%) Senior DevOps
14 18 (2.84%) Data Engineer
Libraries, Frameworks & Software Standards
1 172 (27.17%) Node.js
2 122 (19.27%) React
3 71 (11.22%) .NET
4 50 (7.90%) Kafka
5 45 (7.11%) gRPC
6 37 (5.85%) RESTful
7 27 (4.27%) REST
7 27 (4.27%) Web Services
8 25 (3.95%) HTML
9 22 (3.48%) GraphQL
10 20 (3.16%) CSS
11 12 (1.90%) J2EE
11 12 (1.90%) JRuby
11 12 (1.90%) JSON
11 12 (1.90%) OAuth
12 10 (1.58%) HTML5
12 10 (1.58%) Middleware
12 10 (1.58%) Redux
12 10 (1.58%) TensorFlow
12 10 (1.58%) YAML
Miscellaneous
1 60 (9.48%) Distributed Systems
2 59 (9.32%) Algorithms
3 54 (8.53%) Cloud Native
4 41 (6.48%) Public Cloud
5 33 (5.21%) Legacy Code
6 27 (4.27%) Data Structures
6 27 (4.27%) Self-Motivation
7 26 (4.11%) Linux Command Line
8 23 (3.63%) Cyberattack
9 18 (2.84%) Greenfield Project
9 18 (2.84%) Mobile App
10 16 (2.53%) Product Ownership
11 12 (1.90%) Blog
11 12 (1.90%) Tandem
12 9 (1.42%) Distributed Applications
12 9 (1.42%) Legacy Systems
12 9 (1.42%) Management Information System
12 9 (1.42%) PKI
13 8 (1.26%) Blockchain
14 7 (1.11%) Onboarding
Operating Systems
1 127 (20.06%) Linux
2 23 (3.63%) Windows
3 16 (2.53%) Android
4 13 (2.05%) Unix
5 11 (1.74%) VMS
6 7 (1.11%) CentOS
6 7 (1.11%) Ubuntu
7 6 (0.95%) Apple iOS
8 4 (0.63%) Red Hat Enterprise Linux
9 3 (0.47%) Mac OS
10 2 (0.32%) Mac OS X
10 2 (0.32%) Windows 10
11 1 (0.16%) Debian
Processes & Methodologies
1 329 (51.97%) Software Engineering
2 310 (48.97%) DevOps
3 234 (36.97%) CI/CD
4 200 (31.60%) Microservices
5 198 (31.28%) Agile
6 178 (28.12%) Problem-Solving
7 152 (24.01%) Continuous Integration
8 148 (23.38%) Open Source
9 135 (21.33%) Containerisation
10 112 (17.69%) Code Quality
11 106 (16.75%) Design Patterns
12 102 (16.11%) Actionable Insight
13 97 (15.32%) Unit Testing
14 95 (15.01%) Mentoring
15 92 (14.53%) Clean Code
16 82 (12.95%) Site Reliability Engineering
17 77 (12.16%) Machine Learning
18 72 (11.37%) Platform Engineering
19 69 (10.90%) Computer Science
20 63 (9.95%) Infrastructure as Code
Programming Languages
1 459 (72.51%) Python
2 365 (57.66%) Java
3 230 (36.33%) JavaScript
4 193 (30.49%) Bash
5 168 (26.54%) Ruby
6 99 (15.64%) Perl
7 93 (14.69%) C#
8 82 (12.95%) TypeScript
9 75 (11.85%) PowerShell
10 71 (11.22%) SQL
11 67 (10.58%) Rust
12 52 (8.21%) C++
13 50 (7.90%) Kotlin
14 47 (7.42%) Scala
15 22 (3.48%) Groovy
16 21 (3.32%) PHP
17 19 (3.00%) C
18 8 (1.26%) Shell Script
19 5 (0.79%) F#
19 5 (0.79%) Haskell
Qualifications
1 144 (22.75%) Security Cleared
2 105 (16.59%) SC Cleared
3 70 (11.06%) Degree
4 42 (6.64%) Computer Science Degree
5 41 (6.48%) AWS Certification
6 28 (4.42%) DV Cleared
7 26 (4.11%) AWS Certified Developer
8 23 (3.63%) AWS Certified Cloud Practitioner
8 23 (3.63%) AWS Certified Solutions Architect
9 17 (2.69%) BPSS Clearance
10 6 (0.95%) Master's Degree
11 3 (0.47%) Azure Certification
12 2 (0.32%) CCNP
12 2 (0.32%) CCSE
12 2 (0.32%) CHECK Team Leader
12 2 (0.32%) CHECK Team Member
12 2 (0.32%) CREST Certified
12 2 (0.32%) GSEC
12 2 (0.32%) OSCP
12 2 (0.32%) SANS
Quality Assurance & Compliance
1 113 (17.85%) QA
2 8 (1.26%) Accessibility
3 7 (1.11%) NCSC
4 6 (0.95%) NIST
5 4 (0.63%) ISO/IEC 27001
6 3 (0.47%) SLA
7 2 (0.32%) GDPR
7 2 (0.32%) PCI DSS
7 2 (0.32%) WCAG
8 1 (0.16%) Data Quality
8 1 (0.16%) ISO 22301
System Software
1 197 (31.12%) Docker
2 15 (2.37%) Virtual Machines
3 7 (1.11%) VMware NSX
4 4 (0.63%) Ceph
4 4 (0.63%) VMware Infrastructure
5 3 (0.47%) Citrix Hypervisor
5 3 (0.47%) LXC
6 1 (0.16%) Firmware
6 1 (0.16%) iptables
6 1 (0.16%) OpenAM
6 1 (0.16%) Oracle RAC
6 1 (0.16%) vSphere
Systems Management
1 327 (51.66%) Kubernetes
2 166 (26.22%) Terraform
3 56 (8.85%) Ansible
4 40 (6.32%) Rancher
5 36 (5.69%) Argo
6 33 (5.21%) Progress Chef
6 33 (5.21%) Puppet
7 24 (3.79%) Grafana
8 23 (3.63%) Prometheus
9 11 (1.74%) Istio
10 4 (0.63%) Nagios
10 4 (0.63%) Single Sign-On
11 3 (0.47%) Cacti
11 3 (0.47%) Consul
11 3 (0.47%) Salt
11 3 (0.47%) ZABBIX
12 2 (0.32%) Kustomize
12 2 (0.32%) Packer
13 1 (0.16%) Fortio
13 1 (0.16%) Kiali
Vendors
1 93 (14.69%) Oracle
2 67 (10.58%) Google
3 31 (4.90%) Microsoft
4 22 (3.48%) Splunk
5 13 (2.05%) VMware
6 12 (1.90%) Dell
7 6 (0.95%) Red Hat
8 5 (0.79%) Atlassian
8 5 (0.79%) Dynatrace
8 5 (0.79%) Teradata
9 4 (0.63%) Cisco
9 4 (0.63%) Databricks
9 4 (0.63%) ServiceNow
10 3 (0.47%) CheckPoint
10 3 (0.47%) F5
10 3 (0.47%) Okta
11 2 (0.32%) Fortinet
11 2 (0.32%) OpenAI
11 2 (0.32%) Palo Alto
11 2 (0.32%) Zscaler