Hedge fund
UK

The table below looks at the prevalence of the term Hedge funds in permanent job vacancies. Included is a benchmarking guide to the salaries offered in vacancies that have cited Hedge funds over the 6 months to 7 December 2023 with a comparison to the same period over the previous 2 years.

6 months to
7 Dec 2023
Same period 2022 Same period 2021
Rank 352 373 390
Rank change year-on-year +21 +17 -173
Permanent jobs citing Hedge funds 444 1,098 1,108
As % of all permanent jobs advertised in the UK 0.84% 0.89% 0.86%
As % of the Miscellaneous category 2.28% 2.08% 1.97%
Number of salaries quoted 367 990 964
10th Percentile £56,500 £58,750 £55,000
25th Percentile £83,750 £77,500 £78,438
Median annual salary (50th Percentile) £112,500 £105,000 £100,000
Median % change year-on-year +7.14% +5.00% -6.98%
75th Percentile £146,250 £136,250 £132,500
90th Percentile £170,000 £187,500 £143,750
UK excluding London median annual salary £45,000 £71,250 £62,500
% change year-on-year -36.84% +14.00% +56.25%

All Generic Skills
UK

Hedge funds is in the General and Transferable Skills category. The following table is for comparison with the above and provides summary statistics for all permanent job vacancies with a requirement for generic IT skills.

Permanent vacancies with a requirement for generic IT skills 19,511 52,884 56,385
As % of all permanent jobs advertised in the UK 36.83% 43.05% 44.00%
Number of salaries quoted 14,245 29,698 33,809
10th Percentile £33,000 £35,000 £33,750
25th Percentile £45,000 £46,250 £45,000
Median annual salary (50th Percentile) £62,500 £64,750 £60,000
Median % change year-on-year -3.47% +7.92% -
75th Percentile £83,750 £85,000 £82,500
90th Percentile £107,500 £106,000 £100,000
UK excluding London median annual salary £55,000 £55,000 £50,000
% change year-on-year - +10.00% -

Hedge funds
Job Vacancy Trend

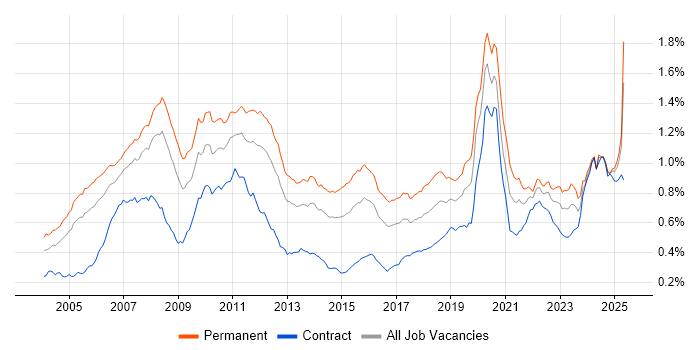
Job postings citing Hedge funds as a proportion of all IT jobs advertised.

Job vacancy trend for Hedge funds in the UK

Hedge funds
Salary Trend

3-month moving average salary quoted in jobs citing Hedge funds.

Salary trend for Hedge funds in the UK

Hedge funds
Salary Histogram

Salary distribution for jobs citing Hedge funds over the 6 months to 7 December 2023.

Salary histogram for Hedge funds in the UK

Hedge funds
Top 5 Job Locations

The table below looks at the demand and provides a guide to the median salaries quoted in IT jobs citing Hedge funds within the UK over the 6 months to 7 December 2023. The 'Rank Change' column provides an indication of the change in demand within each location based on the same 6 month period last year.

Location Rank Change
on Same Period
Last Year
Matching
Permanent
IT Job Ads
Median Salary
Past 6 Months
Median Salary
% Change
on Same Period
Last Year
Live
Jobs
England +32 441 £112,500 +2.27% 384
London +33 423 £115,000 +4.55% 347
Work from Home -15 109 £110,000 +2.33% 122
UK excluding London +208 16 £45,000 -36.84% 76
South East +148 16 £45,000 +5.88% 52

Hedge funds
Co-occurring Skills and Capabilities by Category

The follow tables expand on the table above by listing co-occurrences grouped by category. The same employment type, locality and period is covered with up to 20 co-occurrences shown in each of the following categories:

Application Platforms
1 20 (4.50%) Apache Airflow
2 12 (2.70%) Apache
3 8 (1.80%) Apache Spark
4 7 (1.58%) MS Exchange
5 5 (1.13%) Confluence
5 5 (1.13%) SharePoint
6 4 (0.90%) Luigi
7 1 (0.23%) Ethereum
7 1 (0.23%) Hyperledger
7 1 (0.23%) Jupyter
7 1 (0.23%) Skype for Business
Applications
1 8 (1.80%) Microsoft Excel
1 8 (1.80%) Microsoft Office
2 7 (1.58%) Spreadsheet
3 2 (0.45%) MS Visio
4 1 (0.23%) Microsoft PowerPoint
4 1 (0.23%) Microsoft Project
Business Applications
1 5 (1.13%) Adaptiv
2 4 (0.90%) Fidessa
2 4 (0.90%) Front Arena
3 2 (0.45%) Aladdin
3 2 (0.45%) thinkFolio
4 1 (0.23%) R3 Corda
Cloud Services
1 161 (36.26%) AWS
2 126 (28.38%) Azure
3 109 (24.55%) GCP
4 18 (4.05%) Microsoft 365
5 15 (3.38%) GitHub
6 8 (1.80%) SaaS
7 5 (1.13%) Snowflake
8 4 (0.90%) GitHub Actions
9 2 (0.45%) Amazon S3
9 2 (0.45%) AWS CloudFormation
9 2 (0.45%) dbt
9 2 (0.45%) OpenShift
10 1 (0.23%) Amazon CloudWatch
10 1 (0.23%) Amazon EC2
10 1 (0.23%) Amazon EKS
10 1 (0.23%) ChatGPT
10 1 (0.23%) Cloud Computing
10 1 (0.23%) Datadog
10 1 (0.23%) Power Platform
10 1 (0.23%) WhatsApp
Communications & Networking
1 16 (3.60%) VPN
2 11 (2.48%) DNS
3 10 (2.25%) TCP/IP
4 9 (2.03%) DHCP
4 9 (2.03%) Network Security
5 8 (1.80%) WAN
6 7 (1.58%) Cisco IOS
6 7 (1.58%) Firewall
7 6 (1.35%) Cisco Firepower
7 6 (1.35%) Cisco ISE
7 6 (1.35%) SD-WAN
8 5 (1.13%) Wireless
9 4 (0.90%) 3G
9 4 (0.90%) Internet
9 4 (0.90%) Wi-Fi
10 3 (0.68%) PBX
10 3 (0.68%) Unified Communications
11 2 (0.45%) tcpdump
11 2 (0.45%) VPLS
11 2 (0.45%) Wireshark
Database & Business Intelligence
1 24 (5.41%) SQL Server
2 11 (2.48%) Big Data
3 10 (2.25%) Tick Data
4 9 (2.03%) NoSQL
5 8 (1.80%) MongoDB
6 7 (1.58%) SQL Server Reporting Services
7 6 (1.35%) MySQL
7 6 (1.35%) PostgreSQL
7 6 (1.35%) SQL Server Integration Services
8 5 (1.13%) Relational Database
9 4 (0.90%) Amazon RDS
9 4 (0.90%) KDB
9 4 (0.90%) Kdb+
10 3 (0.68%) Data Warehouse
10 3 (0.68%) Dremio
10 3 (0.68%) Flink
11 2 (0.45%) Amazon Redshift
11 2 (0.45%) Apache Arrow
11 2 (0.45%) BigQuery
11 2 (0.45%) Tableau
Development Applications
1 15 (3.38%) Git
2 10 (2.25%) JIRA
3 7 (1.58%) Cucumber
4 6 (1.35%) Jenkins
4 6 (1.35%) SpecFlow
5 5 (1.13%) Selenium
6 4 (0.90%) GitLab
6 4 (0.90%) Subversion
7 3 (0.68%) Gatling
7 3 (0.68%) Sonatype Nexus
8 2 (0.45%) Bitbucket
8 2 (0.45%) Octopus Deploy
9 1 (0.23%) Artifactory
9 1 (0.23%) Flyway
9 1 (0.23%) Liquibase
9 1 (0.23%) Mocha
9 1 (0.23%) SonarQube
General
1 282 (63.51%) Finance
2 179 (40.32%) Front Office
3 71 (15.99%) Social Skills
4 61 (13.74%) Banking
5 38 (8.56%) Analytical Skills
6 31 (6.98%) Back Office
7 29 (6.53%) Financial Institution
8 21 (4.73%) Investment Banking
9 13 (2.93%) Marketing
10 6 (1.35%) Billing
10 6 (1.35%) Legal
11 5 (1.13%) Organisational Skills
11 5 (1.13%) Presentation Skills
12 3 (0.68%) Telecoms
13 1 (0.23%) Private Banking
13 1 (0.23%) Publishing
Job Titles
1 216 (48.65%) Developer
2 94 (21.17%) Software Engineer
3 87 (19.59%) Developer/Software Engineer
4 82 (18.47%) .NET Developer
5 77 (17.34%) .NET Software Developer
5 77 (17.34%) .NET Software Engineer
6 61 (13.74%) Analyst
7 58 (13.06%) Finance Manager
8 55 (12.39%) Python Developer
9 54 (12.16%) Senior
10 41 (9.23%) Quantitative Developer
11 40 (9.01%) Software Asset Manager
11 40 (9.01%) Software Manager
12 38 (8.56%) Lead
13 33 (7.43%) Business Analyst
14 30 (6.76%) Full Stack Developer
15 29 (6.53%) Lead Developer
15 29 (6.53%) Product Manager
15 29 (6.53%) Product Owner
15 29 (6.53%) React Developer
Libraries, Frameworks & Software Standards
1 111 (25.00%) .NET
2 99 (22.30%) React
3 87 (19.59%) AngularJS
4 85 (19.14%) Redux
5 80 (18.02%) ASP.NET
6 79 (17.79%) ASP.NET Core
7 77 (17.34%) Vue
8 24 (5.41%) OpenFin
9 17 (3.83%) HTML
10 13 (2.93%) CSS
11 11 (2.48%) FIX Protocol
12 10 (2.25%) Kafka
12 10 (2.25%) Node.js
12 10 (2.25%) Pandas
13 9 (2.03%) RESTful
14 8 (1.80%) .NET Core
14 8 (1.80%) Spring
15 7 (1.58%) JSON
15 7 (1.58%) XML
16 6 (1.35%) Django
Miscellaneous
1 193 (43.47%) Fixed Income
2 166 (37.39%) Foreign Exchange (FX)
3 163 (36.71%) Derivative
4 154 (34.68%) Equities
5 31 (6.98%) Product Ownership
6 24 (5.41%) Greenfield Project
7 19 (4.28%) Distributed Systems
8 15 (3.38%) Management Information System
8 15 (3.38%) Self-Motivation
9 11 (2.48%) Cloud Native
10 9 (2.03%) Credit Risk
11 7 (1.58%) Enterprise Software
11 7 (1.58%) Team-Oriented Environment
12 6 (1.35%) Onboarding
12 6 (1.35%) PKI
12 6 (1.35%) Reference Data
13 5 (1.13%) Algorithms
13 5 (1.13%) Client/Server
13 5 (1.13%) Credit Derivative
14 4 (0.90%) Data Structures
Operating Systems
1 45 (10.14%) Linux
2 40 (9.01%) Windows
3 30 (6.76%) Apple iOS
4 16 (3.60%) Windows Server
5 14 (3.15%) Windows 10
6 11 (2.48%) Unix
7 7 (1.58%) Android
7 7 (1.58%) Mac OS
8 6 (1.35%) Windows 7
9 4 (0.90%) Windows Server 2012
10 2 (0.45%) Solaris
10 2 (0.45%) VMS
10 2 (0.45%) Windows Server 2008
Processes & Methodologies
1 171 (38.51%) Investment Management
2 168 (37.84%) Asset Management
3 156 (35.14%) Agile
4 134 (30.18%) Software Engineering
5 99 (22.30%) Fintech
6 98 (22.07%) DevOps
7 87 (19.59%) Full Stack Development
8 82 (18.47%) TDD
9 68 (15.32%) Analytics
10 64 (14.41%) Computer Science
11 58 (13.06%) Problem-Solving
12 47 (10.59%) Order Management
13 43 (9.68%) Low Latency
14 39 (8.78%) Machine Learning
15 37 (8.33%) Microservices
16 36 (8.11%) Mathematics
17 34 (7.66%) Artificial Intelligence
18 32 (7.21%) Portfolio Management
18 32 (7.21%) Quantitative Research
19 30 (6.76%) Roadmaps
Programming Languages
1 175 (39.41%) Python
2 153 (34.46%) C#
3 97 (21.85%) TypeScript
4 92 (20.72%) SQL
5 86 (19.37%) JavaScript
6 63 (14.19%) C++
7 47 (10.59%) Java
8 31 (6.98%) PowerShell
9 16 (3.60%) R
9 16 (3.60%) Rust
10 13 (2.93%) Bash
11 12 (2.70%) MATLAB
12 7 (1.58%) VB
13 4 (0.90%) Ruby
14 3 (0.68%) C
14 3 (0.68%) Go
14 3 (0.68%) Scala
15 2 (0.45%) Kotlin
15 2 (0.45%) Shell Script
16 1 (0.23%) T-SQL
Qualifications
1 76 (17.12%) Degree
2 31 (6.98%) Master's Degree
3 29 (6.53%) Computer Science Degree
4 13 (2.93%) PhD
5 11 (2.48%) Cisco Certification
6 6 (1.35%) AWS Certification
7 5 (1.13%) CCNA
8 4 (0.90%) CCIE
9 3 (0.68%) AWS Certified Solutions Architect
9 3 (0.68%) CCNP
10 1 (0.23%) CFA
10 1 (0.23%) GCFA
10 1 (0.23%) GCIH
10 1 (0.23%) OSCP
Quality Assurance & Compliance
1 80 (18.02%) QA
2 10 (2.25%) SLA
3 2 (0.45%) ISO/IEC 27001
3 2 (0.45%) NIST
4 1 (0.23%) Accessibility
4 1 (0.23%) Data Quality
4 1 (0.23%) GDPR
4 1 (0.23%) SOC 1
System Software
1 32 (7.21%) Active Directory
2 30 (6.76%) Docker
3 7 (1.58%) VMware Infrastructure
4 4 (0.90%) Hyper-V
5 2 (0.45%) Slurm Workload Manager
5 2 (0.45%) Virtual Desktop
6 1 (0.23%) BitLocker
6 1 (0.23%) Ceph
6 1 (0.23%) GFS2
6 1 (0.23%) GPFS
6 1 (0.23%) Virtual Machines
6 1 (0.23%) VMware ESXi
Systems Management
1 44 (9.91%) Kubernetes
2 15 (3.38%) Terraform
3 11 (2.48%) Ansible
4 9 (2.03%) Microsoft Intune
5 8 (1.80%) Control-M
6 7 (1.58%) Cisco CUCM
7 6 (1.35%) SCCM
7 6 (1.35%) Stealthwatch
8 5 (1.13%) Grafana
8 5 (1.13%) Oracle Enterprise Manager
8 5 (1.13%) Prometheus
8 5 (1.13%) SafeCom
9 4 (0.90%) Progress Chef
9 4 (0.90%) ZABBIX
10 2 (0.45%) BMC PATROL
10 2 (0.45%) EMC NetWorker
10 2 (0.45%) NetBackup
11 1 (0.23%) Puppet
11 1 (0.23%) Rancher
Vendors
1 28 (6.31%) Microsoft
2 24 (5.41%) Finsemble
3 22 (4.95%) Bloomberg
4 15 (3.38%) Cisco
5 12 (2.70%) Oracle
6 8 (1.80%) Charles River
6 8 (1.80%) VMware
7 7 (1.58%) SolarWinds
7 7 (1.58%) Splunk
8 6 (1.35%) Atlassian
8 6 (1.35%) Reuters
8 6 (1.35%) ServiceNow
9 5 (1.13%) HubSpot
9 5 (1.13%) Veritas
10 4 (0.90%) Palo Alto
11 3 (0.68%) Salesforce
12 2 (0.45%) Citrix
12 2 (0.45%) Juniper
12 2 (0.45%) Vertica
12 2 (0.45%) Wallstreet Suite