Systems or Software Development Life Cycle (SDLC)
UK

The following table provides summary statistics for permanent job vacancies with a requirement for SDLC skills. Included is a benchmarking guide to the salaries offered in vacancies that have cited SDLC over the 6 months to 7 December 2023 with a comparison to the same period in the previous 2 years.

6 months to
7 Dec 2023
Same period 2022 Same period 2021
Rank 70 55 62
Rank change year-on-year -15 +7 +19
Permanent jobs citing SDLC 2,200 6,731 6,295
As % of all permanent jobs advertised in the UK 4.15% 5.48% 4.91%
As % of the Processes & Methodologies category 4.41% 5.72% 5.15%
Number of salaries quoted 1,449 3,725 4,013
10th Percentile £42,500 £41,227 £38,750
25th Percentile £52,500 £49,150 £45,000
Median annual salary (50th Percentile) £65,000 £65,000 £60,000
Median % change year-on-year - +8.33% +4.35%
75th Percentile £82,500 £83,750 £81,250
90th Percentile £97,500 £100,301 £97,500
UK excluding London median annual salary £60,000 £56,456 £50,000
% change year-on-year +6.28% +12.91% -

All Process and Methodology Skills
UK

SDLC is in the Processes and Methodologies category. The following table is for comparison with the above and provides summary statistics for all permanent job vacancies with a requirement for process or methodology skills.

Permanent vacancies with a requirement for process or methodology skills 49,863 117,613 122,319
As % of all permanent jobs advertised in the UK 94.11% 95.75% 95.45%
Number of salaries quoted 36,022 72,003 82,155
10th Percentile £32,500 £34,700 £32,500
25th Percentile £43,750 £45,000 £42,500
Median annual salary (50th Percentile) £60,000 £61,000 £60,000
Median % change year-on-year -1.64% +1.67% +9.09%
75th Percentile £80,000 £82,500 £77,500
90th Percentile £99,680 £100,000 £95,000
UK excluding London median annual salary £52,500 £53,500 £50,000
% change year-on-year -1.87% +7.00% +4.17%

SDLC
Job Vacancy Trend

Job postings citing SDLC as a proportion of all IT jobs advertised.
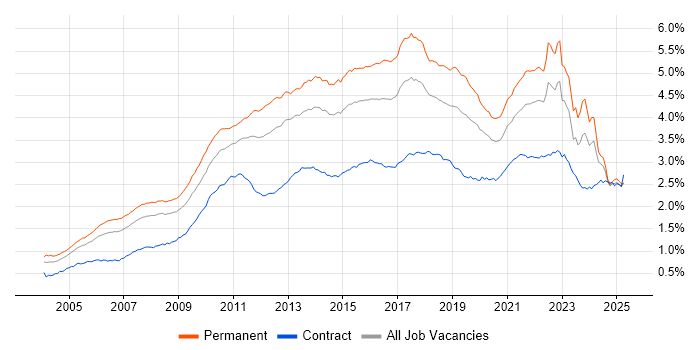
Job vacancy trend for SDLC in the UK

SDLC
Salary Trend

3-month moving average salary quoted in jobs citing SDLC.

Salary trend for SDLC in the UK

SDLC
Salary Histogram

Salary distribution for jobs citing SDLC over the 6 months to 7 December 2023.

Salary histogram for SDLC in the UK

SDLC
Top 17 Job Locations

The table below looks at the demand and provides a guide to the median salaries quoted in IT jobs citing SDLC within the UK over the 6 months to 7 December 2023. The 'Rank Change' column provides an indication of the change in demand within each location based on the same 6 month period last year.

Location Rank Change
on Same Period
Last Year
Matching
Permanent
IT Job Ads
Median Salary
Past 6 Months
Median Salary
% Change
on Same Period
Last Year
Live
Jobs
England -17 1,782 £65,000 - 738
UK excluding London -14 1,339 £60,000 +6.28% 501
Work from Home -3 1,015 £69,447 +11.12% 444
London -16 726 £75,000 - 344
North of England -35 293 £60,000 +9.09% 135
Scotland +9 263 £70,000 +3.70% 33
South West -1 261 £60,000 +10.09% 58
South East -20 237 £60,000 +4.35% 150
Midlands -22 188 £57,500 +9.52% 75
North West -33 160 £60,000 +14.29% 91
Yorkshire -16 119 £60,000 - 29
West Midlands -23 118 £57,500 +9.52% 64
East Midlands -1 73 £57,500 +9.52% 11
East of England -8 51 £57,500 -4.17% 31
Wales +4 39 £55,000 -8.33% 14
Northern Ireland +38 27 £55,000 +22.22% 14
North East +35 14 £60,000 +20.00% 16

SDLC
Co-occurring Skills and Capabilities by Category

The follow tables expand on the table above by listing co-occurrences grouped by category. The same employment type, locality and period is covered with up to 20 co-occurrences shown in each of the following categories:

Application Platforms
1 89 (4.05%) Confluence
2 55 (2.50%) Apache Spark
3 40 (1.82%) SharePoint
4 29 (1.32%) Apache
5 13 (0.59%) nginx
6 12 (0.55%) CMS
7 11 (0.50%) IIS
7 11 (0.50%) NServiceBus
8 9 (0.41%) Apache Airflow
8 9 (0.41%) OpenEdge
9 7 (0.32%) IBM HTTP Server
9 7 (0.32%) Tomcat
10 5 (0.23%) WebSphere
11 4 (0.18%) Camunda
11 4 (0.18%) WinCC
11 4 (0.18%) WordPress
12 3 (0.14%) Apache Pig
12 3 (0.14%) SAS
12 3 (0.14%) WebLogic
13 2 (0.091%) JBoss
Applications
1 48 (2.18%) Microsoft Office
2 42 (1.91%) Microsoft Excel
3 29 (1.32%) Microsoft Project
4 19 (0.86%) MS Visio
5 16 (0.73%) Microsoft PowerPoint
6 8 (0.36%) Windchill
7 7 (0.32%) Simulink
8 6 (0.27%) Adobe XD
8 6 (0.27%) Sketch
9 4 (0.18%) UserZoom
10 1 (0.045%) SPSS
Business Applications
1 71 (3.23%) Endur
2 22 (1.00%) Dynamics CRM
3 6 (0.27%) Dynamics NAV
4 5 (0.23%) OpenLink RightAngle
5 4 (0.18%) Shopify
6 3 (0.14%) Dynamics GP
7 2 (0.091%) Magento
7 2 (0.091%) NetSuite
7 2 (0.091%) Oracle Cash Management
7 2 (0.091%) Payment Gateway
7 2 (0.091%) Ripple
7 2 (0.091%) Temenos T24
8 1 (0.045%) CiviCRM
8 1 (0.045%) Dynamics AX
8 1 (0.045%) Elite 3E
8 1 (0.045%) ION Anvil
8 1 (0.045%) Misys Midas
8 1 (0.045%) Salesforce CRM
Cloud Services
1 492 (22.36%) Azure
2 392 (17.82%) AWS
3 160 (7.27%) SaaS
4 155 (7.05%) Azure DevOps
5 109 (4.95%) GCP
6 104 (4.73%) Serverless
7 79 (3.59%) Power Platform
8 76 (3.45%) GitHub
9 62 (2.82%) IaaS
10 60 (2.73%) PaaS
11 53 (2.41%) Cloud Computing
12 52 (2.36%) AWS Lambda
13 49 (2.23%) AWS CloudFormation
14 43 (1.95%) Microsoft 365
15 37 (1.68%) Dynamics 365
16 30 (1.36%) PowerApps
17 29 (1.32%) Amazon SQS
18 28 (1.27%) Azure Logic Apps
18 28 (1.27%) BlazeMeter
19 25 (1.14%) Azure Service Bus
Communications & Networking
1 60 (2.73%) Internet
2 47 (2.14%) HTTP
3 46 (2.09%) TCP/IP
4 45 (2.05%) DNS
5 33 (1.50%) Network Security
6 31 (1.41%) DHCP
7 28 (1.27%) VPN
8 23 (1.05%) AMQP
8 23 (1.05%) NGFW
9 22 (1.00%) WAN
10 19 (0.86%) 5G
11 17 (0.77%) SD-WAN
12 12 (0.55%) BGP
12 12 (0.55%) IOS XR
12 12 (0.55%) MPLS
13 9 (0.41%) Wireshark
14 5 (0.23%) ATM
14 5 (0.23%) LAN
14 5 (0.23%) SAN
15 4 (0.18%) SMTP
Database & Business Intelligence
1 268 (12.18%) SQL Server
2 157 (7.14%) Relational Database
3 98 (4.45%) NoSQL
4 96 (4.36%) RDBMS
5 92 (4.18%) Big Data
6 69 (3.14%) MongoDB
7 53 (2.41%) Power BI
8 42 (1.91%) Oracle Database
9 35 (1.59%) Hadoop
10 32 (1.45%) MySQL
11 29 (1.32%) PostgreSQL
12 28 (1.27%) Data Warehouse
12 28 (1.27%) SQL Server Integration Services
13 27 (1.23%) Apache Hive
14 23 (1.05%) Oracle Database 10g
15 22 (1.00%) Azure SQL Database
15 22 (1.00%) Redis
16 20 (0.91%) Oracle Database 11g
17 18 (0.82%) DynamoDB
18 16 (0.73%) Elasticsearch
Development Applications
1 200 (9.09%) Git
2 158 (7.18%) Jenkins
3 157 (7.14%) JIRA
4 70 (3.18%) Selenium
5 52 (2.36%) Visual Studio
6 49 (2.23%) Cucumber
7 41 (1.86%) Maven
8 39 (1.77%) JUnit
9 38 (1.73%) GitLab
9 38 (1.73%) Postman
10 30 (1.36%) Cypress.io
11 28 (1.27%) SonarQube
11 28 (1.27%) SpecFlow
12 27 (1.23%) eggPlant
13 24 (1.09%) SoapUI
14 23 (1.05%) Bitbucket
14 23 (1.05%) JMeter
14 23 (1.05%) REST Assured
15 20 (0.91%) LoadRunner
16 19 (0.86%) The Grinder
General
1 747 (33.95%) Finance
2 545 (24.77%) Social Skills
3 288 (13.09%) Inclusion and Diversity
4 247 (11.23%) Banking
5 202 (9.18%) Law
6 184 (8.36%) Analytical Skills
7 163 (7.41%) Marketing
8 132 (6.00%) Legal
9 83 (3.77%) Games
10 77 (3.50%) Aerospace
11 76 (3.45%) Retail
12 68 (3.09%) Financial Institution
13 60 (2.73%) Public Sector
14 59 (2.68%) Organisational Skills
15 39 (1.77%) Manufacturing
16 38 (1.73%) Influencing Skills
17 35 (1.59%) Electronics
18 30 (1.36%) Presentation Skills
19 29 (1.32%) Investment Banking
20 28 (1.27%) Telecoms
Job Titles
1 455 (20.68%) Developer
2 444 (20.18%) Senior
3 392 (17.82%) Software Engineer
4 268 (12.18%) Project Manager
5 247 (11.23%) Lead
6 217 (9.86%) Architect
7 186 (8.45%) Analyst
8 153 (6.95%) Senior Manager
9 132 (6.00%) Senior Project Manager
10 116 (5.27%) Business Analyst
11 113 (5.14%) DevOps Engineer
12 97 (4.41%) Java Developer
13 93 (4.23%) Senior Developer
14 88 (4.00%) Java Engineer
15 85 (3.86%) Java Software Engineer
16 79 (3.59%) .NET Developer
17 72 (3.27%) Senior Software Engineer
18 71 (3.23%) Software Developer
19 70 (3.18%) Python Engineer
20 68 (3.09%) Solutions Architect
Libraries, Frameworks & Software Standards
1 331 (15.05%) .NET
2 247 (11.23%) HTML
3 210 (9.55%) React
4 190 (8.64%) AngularJS
5 167 (7.59%) CSS
6 150 (6.82%) Spring
7 134 (6.09%) REST
8 119 (5.41%) Spring Boot
9 115 (5.23%) ASP.NET
10 113 (5.14%) Kafka
11 98 (4.45%) RESTful
12 83 (3.77%) JSON
13 75 (3.41%) RabbitMQ
14 72 (3.27%) Node.js
15 71 (3.23%) .NET Framework
15 71 (3.23%) Web Services
16 70 (3.18%) XML
17 59 (2.68%) YAML
18 52 (2.36%) .NET Core
19 50 (2.27%) HTML5
Miscellaneous
1 196 (8.91%) Management Information System
2 194 (8.82%) Virtual Team
3 110 (5.00%) Cloud Native
4 95 (4.32%) Product Ownership
5 84 (3.82%) Public Cloud
6 74 (3.36%) Self-Motivation
7 70 (3.18%) Swaptions
8 59 (2.68%) Algorithms
9 57 (2.59%) Greenfield Project
10 54 (2.45%) Mobile App
11 43 (1.95%) Private Cloud
12 37 (1.68%) Cyberattack
13 35 (1.59%) Distributed Systems
14 33 (1.50%) Robotics
15 30 (1.36%) Distributed Applications
16 26 (1.18%) Onboarding
17 25 (1.14%) Enterprise Software
18 22 (1.00%) Data Structures
19 21 (0.95%) Blockchain
20 20 (0.91%) Legacy Systems
Operating Systems
1 158 (7.18%) Linux
2 78 (3.55%) Windows
3 55 (2.50%) Unix
4 17 (0.77%) Windows Server
5 12 (0.55%) Android
6 10 (0.45%) Apple iOS
7 8 (0.36%) Solaris
8 5 (0.23%) Windows 7
8 5 (0.23%) Windows Server 2008
8 5 (0.23%) Windows XP
9 4 (0.18%) Mac OS X
10 3 (0.14%) Debian
10 3 (0.14%) FreeRTOS
10 3 (0.14%) Windows Server 2016
10 3 (0.14%) Windows Server 2019
10 3 (0.14%) zOS
11 2 (0.091%) Red Hat Enterprise Linux
12 1 (0.045%) Embedded Linux
12 1 (0.045%) Mac OS
12 1 (0.045%) VxWorks
Processes & Methodologies
1 1,362 (61.91%) Agile
2 623 (28.32%) Software Engineering
3 535 (24.32%) Problem-Solving
4 508 (23.09%) CI/CD
5 505 (22.95%) DevOps
6 422 (19.18%) Project Management
7 386 (17.55%) Scrum
8 351 (15.95%) Project Delivery
9 317 (14.41%) Computer Science
10 314 (14.27%) Microservices
11 262 (11.91%) Test Automation
12 221 (10.05%) Mentoring
13 214 (9.73%) TDD
14 204 (9.27%) Continuous Improvement
15 200 (9.09%) Design Patterns
16 187 (8.50%) OO
17 182 (8.27%) Actionable Insight
18 180 (8.18%) Full Stack Development
19 174 (7.91%) Roadmaps
20 173 (7.86%) Infrastructure as Code
Programming Languages
1 628 (28.55%) Java
2 408 (18.55%) C#
3 406 (18.45%) SQL
4 403 (18.32%) Python
5 386 (17.55%) JavaScript
6 117 (5.32%) PowerShell
7 104 (4.73%) C++
8 99 (4.50%) TypeScript
9 80 (3.64%) Bash
10 78 (3.55%) VB
11 63 (2.86%) C
12 46 (2.09%) Scala
13 31 (1.41%) T-SQL
14 30 (1.36%) PHP
15 29 (1.32%) Go
16 23 (1.05%) Perl
17 22 (1.00%) Groovy
17 22 (1.00%) Shell Script
18 19 (0.86%) PL/SQL
19 15 (0.68%) Ruby
Qualifications
1 406 (18.45%) Degree
2 230 (10.45%) Computer Science Degree
3 223 (10.14%) Security Cleared
4 121 (5.50%) SC Cleared
5 49 (2.23%) DV Cleared
6 40 (1.82%) ISTQB
6 40 (1.82%) Master's Degree
7 36 (1.64%) AWS Certification
8 34 (1.55%) AWS Certified Solutions Architect
9 23 (1.05%) PMI Certification
10 22 (1.00%) CISSP
11 21 (0.95%) ISEB
12 19 (0.86%) BPSS Clearance
13 16 (0.73%) Microsoft Certification
13 16 (0.73%) PMP
14 15 (0.68%) ISSAP
14 15 (0.68%) TOGAF Certification
15 13 (0.59%) CISM
16 11 (0.50%) Azure Certification
17 10 (0.45%) PhD
Quality Assurance & Compliance
1 188 (8.55%) QA
2 37 (1.68%) PMO
3 28 (1.27%) SEPA
4 26 (1.18%) ISO/IEC 27001
5 24 (1.09%) Accessibility
6 21 (0.95%) Data Quality
7 19 (0.86%) SLA
8 16 (0.73%) IEC 61508
9 15 (0.68%) ISO 20022
10 13 (0.59%) NIST
11 11 (0.50%) ISO 9001
12 8 (0.36%) ISO/IEC 15288
13 7 (0.32%) Actionable Recommendations
14 6 (0.27%) ARP4754
14 6 (0.27%) ARP4761
14 6 (0.27%) Cyber Essentials
14 6 (0.27%) GDPR
14 6 (0.27%) Software Quality Assurance
15 5 (0.23%) PCI DSS
15 5 (0.23%) SOC 2
System Software
1 242 (11.00%) Docker
2 34 (1.55%) VMware Infrastructure
3 29 (1.32%) Active Directory
4 28 (1.27%) Virtual Desktop
5 27 (1.23%) vSphere
6 23 (1.05%) VMware ESXi
7 14 (0.64%) Firmware
8 13 (0.59%) HDFS
9 5 (0.23%) Virtual Machines
10 3 (0.14%) Embedded Firmware
10 3 (0.14%) Time Sharing Option
11 2 (0.091%) Ceph
11 2 (0.091%) GPFS
11 2 (0.091%) IAG
11 2 (0.091%) Lustre
12 1 (0.045%) Apache ZooKeeper
12 1 (0.045%) Hyper-V
12 1 (0.045%) Virtual Servers
Systems Management
1 227 (10.32%) Kubernetes
2 177 (8.05%) Terraform
3 72 (3.27%) Ansible
4 31 (1.41%) Grafana
5 27 (1.23%) Puppet
6 21 (0.95%) HP Quality Center
7 19 (0.86%) Prometheus
8 12 (0.55%) Progress Chef
9 8 (0.36%) Istio
9 8 (0.36%) Packer
10 6 (0.27%) Control-M
11 5 (0.23%) HP ALM
11 5 (0.23%) Kibana
11 5 (0.23%) WSUS
12 4 (0.18%) Fortio
12 4 (0.18%) Kiali
12 4 (0.18%) SCCM
12 4 (0.18%) vRealize
12 4 (0.18%) vRealize Orchestrator
12 4 (0.18%) Wonderware InTouch
Vendors
1 231 (10.50%) Microsoft
2 163 (7.41%) Oracle
3 152 (6.91%) Salesforce
4 108 (4.91%) NEC
5 77 (3.50%) Sybase
6 72 (3.27%) TIBCO
7 70 (3.18%) OpenLink
8 63 (2.86%) Google
9 41 (1.86%) Citrix
10 40 (1.82%) SAP
11 39 (1.77%) VMware
12 28 (1.27%) IBM
13 26 (1.18%) Databricks
14 23 (1.05%) Atlassian
14 23 (1.05%) HP
15 19 (0.86%) Splunk
16 14 (0.64%) Veracode
17 13 (0.59%) Xamarin
18 12 (0.55%) MKS
19 10 (0.45%) Cloudera