Amazon Relational Database Service (RDS)
UK

The following table provides summary statistics for permanent job vacancies with a requirement for Amazon RDS skills. Included is a benchmarking guide to the salaries offered in vacancies that have cited Amazon RDS over the 6 months to 7 December 2023 with a comparison to the same period in the previous 2 years.

6 months to
7 Dec 2023
Same period 2022 Same period 2021
Rank 392 443 369
Rank change year-on-year +51 -74 +76
Permanent jobs citing Amazon RDS 379 874 1,198
As % of all permanent jobs advertised in the UK 0.72% 0.71% 0.93%
As % of the Database & Business Intelligence category 3.36% 3.06% 3.45%
Number of salaries quoted 340 530 805
10th Percentile £31,238 £36,250 £41,250
25th Percentile £37,500 £52,500 £51,250
Median annual salary (50th Percentile) £57,500 £65,000 £72,500
Median % change year-on-year -11.54% -10.34% +23.93%
75th Percentile £77,500 £85,813 £92,500
90th Percentile £83,875 £108,750 £117,500
UK excluding London median annual salary £55,000 £55,000 £55,000
% change year-on-year - - +24.29%

All Database and Business Intelligence Skills
UK

Amazon RDS is in the Databases and Business Intelligence category. The following table is for comparison with the above and provides summary statistics for all permanent job vacancies with a requirement for database or business intelligence skills.

Permanent vacancies with a requirement for database or business intelligence skills 11,277 28,579 34,744
As % of all permanent jobs advertised in the UK 21.28% 23.27% 27.11%
Number of salaries quoted 8,446 17,544 22,627
10th Percentile £36,750 £36,750 £35,500
25th Percentile £46,580 £46,250 £42,500
Median annual salary (50th Percentile) £60,000 £62,500 £58,500
Median % change year-on-year -4.00% +6.84% +6.36%
75th Percentile £80,000 £82,500 £77,500
90th Percentile £95,000 £100,000 £95,000
UK excluding London median annual salary £55,000 £55,000 £50,000
% change year-on-year - +10.00% +2.04%

Amazon RDS
Job Vacancy Trend

Job postings citing Amazon RDS as a proportion of all IT jobs advertised.
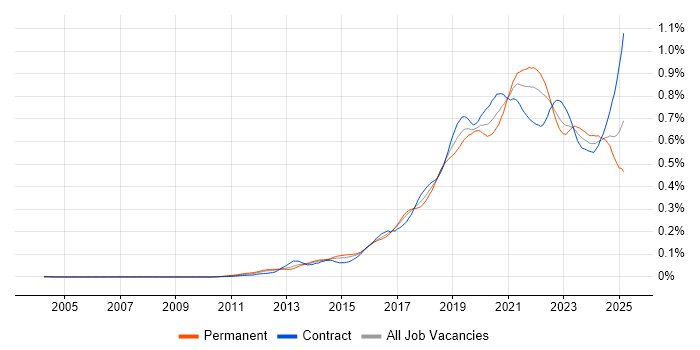
Job vacancy trend for Amazon RDS in the UK

Amazon RDS
Salary Trend

3-month moving average salary quoted in jobs citing Amazon RDS.

Salary trend for Amazon RDS in the UK

Amazon RDS
Salary Histogram

Salary distribution for jobs citing Amazon RDS over the 6 months to 7 December 2023.

Salary histogram for Amazon RDS in the UK

Amazon RDS
Top 17 Job Locations

The table below looks at the demand and provides a guide to the median salaries quoted in IT jobs citing Amazon RDS within the UK over the 6 months to 7 December 2023. The 'Rank Change' column provides an indication of the change in demand within each location based on the same 6 month period last year.

Location Rank Change
on Same Period
Last Year
Matching
Permanent
IT Job Ads
Median Salary
Past 6 Months
Median Salary
% Change
on Same Period
Last Year
Live
Jobs
England +67 339 £57,500 -11.54% 110
UK excluding London +133 243 £55,000 - 81
Work from Home +75 190 £60,000 -7.69% 56
London +22 104 £70,000 -17.65% 39
North of England +91 75 £36,000 -28.00% 31
Yorkshire +110 54 £34,750 -48.52% 13
South West +75 47 £55,000 +82.57% 8
South East +105 44 £47,500 -24.00% 18
Midlands +116 31 £45,000 -30.77% 10
West Midlands +123 23 £35,000 -44.00% 7
Scotland +43 23 £70,000 +50.54% 11
East of England +105 20 £75,000 +30.43% 3
North West +61 18 £57,500 +15.00% 8
East Midlands +41 8 £45,000 -30.77% 3
North East +40 3 £31,500 -37.00% 10
Wales +11 2 £65,000 +13.04%
Northern Ireland +38 1 £47,500 -32.14%

Amazon RDS
Co-occurring Skills and Capabilities by Category

The follow tables expand on the table above by listing co-occurrences grouped by category. The same employment type, locality and period is covered with up to 20 co-occurrences shown in each of the following categories:

Application Platforms
1 17 (4.49%) SharePoint
2 13 (3.43%) MS Exchange
3 10 (2.64%) IIS
4 5 (1.32%) Apache
5 4 (1.06%) Confluence
6 3 (0.79%) nginx
7 2 (0.53%) Exchange Server 2013
7 2 (0.53%) OpenStack
7 2 (0.53%) Oracle Workflow
7 2 (0.53%) WebLogic
8 1 (0.26%) Apache Airflow
8 1 (0.26%) CMS
8 1 (0.26%) Skype for Business
8 1 (0.26%) WordPress
Applications
1 27 (7.12%) Microsoft Office
2 2 (0.53%) Microsoft Excel
Business Applications
1 1 (0.26%) Magento
Cloud Services
1 301 (79.42%) AWS
2 173 (45.65%) Azure
3 170 (44.85%) Amazon EC2
4 139 (36.68%) Amazon S3
5 125 (32.98%) Serverless
6 115 (30.34%) AWS Lambda
7 93 (24.54%) Microsoft 365
8 75 (19.79%) AWS CloudFormation
9 54 (14.25%) Amazon ECS
10 51 (13.46%) Amazon EKS
11 42 (11.08%) GitHub
11 42 (11.08%) SaaS
12 40 (10.55%) Amazon CloudWatch
13 37 (9.76%) GCP
13 37 (9.76%) Virtual Private Cloud
14 31 (8.18%) Route 53
15 29 (7.65%) Entra ID
16 20 (5.28%) Amazon SQS
17 19 (5.01%) AWS Step Functions
18 18 (4.75%) CloudFront
Communications & Networking
1 62 (16.36%) DNS
2 57 (15.04%) VPN
3 55 (14.51%) DHCP
4 50 (13.19%) Firewall
5 39 (10.29%) SAN
6 38 (10.03%) Wireless
7 34 (8.97%) LAN
8 32 (8.44%) WAN
9 27 (7.12%) Internet
10 23 (6.07%) Structured Cabling
11 21 (5.54%) VLAN
12 19 (5.01%) Remote Desktop
12 19 (5.01%) VoIP
13 13 (3.43%) TCP/IP
14 9 (2.37%) Wi-Fi
15 8 (2.11%) Skype
16 6 (1.58%) Network Security
16 6 (1.58%) PBX
17 5 (1.32%) HTTP
18 4 (1.06%) ADSL
Database & Business Intelligence
1 82 (21.64%) MySQL
2 59 (15.57%) PostgreSQL
3 50 (13.19%) Amazon Redshift
4 48 (12.66%) DynamoDB
5 44 (11.61%) SQL Server
6 18 (4.75%) Data Warehouse
6 18 (4.75%) Elasticsearch
7 17 (4.49%) Redis
8 16 (4.22%) MongoDB
9 15 (3.96%) Amazon Athena
9 15 (3.96%) Amazon Aurora
10 14 (3.69%) Relational Database
11 12 (3.17%) Amazon QuickSight
11 12 (3.17%) Power BI
12 9 (2.37%) BusinessObjects
12 9 (2.37%) NoSQL
12 9 (2.37%) Parquet
13 8 (2.11%) Data Lake
14 5 (1.32%) Tableau
15 4 (1.06%) Big Data
Development Applications
1 99 (26.12%) Jenkins
2 80 (21.11%) Git
3 48 (12.66%) GitLab
4 41 (10.82%) Maven
5 25 (6.60%) IntelliJ
6 24 (6.33%) Artifactory
7 17 (4.49%) JIRA
7 17 (4.49%) SonarQube
8 9 (2.37%) Travis CI
9 7 (1.85%) JUnit
10 6 (1.58%) Bitbucket
10 6 (1.58%) Postman
10 6 (1.58%) Subversion
11 4 (1.06%) CircleCI
11 4 (1.06%) DbUnit
11 4 (1.06%) jMock
11 4 (1.06%) Mockito
11 4 (1.06%) Sonatype Nexus
11 4 (1.06%) TestNG
12 3 (0.79%) Selenium
General
1 121 (31.93%) Social Skills
2 67 (17.68%) Finance
3 45 (11.87%) Analytical Skills
4 23 (6.07%) Telecoms
5 12 (3.17%) Front Office
6 10 (2.64%) Public Sector
6 10 (2.64%) Retail
7 6 (1.58%) Inclusion and Diversity
8 5 (1.32%) Billing
8 5 (1.32%) Law
8 5 (1.32%) Organisational Skills
9 3 (0.79%) Back Office
9 3 (0.79%) Banking
9 3 (0.79%) Documentation Skills
9 3 (0.79%) Influencing Skills
9 3 (0.79%) Publishing
10 2 (0.53%) Electronics
10 2 (0.53%) Manufacturing
10 2 (0.53%) Presentation Skills
11 1 (0.26%) Advertising
Job Titles
1 80 (21.11%) DevOps Engineer
2 74 (19.53%) Developer
3 53 (13.98%) Senior
4 52 (13.72%) AWS Engineer
5 44 (11.61%) AWS DevOps
6 43 (11.35%) AWS DevOps Engineer
7 35 (9.23%) Java Developer
8 33 (8.71%) Infrastructure Engineer
9 30 (7.92%) Senior Developer
10 29 (7.65%) Senior Java Developer
11 28 (7.39%) Architect
12 27 (7.12%) Support Engineer
13 26 (6.86%) React Developer
14 25 (6.60%) J2EE Developer
14 25 (6.60%) Java/J2EE Developer
14 25 (6.60%) JavaScript Developer
14 25 (6.60%) Senior J2EE Developer
14 25 (6.60%) Senior Java/J2EE Developer
14 25 (6.60%) Senior JavaScript Developer
14 25 (6.60%) Senior React Developer
Libraries, Frameworks & Software Standards
1 38 (10.03%) J2EE
2 36 (9.50%) CSS
2 36 (9.50%) HTML
3 34 (8.97%) React
4 28 (7.39%) Redux
5 26 (6.86%) React Native
6 25 (6.60%) jOOQ
7 21 (5.54%) AngularJS
8 18 (4.75%) Node.js
9 17 (4.49%) Elastic Stack
9 17 (4.49%) REST
10 16 (4.22%) Kafka
11 15 (3.96%) LDAP
11 15 (3.96%) RabbitMQ
11 15 (3.96%) Web Services
12 14 (3.69%) GraphQL
13 13 (3.43%) Lambda Expressions
14 12 (3.17%) Vue
15 11 (2.90%) AWS SAM
16 9 (2.37%) .NET
Miscellaneous
1 34 (8.97%) Self-Motivation
2 20 (5.28%) Clustering
2 20 (5.28%) Private Cloud
3 14 (3.69%) Tandem
4 13 (3.43%) Enterprise Software
5 12 (3.17%) Public Cloud
6 11 (2.90%) Onboarding
7 10 (2.64%) Algorithms
8 9 (2.37%) Renewable Energy
9 7 (1.85%) Distributed Systems
9 7 (1.85%) Driving Licence
9 7 (1.85%) Replication
10 6 (1.58%) Data Centre
10 6 (1.58%) Hybrid Cloud
11 5 (1.32%) Cloud Native
11 5 (1.32%) Enterprise Storage
11 5 (1.32%) Greenfield Project
11 5 (1.32%) Linux Command Line
12 4 (1.06%) Hedge funds
12 4 (1.06%) Web3
Operating Systems
1 130 (34.30%) Windows
2 91 (24.01%) Windows Server
3 76 (20.05%) Linux
4 43 (11.35%) Mac OS
5 28 (7.39%) Windows Server 2016
5 28 (7.39%) Windows Server 2019
6 25 (6.60%) Windows Server 2012
7 10 (2.64%) Unix
8 9 (2.37%) Windows 10
9 6 (1.58%) Debian
9 6 (1.58%) Ubuntu
10 4 (1.06%) Mac OS X
11 2 (0.53%) Apple iOS
11 2 (0.53%) CentOS
11 2 (0.53%) Red Hat Enterprise Linux
11 2 (0.53%) Solaris
11 2 (0.53%) VMS
12 1 (0.26%) Amazon Linux
12 1 (0.26%) Android
12 1 (0.26%) Windows 7
Processes & Methodologies
1 126 (33.25%) Problem-Solving
2 113 (29.82%) CI/CD
3 112 (29.55%) DevOps
4 109 (28.76%) Agile
5 72 (19.00%) Infrastructure as Code
6 71 (18.73%) High Availability
7 69 (18.21%) Containerisation
8 65 (17.15%) Customer Service
9 63 (16.62%) Microservices
10 59 (15.57%) ITIL
11 43 (11.35%) Computer Science
12 41 (10.82%) Mentoring
13 39 (10.29%) Software Engineering
14 34 (8.97%) Infrastructure Engineering
15 32 (8.44%) Configuration Management
16 31 (8.18%) Change Management
16 31 (8.18%) Deployment Automation
17 30 (7.92%) Data Modelling
17 30 (7.92%) ERP
18 29 (7.65%) ETL
Programming Languages
1 138 (36.41%) Python
2 111 (29.29%) SQL
3 102 (26.91%) Java
4 65 (17.15%) Bash
5 59 (15.57%) PowerShell
6 51 (13.46%) JavaScript
7 19 (5.01%) Go
8 16 (4.22%) Ruby
9 15 (3.96%) Perl
10 11 (2.90%) C#
11 10 (2.64%) Shell Script
12 8 (2.11%) PHP
13 7 (1.85%) TypeScript
14 6 (1.58%) PL/SQL
15 5 (1.32%) T-SQL
16 4 (1.06%) Bicep
17 2 (0.53%) Groovy
18 1 (0.26%) R
18 1 (0.26%) Scala
18 1 (0.26%) VBScript
Qualifications
1 57 (15.04%) Degree
2 53 (13.98%) Security Cleared
3 46 (12.14%) SC Cleared
4 40 (10.55%) Computer Science Degree
5 29 (7.65%) AWS Certification
6 28 (7.39%) Azure Certification
7 14 (3.69%) Microsoft Certification
8 12 (3.17%) DV Cleared
9 9 (2.37%) AWS Certified DevOps Engineer
10 8 (2.11%) Cisco Certification
11 7 (1.85%) A+ Certification
11 7 (1.85%) AWS Certified Solutions Architect
12 6 (1.58%) CCNA
12 6 (1.58%) DBS Check
12 6 (1.58%) MCSA
13 4 (1.06%) BPSS Clearance
13 4 (1.06%) Network+ Certification
14 3 (0.79%) CompTIA Security+
14 3 (0.79%) Master's Degree
14 3 (0.79%) MCITP
Quality Assurance & Compliance
1 29 (7.65%) SLA
2 24 (6.33%) QA
3 3 (0.79%) Data Quality
3 3 (0.79%) GDPR
4 2 (0.53%) Accessibility
4 2 (0.53%) ISO/IEC 27001
4 2 (0.53%) PCI DSS
5 1 (0.26%) HIPAA
5 1 (0.26%) ISO 22301
5 1 (0.26%) NIST
System Software
1 150 (39.58%) Docker
2 124 (32.72%) Active Directory
3 77 (20.32%) VMware Infrastructure
4 72 (19.00%) Hyper-V
5 18 (4.75%) Virtual Machines
6 16 (4.22%) Firmware
7 9 (2.37%) VMware Workstation
8 7 (1.85%) Virtual Desktop
9 4 (1.06%) VMware ESXi
10 3 (0.79%) NFS
11 2 (0.53%) Microsoft App-V
11 2 (0.53%) Postfix
11 2 (0.53%) Terminal Services
12 1 (0.26%) Shibboleth
12 1 (0.26%) Virtual Servers
12 1 (0.26%) vSphere
Systems Management
1 126 (33.25%) Terraform
2 116 (30.61%) Kubernetes
3 43 (11.35%) Microsoft Intune
4 41 (10.82%) Ansible
5 32 (8.44%) SCOM
6 24 (6.33%) Grafana
7 23 (6.07%) SCCM
8 18 (4.75%) Failover Clustering
8 18 (4.75%) SCVMM
9 17 (4.49%) Progress Chef
10 16 (4.22%) FortiGate
11 15 (3.96%) Microsoft Data Protection Manager
11 15 (3.96%) Prometheus
12 12 (3.17%) Kustomize
12 12 (3.17%) Puppet
13 8 (2.11%) SmoothWall
13 8 (2.11%) WSUS
14 6 (1.58%) PaperCut
15 5 (1.32%) Salt
16 4 (1.06%) Packer
Vendors
1 108 (28.50%) Microsoft
2 102 (26.91%) VMware
3 63 (16.62%) Veeam
4 46 (12.14%) Cisco
5 45 (11.87%) Oracle
6 40 (10.55%) Citrix
7 32 (8.44%) Commvault
8 25 (6.60%) HP
9 24 (6.33%) Mitel
9 24 (6.33%) Nimble Storage
10 23 (6.07%) Zerto
11 21 (5.54%) Kaseya
12 16 (4.22%) Aruba
13 14 (3.69%) Barracuda Networks
14 13 (3.43%) AppDynamics
15 12 (3.17%) Google
16 9 (2.37%) Meraki
16 9 (2.37%) SAP
17 6 (1.58%) Atlassian
17 6 (1.58%) YouTube