Node
UK

The following table provides summary statistics for permanent job vacancies with a requirement for Node.js skills. Included is a benchmarking guide to the salaries offered in vacancies that have cited Node.js over the 6 months to 7 December 2023 with a comparison to the same period in the previous 2 years.

6 months to
7 Dec 2023
Same period 2022 Same period 2021
Rank 131 72 40
Rank change year-on-year -59 -32 +3
Permanent jobs citing Node.js 1,370 5,499 8,620
As % of all permanent jobs advertised in the UK 2.59% 4.48% 6.73%
As % of the Libraries, Frameworks & Software Standards category 9.82% 13.79% 17.47%
Number of salaries quoted 1,011 2,810 4,517
10th Percentile £45,000 £46,250 £40,750
25th Percentile £55,750 £56,250 £50,000
Median annual salary (50th Percentile) £72,500 £70,000 £67,500
Median % change year-on-year +3.57% +3.70% +12.50%
75th Percentile £88,375 £87,500 £85,000
90th Percentile £112,500 £102,500 £101,250
UK excluding London median annual salary £65,000 £62,500 £55,000
% change year-on-year +4.00% +13.64% +10.00%

All Software Libraries and Frameworks
UK

Node.js is in the Software Libraries and Frameworks category. The following table is for comparison with the above and provides summary statistics for all permanent job vacancies with a requirement for technical specification, industry standards, software libraries and framework skills.

Permanent vacancies with a requirement for technical specification, industry standards, software libraries and framework skills 13,950 39,876 49,341
As % of all permanent jobs advertised in the UK 26.33% 32.46% 38.50%
Number of salaries quoted 10,888 24,229 32,106
10th Percentile £41,250 £40,000 £36,750
25th Percentile £51,250 £50,000 £45,000
Median annual salary (50th Percentile) £65,500 £65,000 £60,000
Median % change year-on-year +0.77% +8.33% +4.35%
75th Percentile £85,000 £86,250 £80,000
90th Percentile £106,289 £105,000 £96,250
UK excluding London median annual salary £57,500 £57,500 £52,500
% change year-on-year - +9.52% +5.00%

Node.js
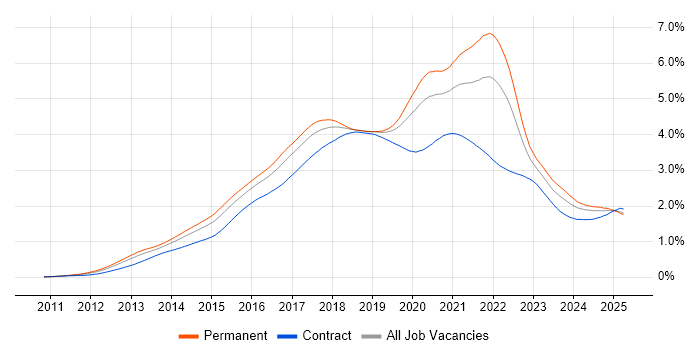
Job Vacancy Trend

Job postings citing Node.js as a proportion of all IT jobs advertised.

Job vacancy trend for Node.js in the UK

Node.js
Salary Trend

3-month moving average salary quoted in jobs citing Node.js.

Salary trend for Node.js in the UK

Node.js
Salary Histogram

Salary distribution for jobs citing Node.js over the 6 months to 7 December 2023.

Salary histogram for Node.js in the UK

Node.js
Top 17 Job Locations

The table below looks at the demand and provides a guide to the median salaries quoted in IT jobs citing Node.js within the UK over the 6 months to 7 December 2023. The 'Rank Change' column provides an indication of the change in demand within each location based on the same 6 month period last year.

Location Rank Change
on Same Period
Last Year
Matching
Permanent
IT Job Ads
Median Salary
Past 6 Months
Median Salary
% Change
on Same Period
Last Year
Live
Jobs
England -58 1,152 £72,500 +3.57% 769
Work from Home -37 826 £70,000 - 540
UK excluding London -27 816 £65,000 +4.00% 510
London -71 462 £85,000 +6.25% 366
North of England +21 294 £60,000 -7.69% 160
North West +38 179 £55,000 -12.00% 102
Midlands +57 143 £62,500 +0.81% 59
South East -52 136 £70,000 +7.69% 161
Yorkshire +9 103 £63,750 -3.77% 39
Scotland -45 100 £72,500 +16.00% 34
South West -38 87 £65,000 +13.04% 50
East Midlands +49 82 £65,000 - 19
West Midlands +45 61 £57,500 -4.17% 40
Wales -40 26 £51,104 -14.83% 10
East of England -36 17 £65,000 -7.14% 42
Northern Ireland -31 15 £45,000 -30.77% 7
North East -7 12 £61,500 -5.38% 19

Node.js
Co-occurring Skills and Capabilities by Category

The follow tables expand on the table above by listing co-occurrences grouped by category. The same employment type, locality and period is covered with up to 20 co-occurrences shown in each of the following categories:

Application Platforms
1 46 (3.36%) Apache
2 28 (2.04%) Apache Airflow
3 24 (1.75%) CMS
3 24 (1.75%) Confluence
4 17 (1.24%) OpenStack
5 16 (1.17%) nginx
6 13 (0.95%) Tomcat
7 12 (0.88%) Apache Spark
8 10 (0.73%) Adobe Experience Manager
8 10 (0.73%) Drupal
9 9 (0.66%) Apache Solr
9 9 (0.66%) IIS
9 9 (0.66%) JBoss
9 9 (0.66%) Red Hat Fuse
9 9 (0.66%) WordPress
10 4 (0.29%) Headless CMS
11 2 (0.15%) Cloud Foundry
11 2 (0.15%) Ethereum
11 2 (0.15%) Hedera
11 2 (0.15%) IBM HTTP Server
Applications
1 11 (0.80%) Chatbot
2 4 (0.29%) Trello
3 2 (0.15%) Campfire
Business Applications
1 12 (0.88%) SAP S/4HANA
2 10 (0.73%) Oracle EBS
3 8 (0.58%) Shopify
4 3 (0.22%) Dynamics NAV
5 2 (0.15%) Oracle Cash Management
6 1 (0.073%) Magento
6 1 (0.073%) R3 Corda
6 1 (0.073%) Salesforce CRM
Cloud Services
1 580 (42.34%) AWS
2 354 (25.84%) Azure
3 265 (19.34%) Serverless
4 258 (18.83%) GCP
5 87 (6.35%) SaaS
6 82 (5.99%) GitHub
7 76 (5.55%) AWS Lambda
8 42 (3.07%) Azure DevOps
9 38 (2.77%) Amazon ECS
9 38 (2.77%) Amazon EKS
10 30 (2.19%) npm
11 29 (2.12%) Amazon S3
11 29 (2.12%) AWS CloudFormation
12 26 (1.90%) Cloud Computing
13 22 (1.61%) Azure Sentinel
14 21 (1.53%) Amazon EC2
14 21 (1.53%) PaaS
15 20 (1.46%) Amazon SQS
16 19 (1.39%) Azure Cosmos DB
17 17 (1.24%) GitHub Actions
Communications & Networking
1 31 (2.26%) WAN
2 24 (1.75%) LAN
3 19 (1.39%) HTTP
4 14 (1.02%) AMQP
5 9 (0.66%) Internet
6 7 (0.51%) Bluetooth
6 7 (0.51%) Firewall
7 5 (0.36%) DNS
8 4 (0.29%) RFID
8 4 (0.29%) VPN
9 2 (0.15%) Reverse Proxy
10 1 (0.073%) ATM
10 1 (0.073%) Fibre Channel
10 1 (0.073%) iSCSI
10 1 (0.073%) NAS
10 1 (0.073%) Network Security
10 1 (0.073%) SAN
10 1 (0.073%) SMS
10 1 (0.073%) TCP/IP
10 1 (0.073%) VLAN
Database & Business Intelligence
1 190 (13.87%) PostgreSQL
2 170 (12.41%) Relational Database
3 159 (11.61%) MongoDB
4 146 (10.66%) MySQL
5 120 (8.76%) RDBMS
6 114 (8.32%) NoSQL
7 102 (7.45%) SQL Server
8 89 (6.50%) Oracle Database
9 51 (3.72%) Elasticsearch
10 36 (2.63%) DynamoDB
11 35 (2.55%) Redis
12 28 (2.04%) Apache Ignite
13 27 (1.97%) Big Data
14 19 (1.39%) SQL Server Integration Services
15 18 (1.31%) Amazon RDS
16 16 (1.17%) Amazon Aurora
17 12 (0.88%) Amazon Athena
17 12 (0.88%) Hadoop
18 11 (0.80%) Data Warehouse
19 10 (0.73%) SQL Server Reporting Services
Development Applications
1 354 (25.84%) Git
2 97 (7.08%) Jenkins
3 72 (5.26%) Cypress.io
4 58 (4.23%) JIRA
5 52 (3.80%) Maven
6 50 (3.65%) webpack
7 36 (2.63%) GitLab
7 36 (2.63%) JDeveloper
8 31 (2.26%) Cucumber
9 28 (2.04%) JUnit
9 28 (2.04%) Mocha
10 24 (1.75%) Sonatype Nexus
11 22 (1.61%) Selenium
12 18 (1.31%) Postman
13 14 (1.02%) CircleCI
14 12 (0.88%) SonarQube
14 12 (0.88%) Visual Studio
15 10 (0.73%) Gradle
15 10 (0.73%) gulp
15 10 (0.73%) TeamCity
General
1 281 (20.51%) Social Skills
2 272 (19.85%) Finance
3 120 (8.76%) Banking
4 94 (6.86%) Analytical Skills
5 82 (5.99%) Inclusion and Diversity
6 74 (5.40%) Front Office
7 63 (4.60%) Retail
8 51 (3.72%) Police
9 49 (3.58%) Law
10 46 (3.36%) Public Sector
11 39 (2.85%) Tech for Good
12 34 (2.48%) Marketing
13 17 (1.24%) Telecoms
14 16 (1.17%) Automotive
15 14 (1.02%) Games
16 13 (0.95%) Aviation
16 13 (0.95%) Financial Institution
17 11 (0.80%) Pharmaceutical
18 10 (0.73%) Publishing
18 10 (0.73%) Social Housing
Job Titles
1 715 (52.19%) Developer
2 391 (28.54%) Software Engineer
3 337 (24.60%) Senior
4 234 (17.08%) Full Stack Developer
5 178 (12.99%) Senior Developer
6 132 (9.64%) React Developer
7 120 (8.76%) Full Stack Engineer
8 116 (8.47%) Lead
9 104 (7.59%) Front-End Developer (Client-Side Developer)
10 101 (7.37%) Software Developer
11 87 (6.35%) Ruby Engineer
12 82 (5.99%) Full Stack Software Engineer
13 75 (5.47%) Developer/Software Engineer
14 62 (4.53%) Java Developer
15 61 (4.45%) Senior Software Engineer
16 60 (4.38%) Python Engineer
17 59 (4.31%) Angular Developer
18 58 (4.23%) Python Developer
19 56 (4.09%) JavaScript Developer
20 53 (3.87%) Python Software Engineer
Libraries, Frameworks & Software Standards
1 820 (59.85%) React
2 308 (22.48%) CSS
3 298 (21.75%) AngularJS
3 298 (21.75%) HTML
4 215 (15.69%) Express.js
5 186 (13.58%) RESTful
6 147 (10.73%) .NET
7 135 (9.85%) REST
8 115 (8.39%) Redux
9 114 (8.32%) GraphQL
10 105 (7.66%) HTML5
11 98 (7.15%) Spring
12 93 (6.79%) Web Services
13 83 (6.06%) MERN Stack
13 83 (6.06%) Spring Boot
14 77 (5.62%) Jest
14 77 (5.62%) Next.js
15 71 (5.18%) Vue
16 59 (4.31%) JSON
17 55 (4.01%) XML
Miscellaneous
1 66 (4.82%) Product Ownership
2 64 (4.67%) Distributed Systems
3 62 (4.53%) Fixed Income
4 49 (3.58%) Cloud Native
5 47 (3.43%) Mobile App
6 45 (3.28%) Self-Motivation
7 41 (2.99%) Greenfield Project
8 40 (2.92%) Public Cloud
9 31 (2.26%) Linux Command Line
10 29 (2.12%) Cyberattack
11 24 (1.75%) IoT
12 23 (1.68%) Hybrid Cloud
12 23 (1.68%) Virtual Team
13 19 (1.39%) Onboarding
14 17 (1.24%) Equities
14 17 (1.24%) Legacy Systems
15 13 (0.95%) Blog
16 12 (0.88%) Derivative
17 11 (0.80%) Algorithms
17 11 (0.80%) Data Structures
Operating Systems
1 93 (6.79%) Linux
2 24 (1.75%) Windows
3 16 (1.17%) Android
3 16 (1.17%) Apple iOS
4 12 (0.88%) Ubuntu
5 8 (0.58%) Mac OS
5 8 (0.58%) Red Hat Enterprise Linux
6 7 (0.51%) CentOS
7 5 (0.36%) Debian
7 5 (0.36%) Unix
8 2 (0.15%) Windows 10
9 1 (0.073%) VMS
Processes & Methodologies
1 638 (46.57%) Agile
2 597 (43.58%) Software Engineering
3 438 (31.97%) Full Stack Development
4 399 (29.12%) DevOps
5 382 (27.88%) Problem-Solving
6 346 (25.26%) Microservices
7 215 (15.69%) CI/CD
8 186 (13.58%) TDD
9 169 (12.34%) Continuous Integration
10 164 (11.97%) Design Patterns
11 163 (11.90%) Actionable Insight
12 159 (11.61%) Front End Development
13 152 (11.09%) Containerisation
14 150 (10.95%) Scrum
15 146 (10.66%) Unit Testing
16 144 (10.51%) User Experience
17 135 (9.85%) Code Quality
17 135 (9.85%) Open Source
18 129 (9.42%) Mentoring
19 122 (8.91%) Clean Code
Programming Languages
1 811 (59.20%) JavaScript
2 550 (40.15%) TypeScript
3 413 (30.15%) Java
4 404 (29.49%) Python
5 186 (13.58%) SQL
6 171 (12.48%) Go
7 169 (12.34%) C#
8 131 (9.56%) Ruby
9 125 (9.12%) Bash
10 89 (6.50%) Perl
11 86 (6.28%) PHP
12 38 (2.77%) C++
13 32 (2.34%) Rust
14 27 (1.97%) Kotlin
15 23 (1.68%) JSX
15 23 (1.68%) PowerShell
15 23 (1.68%) VB
16 14 (1.02%) C
16 14 (1.02%) T-SQL
17 12 (0.88%) PL/SQL
Qualifications
1 185 (13.50%) Security Cleared
2 166 (12.12%) Degree
3 138 (10.07%) SC Cleared
4 56 (4.09%) AWS Certification
5 41 (2.99%) DV Cleared
6 34 (2.48%) Computer Science Degree
7 25 (1.82%) BPSS Clearance
8 24 (1.75%) AWS Certified Solutions Architect
9 23 (1.68%) AWS Certified Cloud Practitioner
9 23 (1.68%) AWS Certified Developer
10 15 (1.09%) Azure Certification
11 12 (0.88%) Master's Degree
12 10 (0.73%) MBA
13 5 (0.36%) OCP
13 5 (0.36%) Oracle Certification
14 2 (0.15%) Microsoft Certification
15 1 (0.073%) ISEB
15 1 (0.073%) ISTQB
15 1 (0.073%) ISTQB Foundation Certification
Quality Assurance & Compliance
1 187 (13.65%) QA
2 41 (2.99%) Accessibility
3 19 (1.39%) WCAG
4 8 (0.58%) ISO/IEC 27001
5 6 (0.44%) GAAP
5 6 (0.44%) ISO 9000
5 6 (0.44%) PCI DSS
6 3 (0.22%) HL7
7 2 (0.15%) NCSC
7 2 (0.15%) WAI
System Software
1 215 (15.69%) Docker
2 11 (0.80%) Hyper-V
3 7 (0.51%) VMware NSX
4 4 (0.29%) Virtual Machines
5 3 (0.22%) Virtual Servers
5 3 (0.22%) VMware Infrastructure
6 2 (0.15%) vSphere
7 1 (0.073%) Active Directory
7 1 (0.073%) NFS
7 1 (0.073%) Varnish
Systems Management
1 236 (17.23%) Kubernetes
2 96 (7.01%) Terraform
3 39 (2.85%) Ansible
4 26 (1.90%) Grafana
5 21 (1.53%) Kibana
6 11 (0.80%) Prometheus
6 11 (0.80%) Puppet
7 7 (0.51%) Progress Chef
8 6 (0.44%) Istio
9 3 (0.22%) Single Sign-On
10 1 (0.073%) Consul
10 1 (0.073%) cPanel
10 1 (0.073%) Docker Swarm
10 1 (0.073%) Kiali
10 1 (0.073%) Nagios
10 1 (0.073%) Salt
10 1 (0.073%) ZABBIX
Vendors
1 124 (9.05%) Oracle
2 106 (7.74%) Google
3 104 (7.59%) Microsoft
4 17 (1.24%) SAP
4 17 (1.24%) Splunk
4 17 (1.24%) WSO2
5 13 (0.95%) Adobe
6 11 (0.80%) Dynatrace
7 10 (0.73%) PagerDuty
7 10 (0.73%) Sun
7 10 (0.73%) VMware
8 9 (0.66%) ServiceNow
9 8 (0.58%) New Relic
10 7 (0.51%) Xamarin
11 6 (0.44%) Red Hat
11 6 (0.44%) SaltStack
12 4 (0.29%) Adyen
12 4 (0.29%) Apple
13 3 (0.22%) mParticle
13 3 (0.22%) Tealium