Incident Response Contract Job Trends in London

Incident Response
England > London

The table below provides summary statistics and contractor rates for jobs advertised in London requiring Incident Response skills. It covers vacancies from the 6 months leading up to 6 September 2025, with comparisons to the same periods in the previous two years.

6 months to
6 Sep 2025
Same period 2024 Same period 2023
Rank 147 260 261
Rank change year-on-year +113 +1 +170
Contract jobs citing Incident Response 248 142 200
As % of all contract jobs advertised in London 1.85% 0.88% 0.89%
As % of the Processes & Methodologies category 2.00% 0.99% 0.98%
Number of daily rates quoted 153 100 163
10th Percentile £400 £348 £425
25th Percentile £463 £450 £500
Median daily rate (50th Percentile) £575 £525 £600
Median % change year-on-year +9.52% -12.50% +4.35%
75th Percentile £650 £652 £750
90th Percentile £750 £775 £875
England median daily rate £550 £575 £600
% change year-on-year -4.35% -4.17% +5.59%
Number of hourly rates quoted 2 1 0
10th Percentile £46.45 - -
25th Percentile £47.50 - -
Median hourly rate £56.00 £30.12 -
Median % change year-on-year +85.92% - -
75th Percentile £63.00 - -
90th Percentile £63.15 - -
England median hourly rate £54.50 £57.50 -
% change year-on-year -5.22% - -

All Process and Methodology Skills
London

Incident Response falls under the Processes and Methodologies category. For comparison with the information above, the following table provides summary statistics for all contract job vacancies requiring process or methodology skills in London.

Contract vacancies with a requirement for process or methodology skills 12,375 14,377 20,443
As % of all contract IT jobs advertised in London 92.44% 89.03% 90.55%
Number of daily rates quoted 8,192 9,775 14,840
10th Percentile £325 £350 £363
25th Percentile £425 £450 £463
Median daily rate (50th Percentile) £539 £550 £575
Median % change year-on-year -1.97% -4.35% -0.52%
75th Percentile £675 £685 £700
90th Percentile £775 £800 £800
England median daily rate £510 £525 £550
% change year-on-year -2.86% -4.55% -
Number of hourly rates quoted 255 185 224
10th Percentile £17.00 £17.25 £18.05
25th Percentile £25.00 £22.00 £22.50
Median hourly rate £32.00 £35.00 £40.00
Median % change year-on-year -8.57% -12.50% +6.67%
75th Percentile £49.63 £55.00 £64.50
90th Percentile £63.75 £71.88 £77.50
England median hourly rate £25.15 £43.00 £42.50
% change year-on-year -41.51% +1.18% +46.55%

Incident Response
Job Vacancy Trend in London

Job postings citing Incident Response as a proportion of all IT jobs advertised in London.
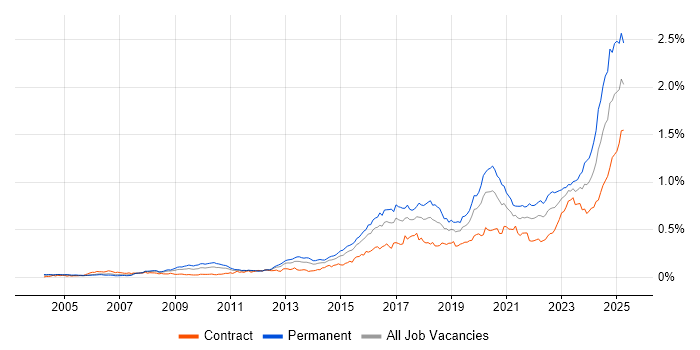
Job vacancy trend for Incident Response in London

Incident Response
Daily Rate Trend in London

Contractor daily rate distribution trend for jobs in London citing Incident Response.

Contractor daily rate distribution trend for jobs in London citing Incident Response

Incident Response
Daily Rate Histogram in London

Daily rate distribution for jobs citing Incident Response in London over the 6 months to 6 September 2025.

Daily rate histogram for Incident Response in London

Incident Response
Hourly Rate Trend in London

Contractor hourly rate distribution trend for jobs in London citing Incident Response.

Contractor hourly rate distribution trend for jobs in London citing Incident Response

Incident Response
Contract Job Locations in London

The table below looks at the demand and provides a guide to the median contractor rates quoted in IT jobs citing Incident Response within the London region over the 6 months to 6 September 2025. The 'Rank Change' column provides an indication of the change in demand within each location based on the same 6 month period last year.

Location Rank Change
on Same Period
Last Year
Matching
Contract
IT Job Ads
Median
Daily Rate
Past 6 Months
Median Daily Rate
% Change
on Same Period
Last Year
Live
Jobs
Central London +22 34 £526 +2.04% 40
East London +4 4 £593 +9.72% 3
West London +2 4 £375 +15.38% 7
South London - 4 £525 - 2
North London - 2 £650 -
Incident Response
England

Incident Response
Co-occurring Skills and Capabilities in London by Category

The follow tables expand on the table above by listing co-occurrences grouped by category. The same employment type, locality and period is covered with up to 20 co-occurrences shown in each of the following categories:

Application Platforms
1 4 (1.61%) Confluence
2 3 (1.21%) SharePoint
3 2 (0.81%) Apache Airflow
3 2 (0.81%) NetWeaver
4 1 (0.40%) Apache
4 1 (0.40%) Apache Spark
Applications
1 2 (0.81%) Microsoft Excel
1 2 (0.81%) Microsoft Office
2 1 (0.40%) Chatbot
2 1 (0.40%) Microsoft PowerPoint
2 1 (0.40%) Microsoft Project
Business Applications
1 3 (1.21%) Shopify
2 2 (0.81%) SAP IBP
3 1 (0.40%) Remedy ITSM
Cloud Services
1 79 (31.85%) Azure
2 54 (21.77%) AWS
3 30 (12.10%) GCP
4 28 (11.29%) Azure Sentinel
5 16 (6.45%) Entra ID
5 16 (6.45%) GitHub
6 13 (5.24%) GitHub Actions
6 13 (5.24%) Microsoft 365
7 10 (4.03%) Amazon CloudWatch
8 9 (3.63%) Datadog
8 9 (3.63%) Microsoft Purview
8 9 (3.63%) SaaS
9 8 (3.23%) Amazon S3
9 8 (3.23%) Azure DevOps
9 8 (3.23%) Azure Monitor
9 8 (3.23%) Virtual Private Cloud
10 7 (2.82%) Amazon EC2
11 6 (2.42%) Akamai
11 6 (2.42%) Cloudflare
12 5 (2.02%) AWS CloudFormation
Communications & Networking
1 52 (20.97%) Firewall
2 27 (10.89%) Network Security
3 14 (5.65%) DNS
4 12 (4.84%) SSL
4 12 (4.84%) TCP/IP
4 12 (4.84%) VPN
5 8 (3.23%) Intrusion Detection
6 6 (2.42%) HTTP
6 6 (2.42%) SSH
6 6 (2.42%) WAN
7 4 (1.61%) HTTPS
7 4 (1.61%) SD-WAN
7 4 (1.61%) SMTP
7 4 (1.61%) SNMP
8 3 (1.21%) Cisco Nexus
9 2 (0.81%) BGP
9 2 (0.81%) Modbus
9 2 (0.81%) Telnet
9 2 (0.81%) VLAN
9 2 (0.81%) Wireless
Database & Business Intelligence
1 3 (1.21%) Data Lake
2 2 (0.81%) Amazon RDS
2 2 (0.81%) Data Warehouse
2 2 (0.81%) Power BI
2 2 (0.81%) SAP BW
2 2 (0.81%) SAP HANA
3 1 (0.40%) Apache Iceberg
3 1 (0.40%) BigQuery
3 1 (0.40%) Delta Lake
3 1 (0.40%) Parquet
3 1 (0.40%) PostgreSQL
Development Applications
1 12 (4.84%) Jenkins
2 9 (3.63%) Git
2 9 (3.63%) GitLab
2 9 (3.63%) JIRA
3 3 (1.21%) CircleCI
4 2 (0.81%) PROIV
5 1 (0.40%) Artifactory
5 1 (0.40%) Jaeger
5 1 (0.40%) Maven
5 1 (0.40%) Metasploit
5 1 (0.40%) Snyk
5 1 (0.40%) SonarQube
General
1 70 (28.23%) Social Skills
2 57 (22.98%) Finance
3 33 (13.31%) Analytical Skills
4 18 (7.26%) Banking
5 15 (6.05%) Legal
5 15 (6.05%) Public Sector
6 8 (3.23%) Local Government
7 7 (2.82%) Financial Institution
7 7 (2.82%) Inclusion and Diversity
7 7 (2.82%) Telecoms
8 6 (2.42%) Military
9 5 (2.02%) Retail
10 4 (1.61%) Documentation Skills
10 4 (1.61%) Manufacturing
11 3 (1.21%) Games
11 3 (1.21%) Law
11 3 (1.21%) Presentation Skills
12 2 (0.81%) Investment Banking
12 2 (0.81%) Marketing
12 2 (0.81%) Pharmaceutical
Job Titles
1 41 (16.53%) Analyst
2 31 (12.50%) Security Engineer
3 30 (12.10%) Consultant
4 27 (10.89%) Security Analyst
5 23 (9.27%) Architect
5 23 (9.27%) Senior
6 21 (8.47%) Lead
7 16 (6.45%) Cybersecurity Analyst
8 15 (6.05%) Security Architect
9 12 (4.84%) Security Consultant
9 12 (4.84%) SOC Analyst
10 10 (4.03%) DevOps Engineer
10 10 (4.03%) Security Manager
10 10 (4.03%) Security Specialist
11 9 (3.63%) SOC Engineer
12 8 (3.23%) SIEM Engineer
13 7 (2.82%) Network Engineer
14 6 (2.42%) Cybersecurity Engineer
14 6 (2.42%) Site Engineer
14 6 (2.42%) Site Reliability Engineer
Libraries, Frameworks & Software Standards
1 5 (2.02%) OAuth
1 5 (2.02%) YAML
2 4 (1.61%) OpenTelemetry
3 3 (1.21%) Bazel
3 3 (1.21%) RESTful
3 3 (1.21%) Unity (Game Engine)
3 3 (1.21%) VML
3 3 (1.21%) Web Services
4 2 (0.81%) .NET
4 2 (0.81%) JSON
4 2 (0.81%) LDAP
4 2 (0.81%) OAuth2
4 2 (0.81%) OpenID
4 2 (0.81%) SAML
4 2 (0.81%) SAP Basis
4 2 (0.81%) SAP Fiori
5 1 (0.40%) Elastic Stack
5 1 (0.40%) gRPC
5 1 (0.40%) Loki
5 1 (0.40%) PySpark
Miscellaneous
1 42 (16.94%) Security Posture
2 30 (12.10%) Cyber Threat
3 15 (6.05%) Management Information System
4 13 (5.24%) Security Operations Centre
5 12 (4.84%) Cloud Native
6 10 (4.03%) Onboarding
7 9 (3.63%) Cyber Defence
8 8 (3.23%) Cyber Kill Chain
8 8 (3.23%) Data Centre
9 6 (2.42%) Distributed Systems
9 6 (2.42%) Insider Threat
10 5 (2.02%) Operational Technology
10 5 (2.02%) PKI
11 4 (1.61%) Analytical Mindset
11 4 (1.61%) Distributed Denial-of-Service
12 3 (1.21%) Cyber Security Posture
12 3 (1.21%) Data Protection Act
12 3 (1.21%) Enterprise Cloud
12 3 (1.21%) Foreign Exchange (FX)
13 2 (0.81%) CSOC
Operating Systems
1 34 (13.71%) Windows
2 20 (8.06%) Linux
3 7 (2.82%) Unix
4 5 (2.02%) Windows Server
5 2 (0.81%) Android
5 2 (0.81%) Mac OS
5 2 (0.81%) Red Hat Enterprise Linux
6 1 (0.40%) CentOS
6 1 (0.40%) Ubuntu
6 1 (0.40%) VMS
6 1 (0.40%) Windows Server 2012
6 1 (0.40%) Windows Server 2019
Processes & Methodologies
1 101 (40.73%) Cybersecurity
2 80 (32.26%) SIEM
3 59 (23.79%) Security Operations
4 46 (18.55%) DevOps
5 44 (17.74%) Information Security
6 42 (16.94%) Threat Intelligence
7 40 (16.13%) Problem-Solving
8 39 (15.73%) Vulnerability Management
9 36 (14.52%) CI/CD
10 35 (14.11%) Threat Detection
11 34 (13.71%) Cloud Security
12 32 (12.90%) Infrastructure as Code
12 32 (12.90%) Risk Management
13 31 (12.50%) Observability
14 29 (11.69%) Security Monitoring
15 26 (10.48%) Cyber Threat Intelligence
15 26 (10.48%) MITRE ATT&CK
16 25 (10.08%) Security Architecture
17 24 (9.68%) Continuous Improvement
18 23 (9.27%) Regulatory Compliance
Programming Languages
1 55 (22.18%) Python
2 36 (14.52%) PowerShell
3 28 (11.29%) Bash
4 26 (10.48%) Kusto Query Language
5 9 (3.63%) JavaScript
6 7 (2.82%) C#
7 6 (2.42%) SQL
8 5 (2.02%) C++
8 5 (2.02%) Go
8 5 (2.02%) TypeScript
9 4 (1.61%) PHP
10 3 (1.21%) Bicep
10 3 (1.21%) Java
10 3 (1.21%) Ruby
11 2 (0.81%) Perl
11 2 (0.81%) PromQL
12 1 (0.40%) C
12 1 (0.40%) Groovy
12 1 (0.40%) Scala
12 1 (0.40%) Shell Script
Qualifications
1 37 (14.92%) Security Cleared
2 35 (14.11%) SC Cleared
3 34 (13.71%) CISSP
4 29 (11.69%) Degree
5 20 (8.06%) CISM
5 20 (8.06%) CompTIA Security+
6 14 (5.65%) CEH
7 10 (4.03%) Cisco Certification
8 8 (3.23%) Computer Science Degree
8 8 (3.23%) ISO 27001 Lead Auditor
9 7 (2.82%) GCIH
10 6 (2.42%) (ISC)2 CCSP
10 6 (2.42%) CISA
10 6 (2.42%) OSCP
10 6 (2.42%) PMP
11 5 (2.02%) GCFA
11 5 (2.02%) GCIA
11 5 (2.02%) GIAC
11 5 (2.02%) SSCP
12 4 (1.61%) CCNA
Quality Assurance & Compliance
1 59 (23.79%) ISO/IEC 27001
2 53 (21.37%) NIST
3 31 (12.50%) GDPR
4 14 (5.65%) PCI DSS
5 11 (4.44%) Cyber Essentials
6 8 (3.23%) GRC
6 8 (3.23%) HIPAA
7 6 (2.42%) SOC 2
8 5 (2.02%) NCSC
9 4 (1.61%) SLA
10 3 (1.21%) EU AI Act
10 3 (1.21%) ISO/IEC 27002 (supersedes ISO/IEC 17799)
10 3 (1.21%) QA
11 2 (0.81%) California Consumer Privacy Act
11 2 (0.81%) FIPS 140-2
11 2 (0.81%) ISO/IEC 42001
11 2 (0.81%) PMO
12 1 (0.40%) Actionable Recommendations
12 1 (0.40%) Cyber Essentials PLUS
12 1 (0.40%) Data Quality
System Software
1 28 (11.29%) Docker
2 20 (8.06%) Active Directory
3 5 (2.02%) Virtual Machines
4 3 (1.21%) Firmware
4 3 (1.21%) Snort
4 3 (1.21%) VMware Infrastructure
5 2 (0.81%) Squid
6 1 (0.40%) Hyper-V
6 1 (0.40%) VMware ESXi
Systems Management
1 26 (10.48%) Kubernetes
2 22 (8.87%) Terraform
3 13 (5.24%) Ansible
4 12 (4.84%) Grafana
5 11 (4.44%) QRadar
6 8 (3.23%) Prometheus
7 7 (2.82%) CSIRT
8 5 (2.02%) Nessus
9 4 (1.61%) Microsoft Intune
10 3 (1.21%) Argo
10 3 (1.21%) SCCM
10 3 (1.21%) Single Sign-On
11 2 (0.81%) CASB
11 2 (0.81%) Nexpose
11 2 (0.81%) Podman
11 2 (0.81%) Suricata
12 1 (0.40%) Computer Emergency Response Teams
12 1 (0.40%) linkerd
12 1 (0.40%) Progress Chef
12 1 (0.40%) Puppet
Vendors
1 85 (34.27%) Microsoft
2 46 (18.55%) Splunk
3 26 (10.48%) ServiceNow
4 14 (5.65%) Palo Alto
5 11 (4.44%) Cisco
5 11 (4.44%) Fortinet
5 11 (4.44%) Google
5 11 (4.44%) Qualys
6 10 (4.03%) Salesforce
6 10 (4.03%) VMware
7 9 (3.63%) Darktrace
7 9 (3.63%) SAP
7 9 (3.63%) Tenable
8 8 (3.23%) CheckPoint
8 8 (3.23%) CrowdStrike
8 8 (3.23%) CyberArk
9 6 (2.42%) F5
9 6 (2.42%) Forcepoint
10 5 (2.02%) Citrix
10 5 (2.02%) IBM